Finance Mini Case Study Assessment 2022
VerifiedAdded on 2022/09/23
|13
|3088
|27
AI Summary
Contribute Materials
Your contribution can guide someone’s learning journey. Share your
documents today.

Running head: FINANCE
Finance
Student Name:
Student Number:
Authors Note:
Finance
Student Name:
Student Number:
Authors Note:
Secure Best Marks with AI Grader
Need help grading? Try our AI Grader for instant feedback on your assignments.
FINANCE
Table of Contents
Introduction:...............................................................................................................................2
Mini Case:..................................................................................................................................2
1. Calculating the expected return and standard deviation of the:.............................................2
2. Detecting the reward to risk ratio by evaluating the standard deviation as a measure of risk:
....................................................................................................................................................3
3. Detecting the expected rate of return for the fund based on Capital Asset Pricing Model:...3
Questions:...................................................................................................................................4
A. Calculating the current value of the stock, while detecting the value of the stock in 5 years:
....................................................................................................................................................4
B. Calculating the bond value, while detecting the effective annual yield on the bond:...........5
C. Providing relevant discussion on the IRR, Payback period and NPV method while
detecting which is the best one:.................................................................................................5
D. Providing information regarding the usefulness and details of WACC:...............................7
E. Providing explanation on the differences between stock and Bond, while understanding the
relationship between bond and interest rates:............................................................................8
Conclusion:..............................................................................................................................10
References and Bibliography:..................................................................................................11
FINANCE
Introduction:
The overall assessment aims in evaluating the mini case study, stock price
performance and bond price. The adequate evaluation has been conducted on the certain
calculations, which can help in determining the appropriate level of expected return and
standard deviation. Further analysis has been conducted for understanding the bond price,
share price value and reward to risk ratio of the company. The evaluation has also stated that
the overall information of the mini case is mainly utilized for deriving the appropriate levels
of share price and the CAPM returns that needs to be provided by the organization. the
assessment also evaluates the information regarding the significance of the investment
appraisal techniques that can be used by the company for evaluating their investment scope.
Further evaluation is conducted on the WACC, which is used by the investor for detecting the
actual return that needs to be provided by the company over the next financial year. Lastly,
the discussion on the difference between the stock and bond is provided.
Mini Case:
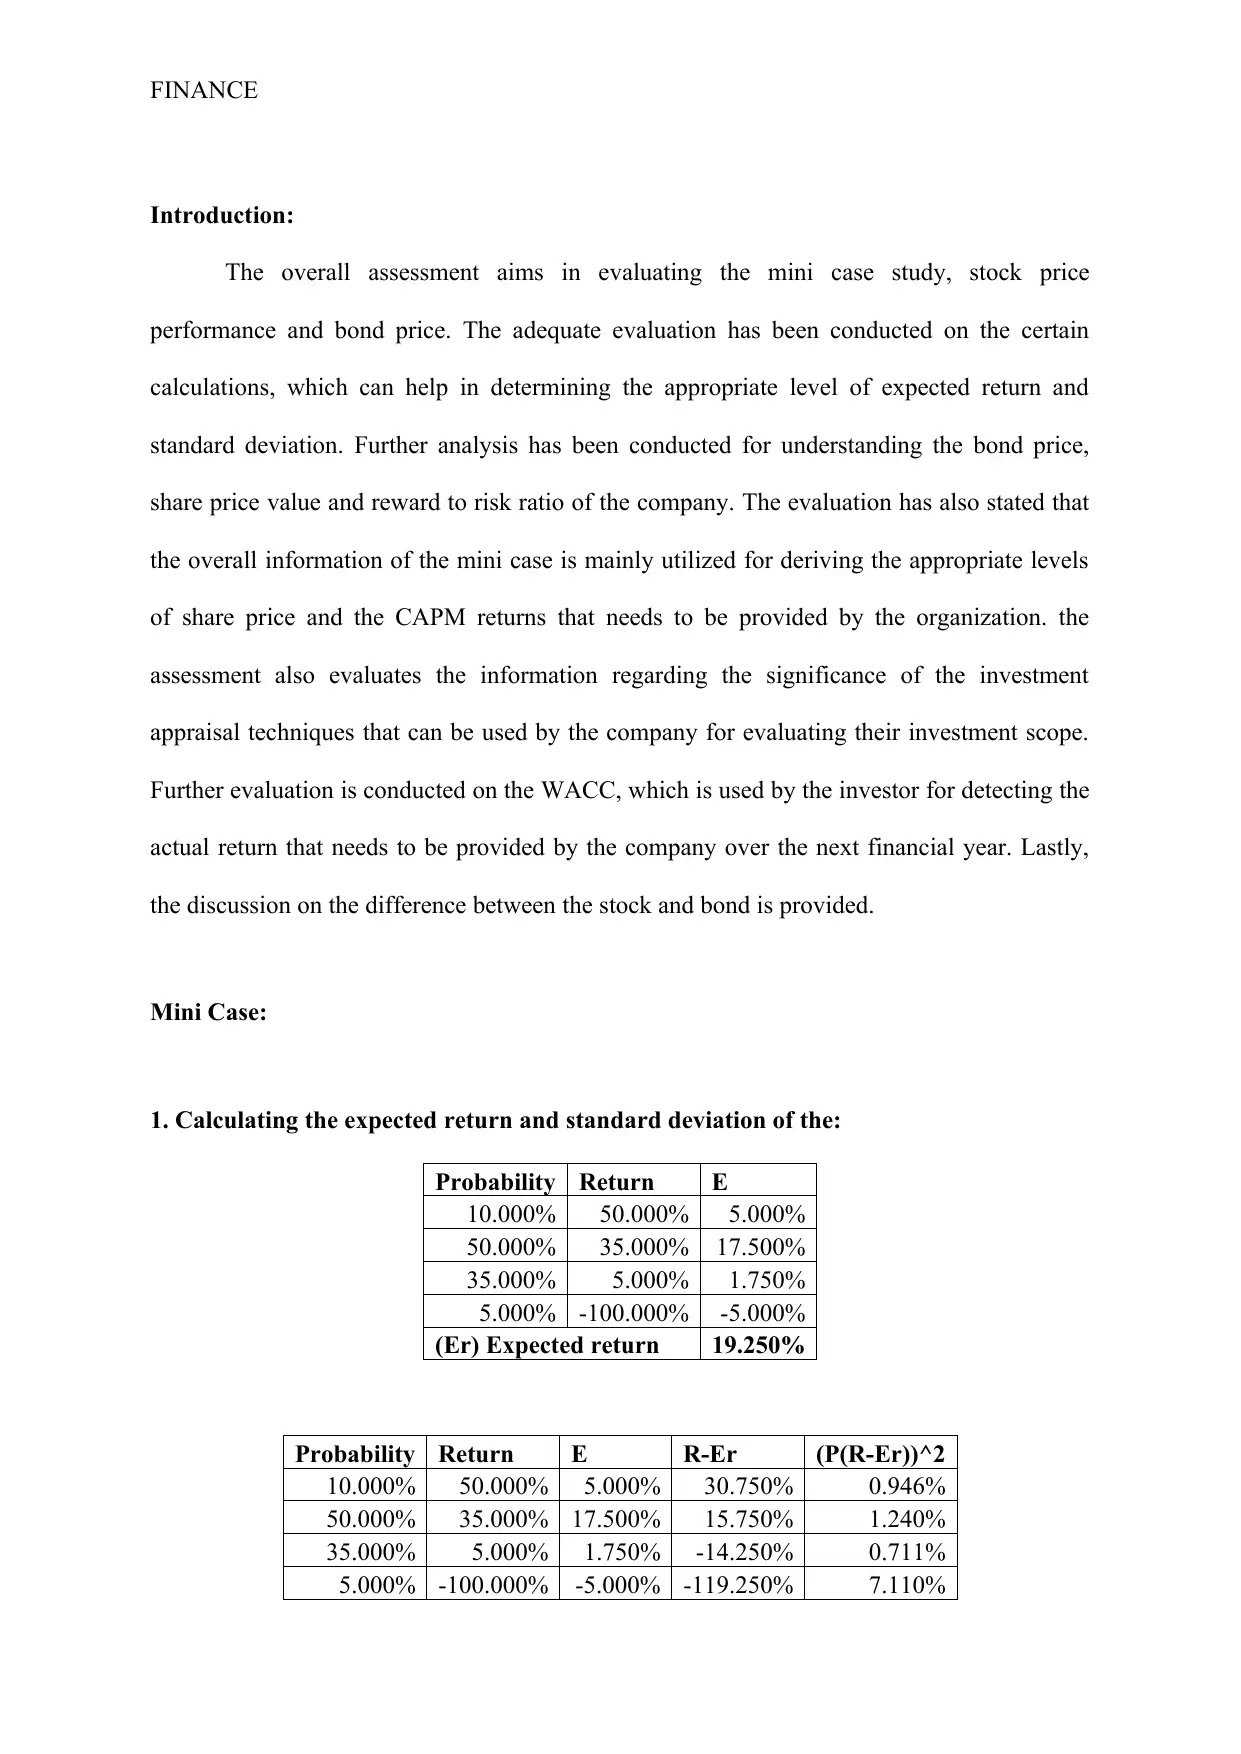
1. Calculating the expected return and standard deviation of the:
Probability Return E
10.000% 50.000% 5.000%
50.000% 35.000% 17.500%
35.000% 5.000% 1.750%
5.000% -100.000% -5.000%
(Er) Expected return 19.250%
Probability Return E R-Er (P(R-Er))^2
10.000% 50.000% 5.000% 30.750% 0.946%
50.000% 35.000% 17.500% 15.750% 1.240%
35.000% 5.000% 1.750% -14.250% 0.711%
5.000% -100.000% -5.000% -119.250% 7.110%
Introduction:
The overall assessment aims in evaluating the mini case study, stock price
performance and bond price. The adequate evaluation has been conducted on the certain
calculations, which can help in determining the appropriate level of expected return and
standard deviation. Further analysis has been conducted for understanding the bond price,
share price value and reward to risk ratio of the company. The evaluation has also stated that
the overall information of the mini case is mainly utilized for deriving the appropriate levels
of share price and the CAPM returns that needs to be provided by the organization. the
assessment also evaluates the information regarding the significance of the investment
appraisal techniques that can be used by the company for evaluating their investment scope.
Further evaluation is conducted on the WACC, which is used by the investor for detecting the
actual return that needs to be provided by the company over the next financial year. Lastly,
the discussion on the difference between the stock and bond is provided.
Mini Case:
1. Calculating the expected return and standard deviation of the:
Probability Return E
10.000% 50.000% 5.000%
50.000% 35.000% 17.500%
35.000% 5.000% 1.750%
5.000% -100.000% -5.000%
(Er) Expected return 19.250%
Probability Return E R-Er (P(R-Er))^2
10.000% 50.000% 5.000% 30.750% 0.946%
50.000% 35.000% 17.500% 15.750% 1.240%
35.000% 5.000% 1.750% -14.250% 0.711%
5.000% -100.000% -5.000% -119.250% 7.110%
FINANCE
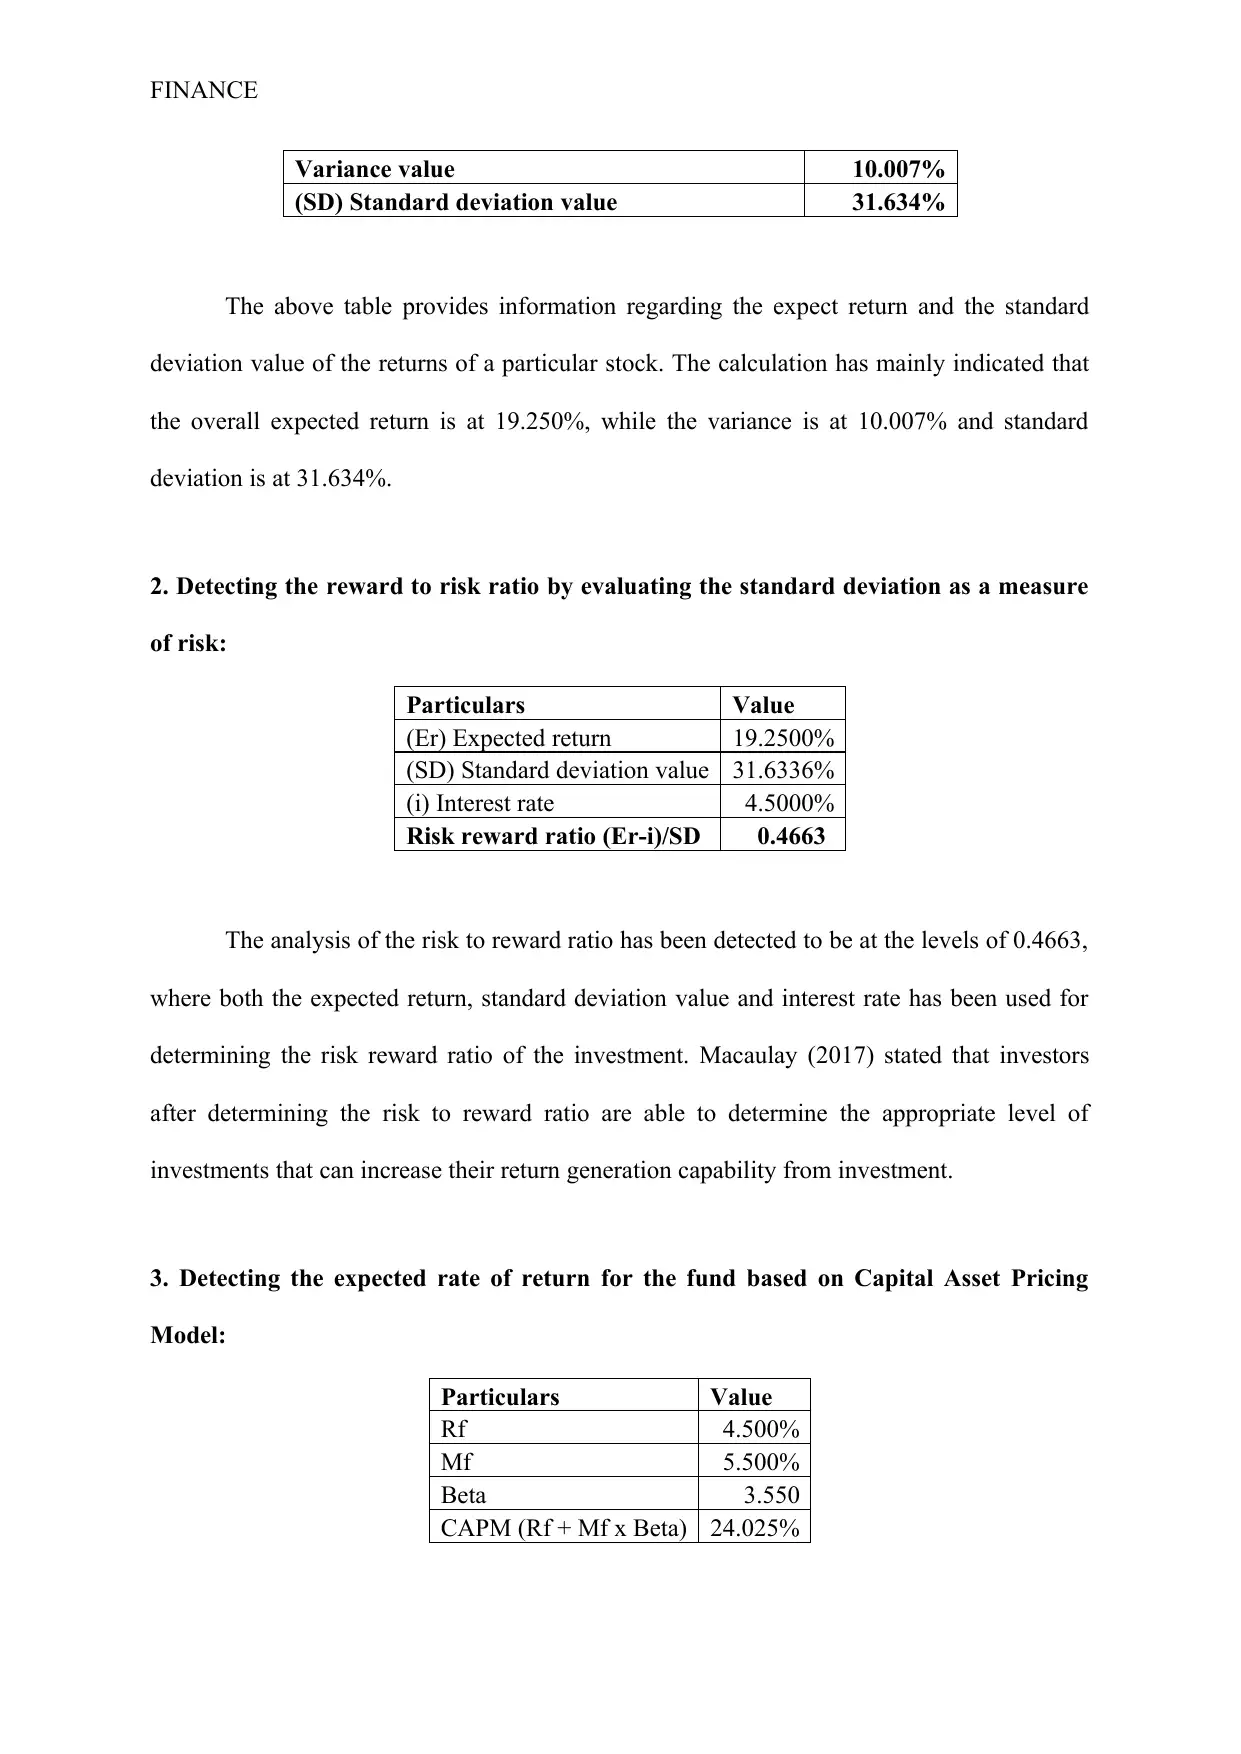
Variance value 10.007%
(SD) Standard deviation value 31.634%
The above table provides information regarding the expect return and the standard
deviation value of the returns of a particular stock. The calculation has mainly indicated that
the overall expected return is at 19.250%, while the variance is at 10.007% and standard
deviation is at 31.634%.
2. Detecting the reward to risk ratio by evaluating the standard deviation as a measure
of risk:
Particulars Value
(Er) Expected return 19.2500%
(SD) Standard deviation value 31.6336%
(i) Interest rate 4.5000%
Risk reward ratio (Er-i)/SD 0.4663
The analysis of the risk to reward ratio has been detected to be at the levels of 0.4663,
where both the expected return, standard deviation value and interest rate has been used for
determining the risk reward ratio of the investment. Macaulay (2017) stated that investors
after determining the risk to reward ratio are able to determine the appropriate level of
investments that can increase their return generation capability from investment.
3. Detecting the expected rate of return for the fund based on Capital Asset Pricing
Model:
Particulars Value
Rf 4.500%
Mf 5.500%
Beta 3.550
CAPM (Rf + Mf x Beta) 24.025%
Secure Best Marks with AI Grader
Need help grading? Try our AI Grader for instant feedback on your assignments.
FINANCE
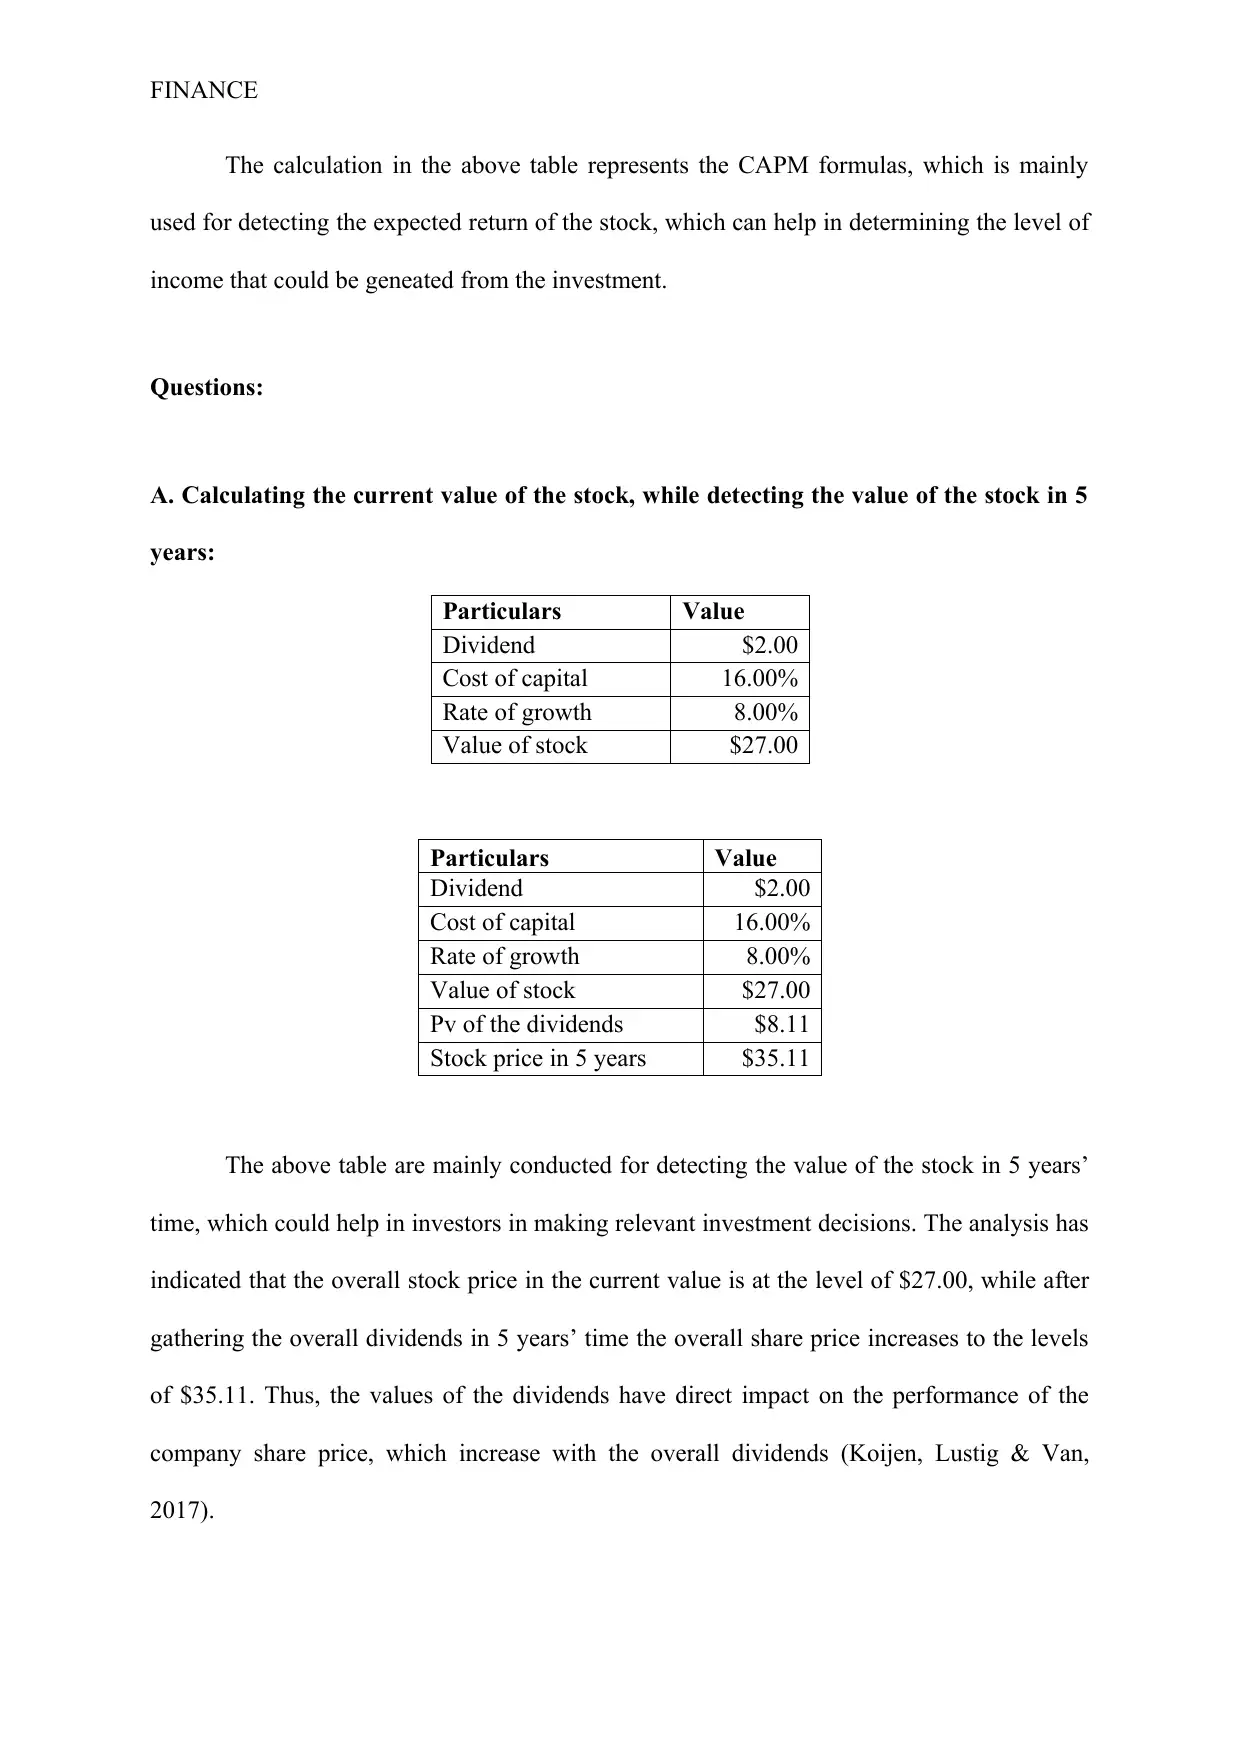
The calculation in the above table represents the CAPM formulas, which is mainly
used for detecting the expected return of the stock, which can help in determining the level of
income that could be geneated from the investment.
Questions:
A. Calculating the current value of the stock, while detecting the value of the stock in 5
years:
Particulars Value
Dividend $2.00
Cost of capital 16.00%
Rate of growth 8.00%
Value of stock $27.00
Particulars Value
Dividend $2.00
Cost of capital 16.00%
Rate of growth 8.00%
Value of stock $27.00
Pv of the dividends $8.11
Stock price in 5 years $35.11
The above table are mainly conducted for detecting the value of the stock in 5 years’
time, which could help in investors in making relevant investment decisions. The analysis has
indicated that the overall stock price in the current value is at the level of $27.00, while after
gathering the overall dividends in 5 years’ time the overall share price increases to the levels
of $35.11. Thus, the values of the dividends have direct impact on the performance of the
company share price, which increase with the overall dividends (Koijen, Lustig & Van,
2017).
FINANCE
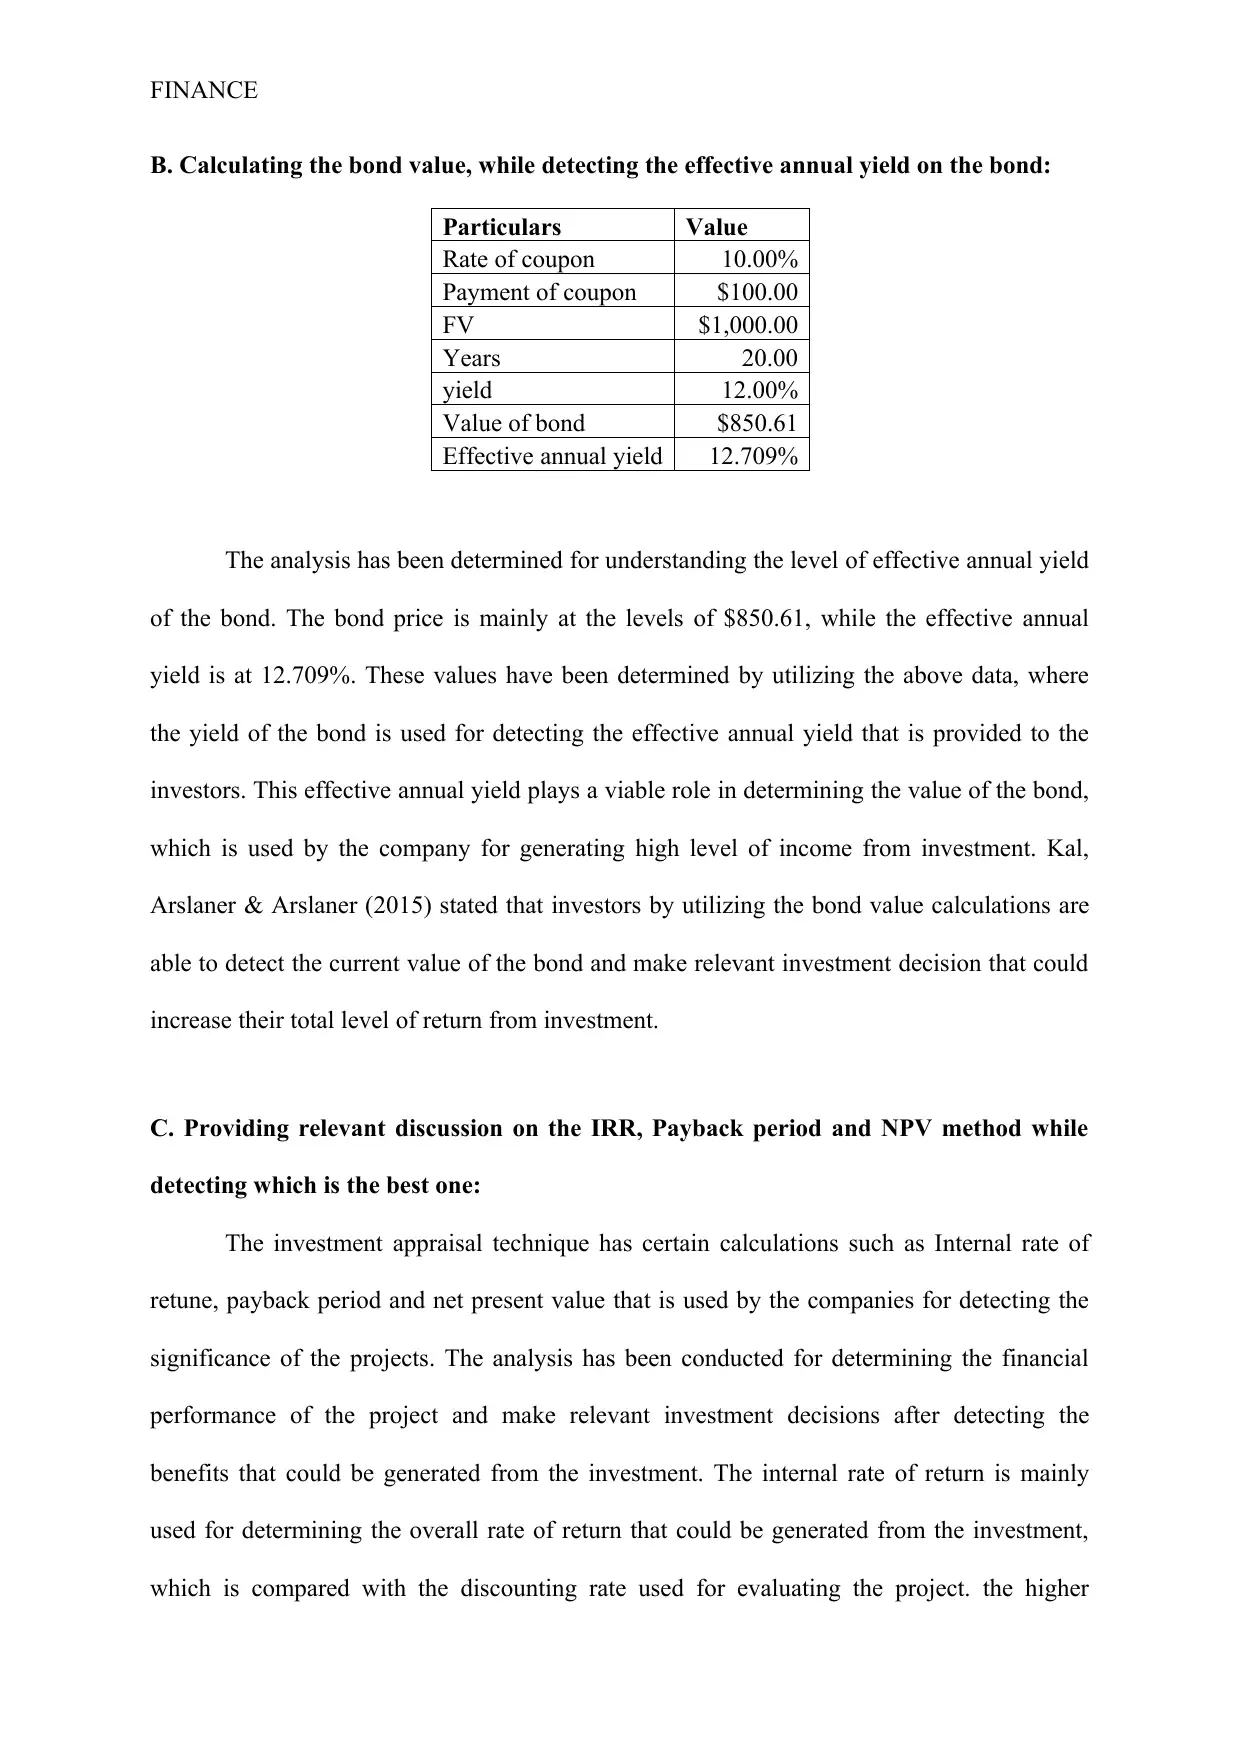
B. Calculating the bond value, while detecting the effective annual yield on the bond:
Particulars Value
Rate of coupon 10.00%
Payment of coupon $100.00
FV $1,000.00
Years 20.00
yield 12.00%
Value of bond $850.61
Effective annual yield 12.709%
The analysis has been determined for understanding the level of effective annual yield
of the bond. The bond price is mainly at the levels of $850.61, while the effective annual
yield is at 12.709%. These values have been determined by utilizing the above data, where
the yield of the bond is used for detecting the effective annual yield that is provided to the
investors. This effective annual yield plays a viable role in determining the value of the bond,
which is used by the company for generating high level of income from investment. Kal,
Arslaner & Arslaner (2015) stated that investors by utilizing the bond value calculations are
able to detect the current value of the bond and make relevant investment decision that could
increase their total level of return from investment.
C. Providing relevant discussion on the IRR, Payback period and NPV method while
detecting which is the best one:
The investment appraisal technique has certain calculations such as Internal rate of
retune, payback period and net present value that is used by the companies for detecting the
significance of the projects. The analysis has been conducted for determining the financial
performance of the project and make relevant investment decisions after detecting the
benefits that could be generated from the investment. The internal rate of return is mainly
used for determining the overall rate of return that could be generated from the investment,
which is compared with the discounting rate used for evaluating the project. the higher
FINANCE
Internal rate of return indicates that the company will generate more benefits from the
investment in the project. However, there are limitation to this investment appraisal
technique, which mainly use the company for detecting the level of income over the period of
time (Baum & Crosby, 2014).
However, the calculation of payback period has both limitations and significance,
which can be used by the companies for understanding the implication of the project. Thus,
the information of the payback period value will mainly allow the company to detect the
overall time by which the initial investment will be returned to the cash flow. This
information is mainly essential in determining whether the income of the company is higher
than the initial investments. Therefore, the company could benefit immensely from the
investment and might be able to generate high level of income in the process. However, the
major limitation of the payback period is that it does not account for the discounting rate and
time value of money, which analysis the cash inflows of the projects. In addition, the
calculation does not evaluate the cash flows after receiving the initial investment (Harris,
2017).
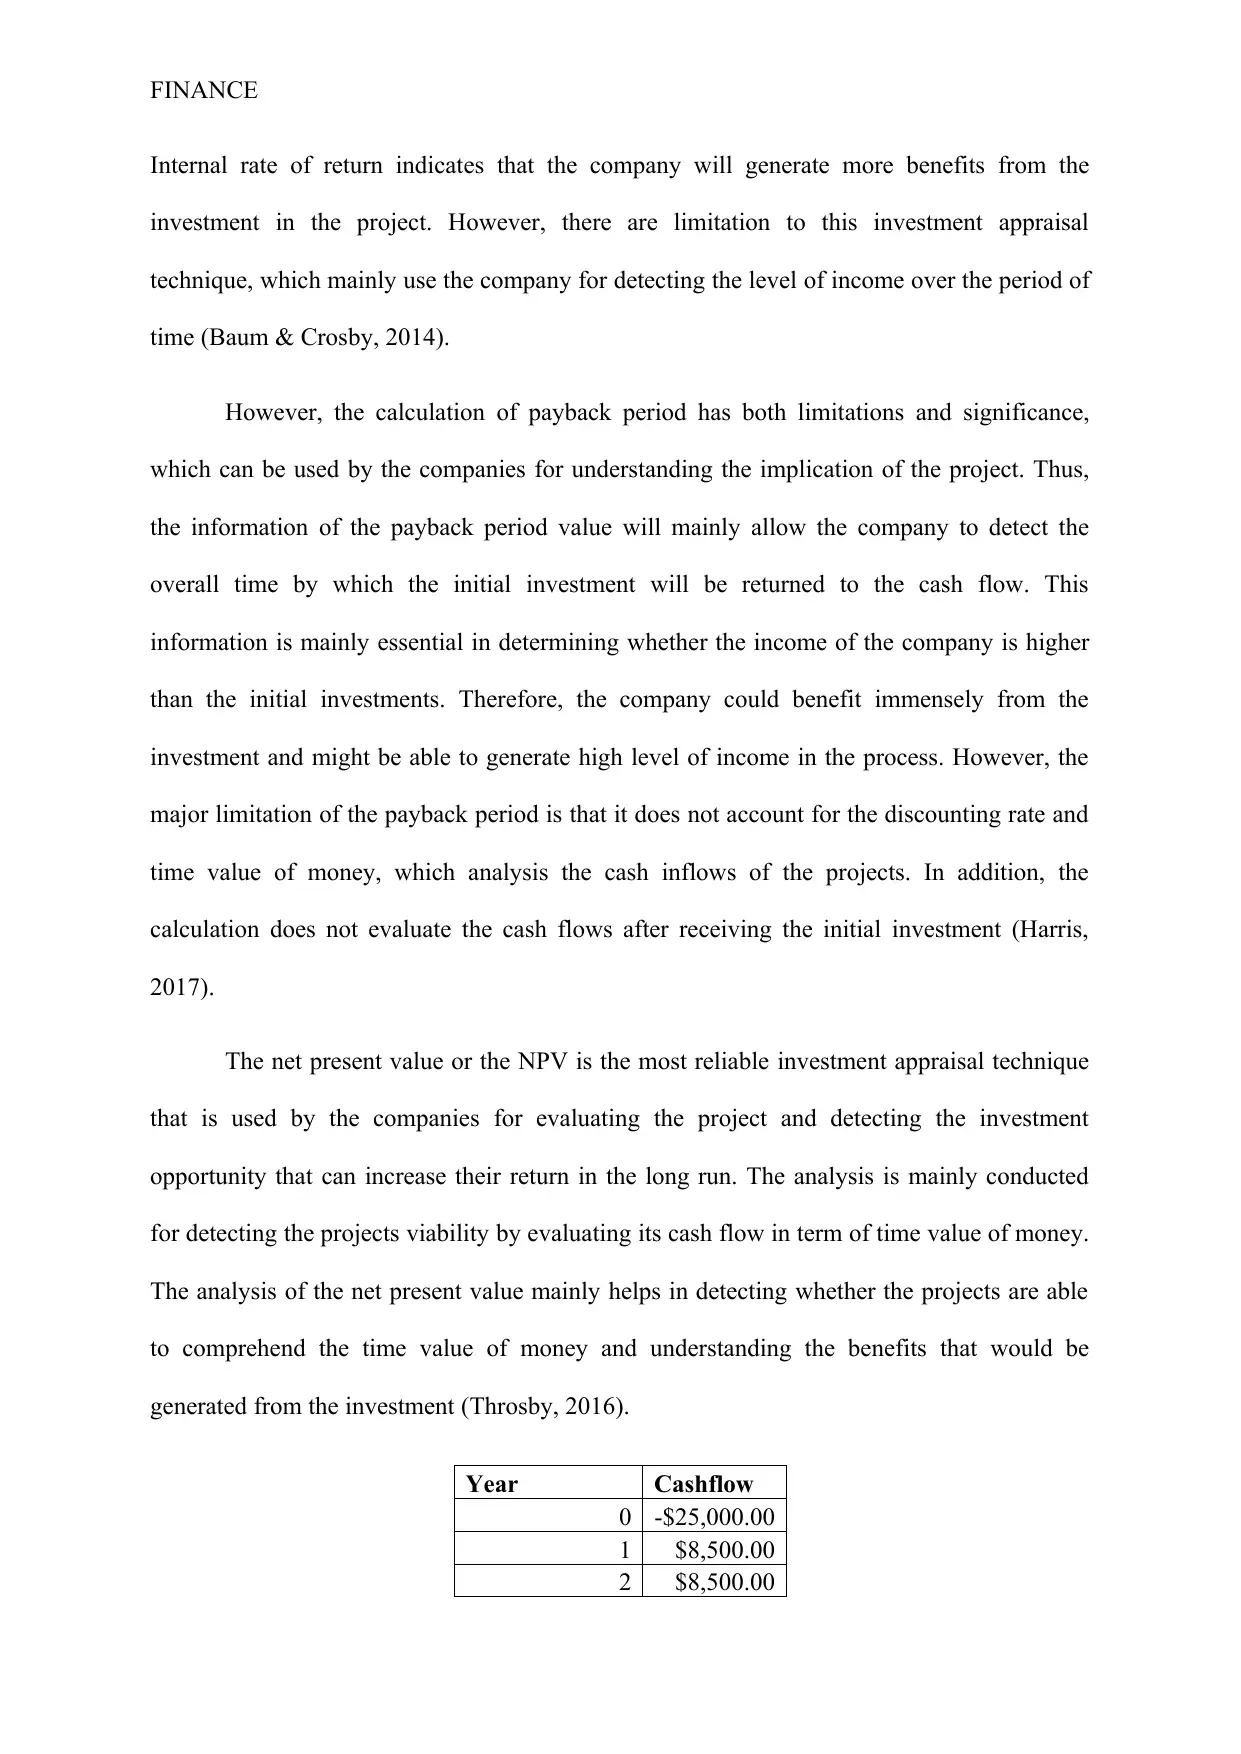
The net present value or the NPV is the most reliable investment appraisal technique
that is used by the companies for evaluating the project and detecting the investment
opportunity that can increase their return in the long run. The analysis is mainly conducted
for detecting the projects viability by evaluating its cash flow in term of time value of money.
The analysis of the net present value mainly helps in detecting whether the projects are able
to comprehend the time value of money and understanding the benefits that would be
generated from the investment (Throsby, 2016).
Year Cashflow
0 -$25,000.00
1 $8,500.00
2 $8,500.00
Internal rate of return indicates that the company will generate more benefits from the
investment in the project. However, there are limitation to this investment appraisal
technique, which mainly use the company for detecting the level of income over the period of
time (Baum & Crosby, 2014).
However, the calculation of payback period has both limitations and significance,
which can be used by the companies for understanding the implication of the project. Thus,
the information of the payback period value will mainly allow the company to detect the
overall time by which the initial investment will be returned to the cash flow. This
information is mainly essential in determining whether the income of the company is higher
than the initial investments. Therefore, the company could benefit immensely from the
investment and might be able to generate high level of income in the process. However, the
major limitation of the payback period is that it does not account for the discounting rate and
time value of money, which analysis the cash inflows of the projects. In addition, the
calculation does not evaluate the cash flows after receiving the initial investment (Harris,
2017).
The net present value or the NPV is the most reliable investment appraisal technique
that is used by the companies for evaluating the project and detecting the investment
opportunity that can increase their return in the long run. The analysis is mainly conducted
for detecting the projects viability by evaluating its cash flow in term of time value of money.
The analysis of the net present value mainly helps in detecting whether the projects are able
to comprehend the time value of money and understanding the benefits that would be
generated from the investment (Throsby, 2016).
Year Cashflow
0 -$25,000.00
1 $8,500.00
2 $8,500.00
Paraphrase This Document
Need a fresh take? Get an instant paraphrase of this document with our AI Paraphraser
FINANCE
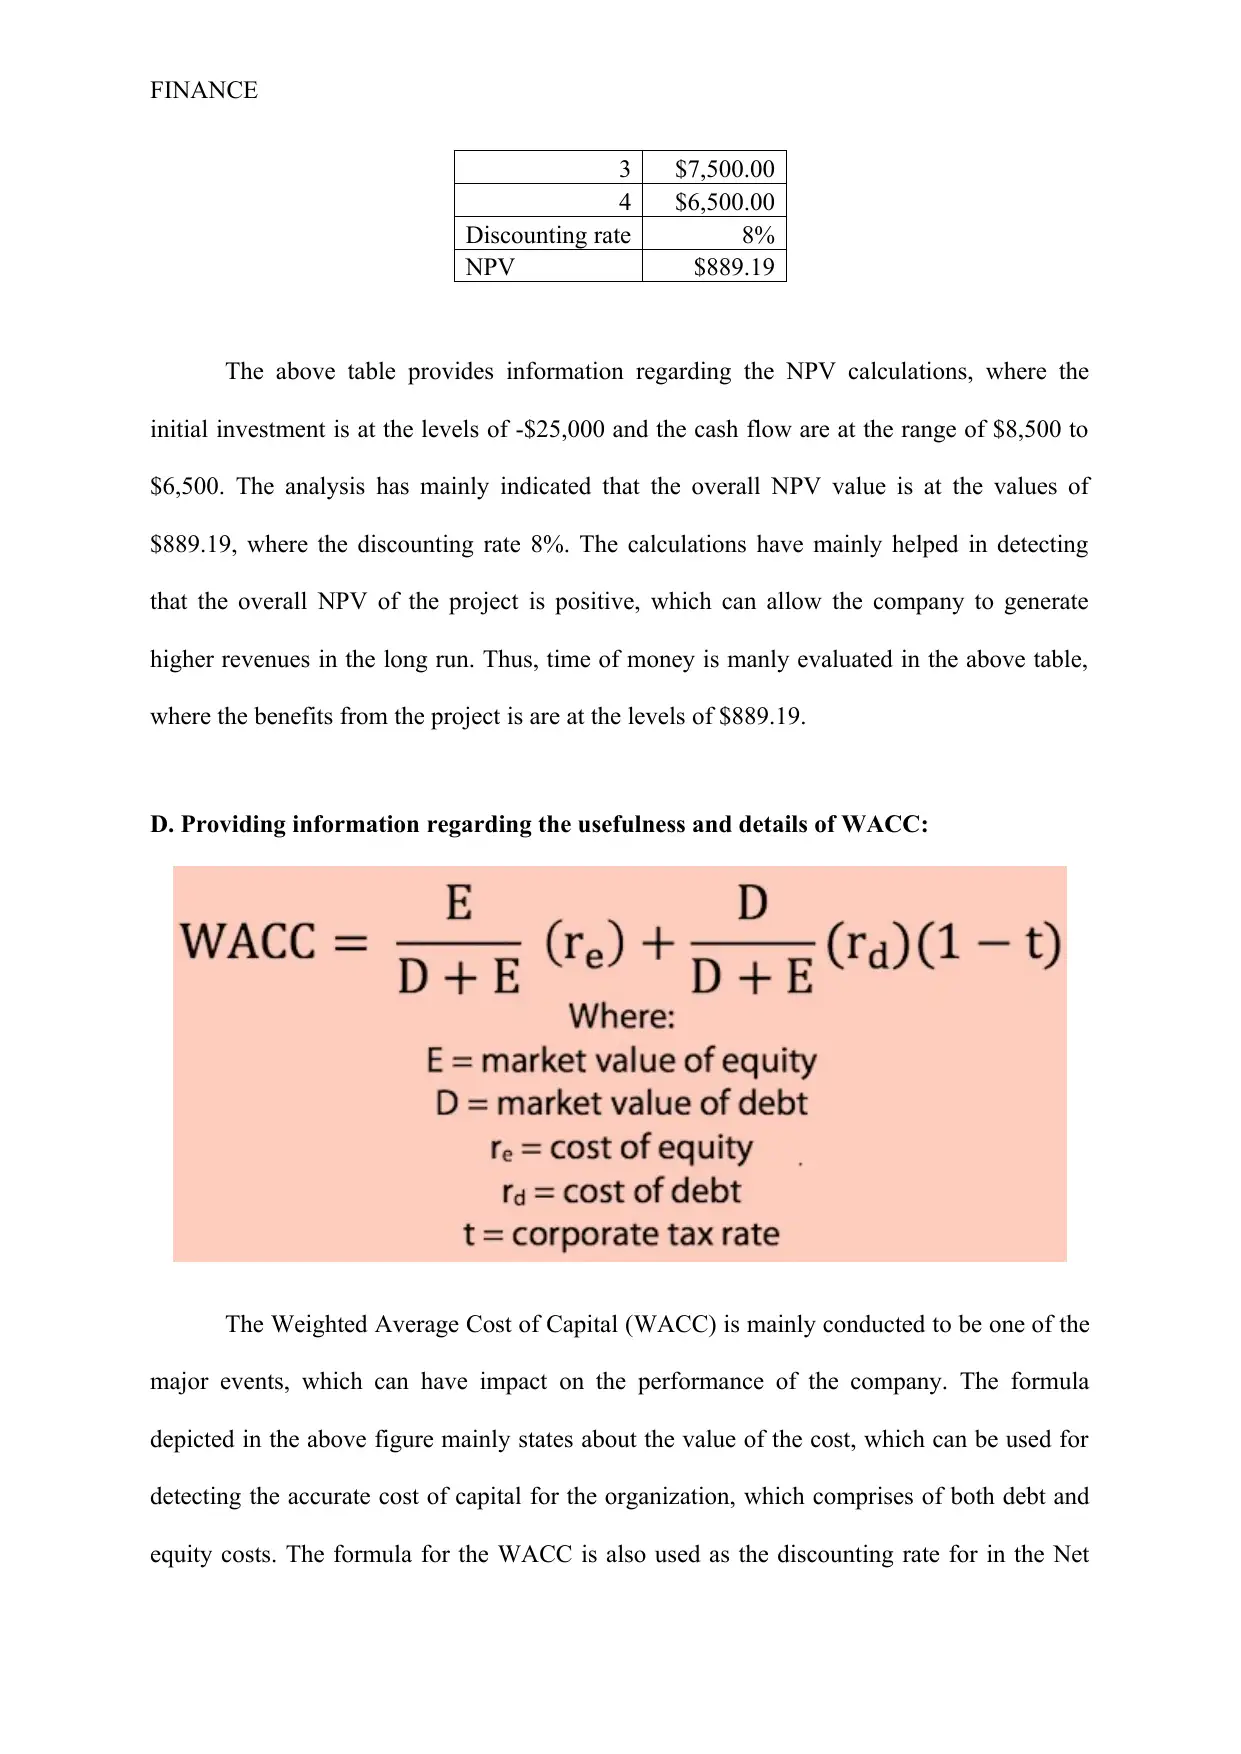
3 $7,500.00
4 $6,500.00
Discounting rate 8%
NPV $889.19
The above table provides information regarding the NPV calculations, where the
initial investment is at the levels of -$25,000 and the cash flow are at the range of $8,500 to
$6,500. The analysis has mainly indicated that the overall NPV value is at the values of
$889.19, where the discounting rate 8%. The calculations have mainly helped in detecting
that the overall NPV of the project is positive, which can allow the company to generate
higher revenues in the long run. Thus, time of money is manly evaluated in the above table,
where the benefits from the project is are at the levels of $889.19.
D. Providing information regarding the usefulness and details of WACC:
The Weighted Average Cost of Capital (WACC) is mainly conducted to be one of the
major events, which can have impact on the performance of the company. The formula
depicted in the above figure mainly states about the value of the cost, which can be used for
detecting the accurate cost of capital for the organization, which comprises of both debt and
equity costs. The formula for the WACC is also used as the discounting rate for in the Net
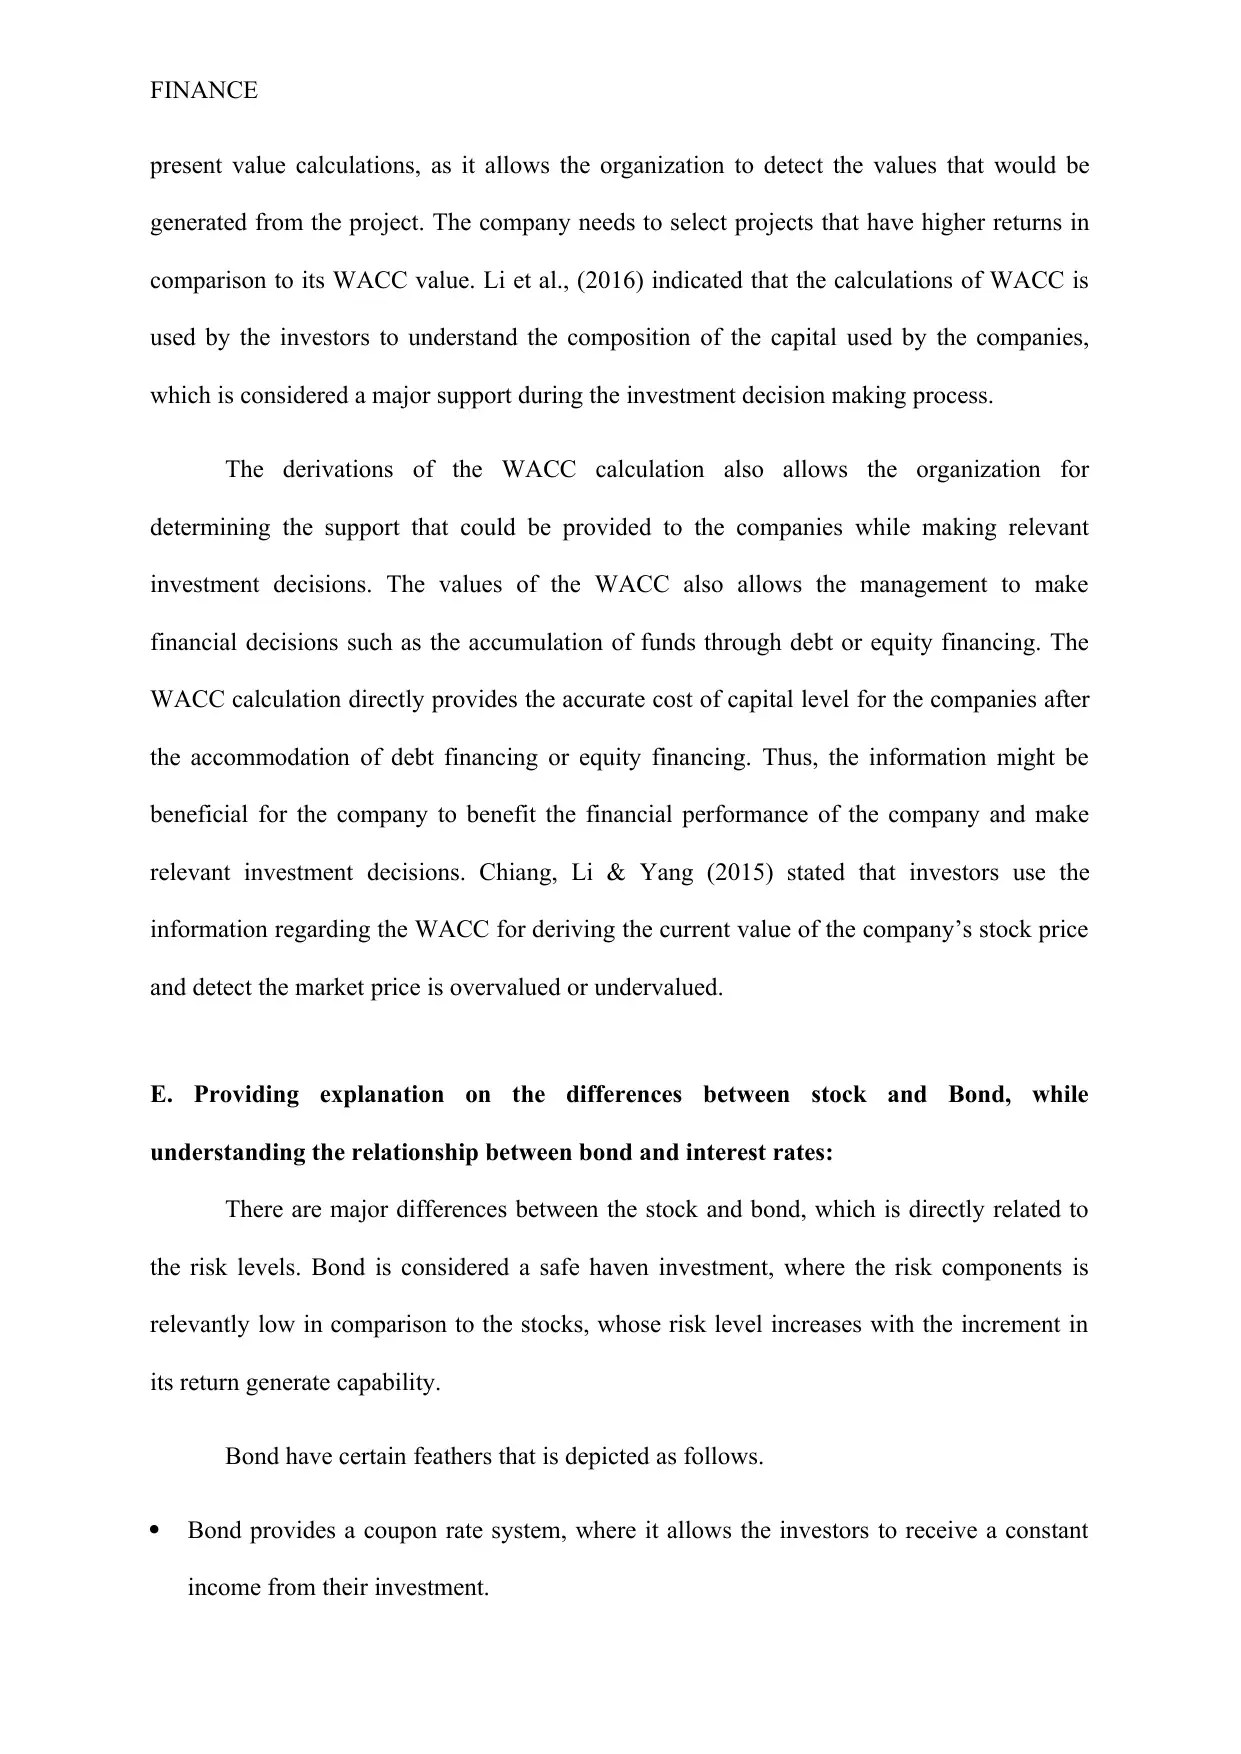
FINANCE
present value calculations, as it allows the organization to detect the values that would be
generated from the project. The company needs to select projects that have higher returns in
comparison to its WACC value. Li et al., (2016) indicated that the calculations of WACC is
used by the investors to understand the composition of the capital used by the companies,
which is considered a major support during the investment decision making process.
The derivations of the WACC calculation also allows the organization for
determining the support that could be provided to the companies while making relevant
investment decisions. The values of the WACC also allows the management to make
financial decisions such as the accumulation of funds through debt or equity financing. The
WACC calculation directly provides the accurate cost of capital level for the companies after
the accommodation of debt financing or equity financing. Thus, the information might be
beneficial for the company to benefit the financial performance of the company and make
relevant investment decisions. Chiang, Li & Yang (2015) stated that investors use the
information regarding the WACC for deriving the current value of the company’s stock price
and detect the market price is overvalued or undervalued.
E. Providing explanation on the differences between stock and Bond, while
understanding the relationship between bond and interest rates:
There are major differences between the stock and bond, which is directly related to
the risk levels. Bond is considered a safe haven investment, where the risk components is
relevantly low in comparison to the stocks, whose risk level increases with the increment in
its return generate capability.
Bond have certain feathers that is depicted as follows.
Bond provides a coupon rate system, where it allows the investors to receive a constant
income from their investment.
FINANCE
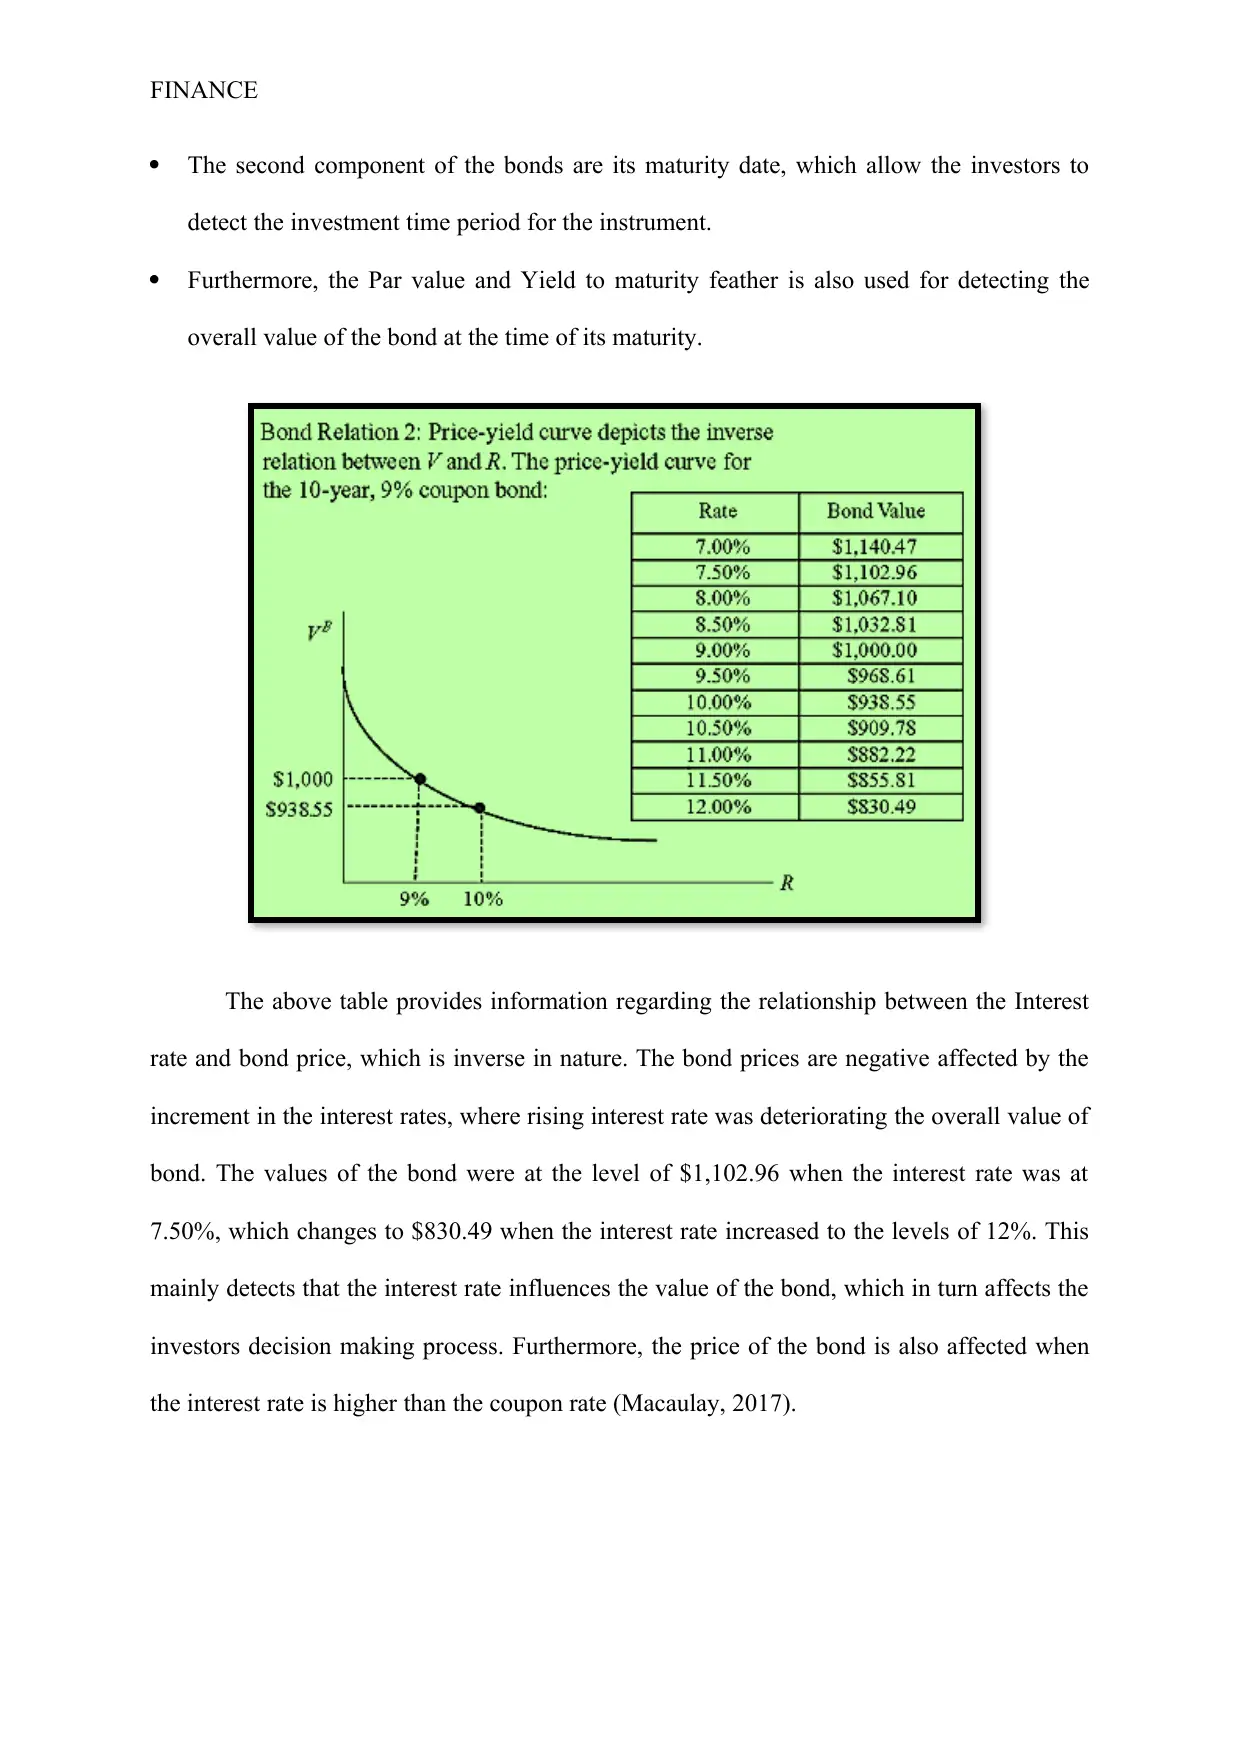
The second component of the bonds are its maturity date, which allow the investors to
detect the investment time period for the instrument.
Furthermore, the Par value and Yield to maturity feather is also used for detecting the
overall value of the bond at the time of its maturity.
The above table provides information regarding the relationship between the Interest
rate and bond price, which is inverse in nature. The bond prices are negative affected by the
increment in the interest rates, where rising interest rate was deteriorating the overall value of
bond. The values of the bond were at the level of $1,102.96 when the interest rate was at
7.50%, which changes to $830.49 when the interest rate increased to the levels of 12%. This
mainly detects that the interest rate influences the value of the bond, which in turn affects the
investors decision making process. Furthermore, the price of the bond is also affected when
the interest rate is higher than the coupon rate (Macaulay, 2017).
Secure Best Marks with AI Grader
Need help grading? Try our AI Grader for instant feedback on your assignments.
FINANCE
Conclusion:
The assessment has mainly conducted relevant calculations for the min case, where
values of the expected return and standard deviation has been calculated. This has mainly
helped in detecting the risk to reward ratio, which is used by the investors to gather the
highest level of income from investment. Further calculations have been depicted on the
valuation of the stock, which is derived for the company providing relevant dividends. In
addition, the price of the stock after 5 years has los been derived by utilizing the relevant
information for its dividends and growth rate. The significance of the net present value
calculations has been depicted, which is considered to be better in comparison to other
investment appraisal techniques such as payback period and internal rate of return. The
derivation of the relationship between the bond and interest rate is also depicted, as increment
in interest rate decreases the value of bond and vice versa.
FINANCE
References and Bibliography:
Abdel-Kader, M. G., Dugdale, D., & Taylor, P. (2018). Investment decisions in advanced
manufacturing technology: A fuzzy set theory approach. Routledge.
Abdel-Kader, M. G., Dugdale, D., & Taylor, P. (2018). Investment decisions in advanced
manufacturing technology: A fuzzy set theory approach. Routledge.
Al-Mutairi, A., Naser, K., & Saeid, M. (2018). Capital budgeting practices by non-financial
companies listed on Kuwait Stock Exchange (KSE). Cogent Economics &
Finance, 6(1), 1468232.
Baum, A. E., & Crosby, N. (2014). Property investment appraisal. John Wiley & Sons.
Cenedese, G., & Mallucci, E. (2016). What moves international stock and bond
markets?. Journal of International Money and Finance, 60, 94-113.
Chiang, T. C., Li, J., & Yang, S. Y. (2015). Dynamic stock–bond return correlations and
financial market uncertainty. Review of Quantitative Finance and Accounting, 45(1),
59-88.
Dimic, N., Kiviaho, J., Piljak, V., & Äijö, J. (2016). Impact of financial market uncertainty
and macroeconomic factors on stock–bond correlation in emerging markets. Research
in International Business and Finance, 36, 41-51.
Harris, E. (2017). Strategic project risk appraisal and management. Routledge.
Jammazi, R., Tiwari, A. K., Ferrer, R., & Moya, P. (2015). Time-varying dependence
between stock and government bond returns: International evidence with dynamic
copulas. The North American Journal of Economics and Finance, 33, 74-93.
FINANCE
Kal, S. H., Arslaner, F., & Arslaner, N. (2015). The dynamic relationship between stock,
bond and foreign exchange markets. Economic Systems, 39(4), 592-607.
Koijen, R. S., Lustig, H., & Van Nieuwerburgh, S. (2017). The cross-section and time series
of stock and bond returns. Journal of Monetary Economics, 88, 50-69.
Li, M., Zheng, H., Chong, T. T. L., & Zhang, Y. (2016). The stock–bond comovements and
cross-market trading. Journal of Economic Dynamics and Control, 73, 417-438.
Macaulay, F. R. (2017). From ‘Some Theoretical Problems Suggested by the Movements of
Interest Rates, Bond Yield, and Stock Prices in the United States Since 1856’.
In Bond Duration and Immunization (pp. 33-43). Routledge.
Penning-Rowsell, E., Priest, S., Parker, D., Morris, J., Tunstall, S., Viavattene, C., ... &
Owen, D. (2014). Flood and coastal erosion risk management: a manual for
economic appraisal. Routledge.
Schlegel, D., Frank, F., & Britzelmaier, B. (2016). Investment decisions and capital
budgeting practices in German manufacturing companies. International Journal of
Business and Globalisation, 16(1), 66-78.
Throsby, D. (2016). Investment in urban heritage conservation in developing countries:
Concepts, methods and data. City, Culture and Society, 7(2), 81-86.
1 out of 13
Related Documents


Your All-in-One AI-Powered Toolkit for Academic Success.
+13062052269
info@desklib.com
Available 24*7 on WhatsApp / Email
![[object Object]](/_next/static/media/star-bottom.7253800d.svg)
Unlock your academic potential
© 2024 | Zucol Services PVT LTD | All rights reserved.