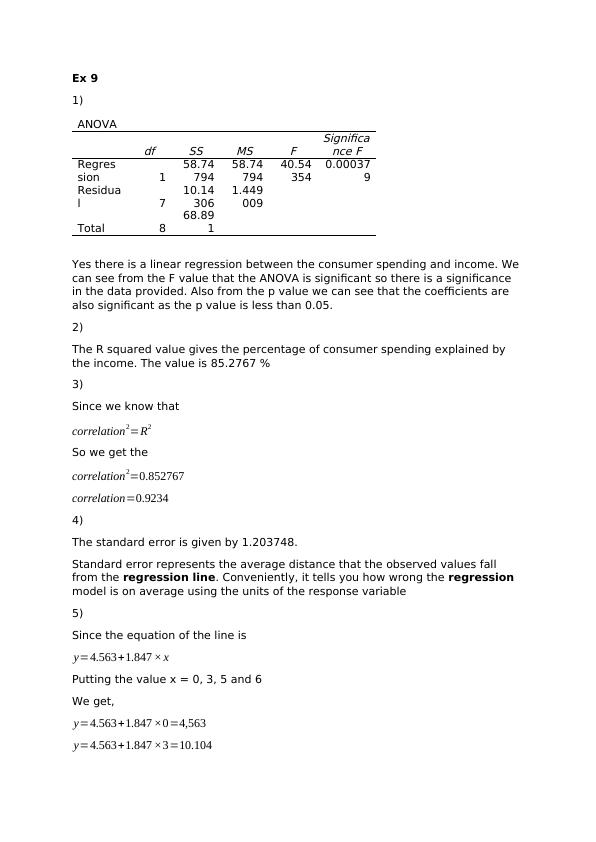
Ex 9 1) ANOVA. df Regres sion Residua l. 1 7. Total. 8.
3 Pages477 Words85 Views
Added on 2022-12-21
Ex 9 1) ANOVA. df Regres sion Residua l. 1 7. Total. 8.
Added on 2022-12-21
ShareRelated Documents
End of preview
Want to access all the pages? Upload your documents or become a member.
Correlation Analysis in Business Analytics
|5
|893
|85
Data Analysis for Desklib Online Library
|6
|725
|444
Understanding Regression Terminology and Simple/Multiple Linear Regression
|6
|796
|151
Regression Analysis in Statistics
|11
|1898
|65
Regression Analysis | Statistics Assignment
|7
|843
|25
BUS 207: Assignment 6 a) The independent variable for this data
|2
|458
|88