UKCBC ICT Assignment: Business Income Data Analysis with Excel

Verified

Added on  2023/06/12

|10
|696
|180
Practical Assignment
AI Summary
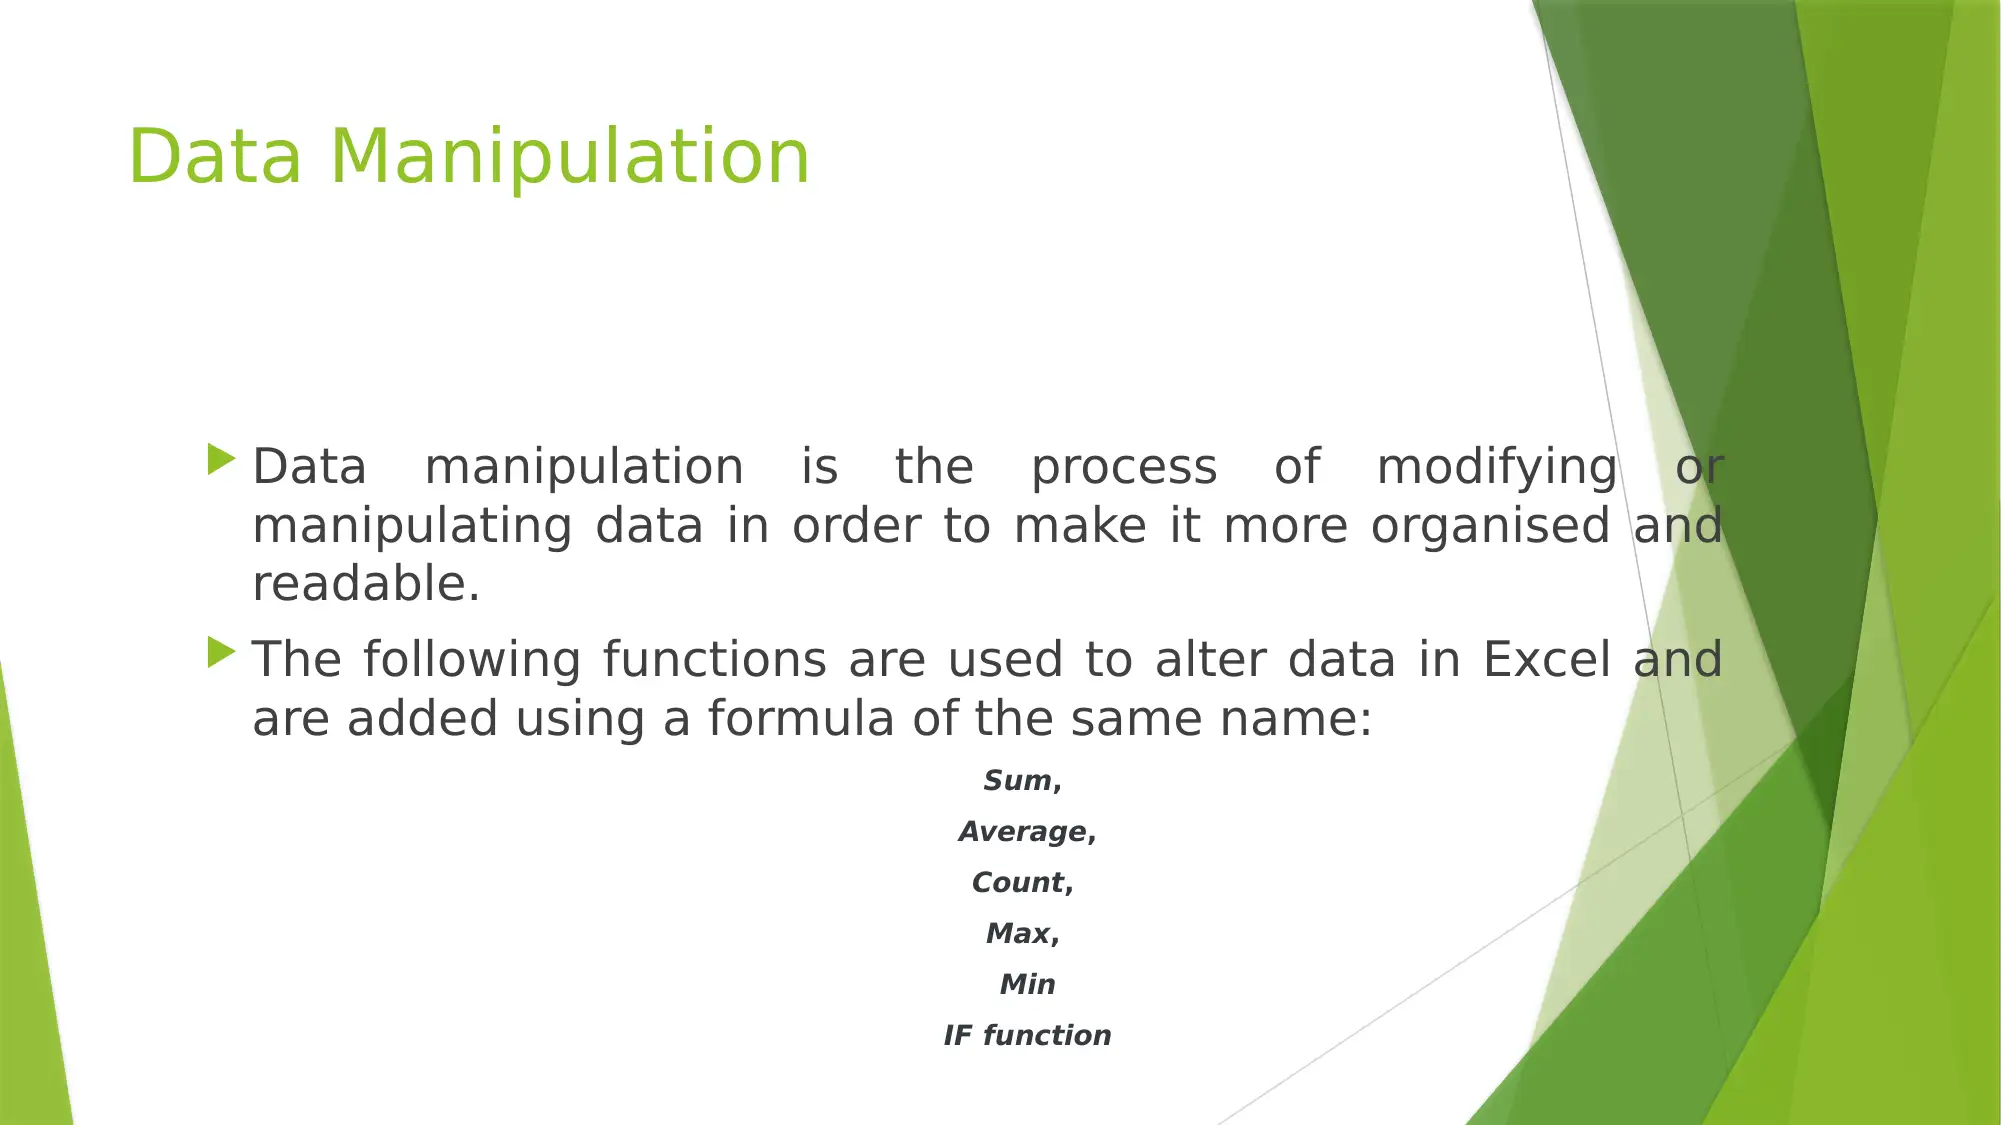
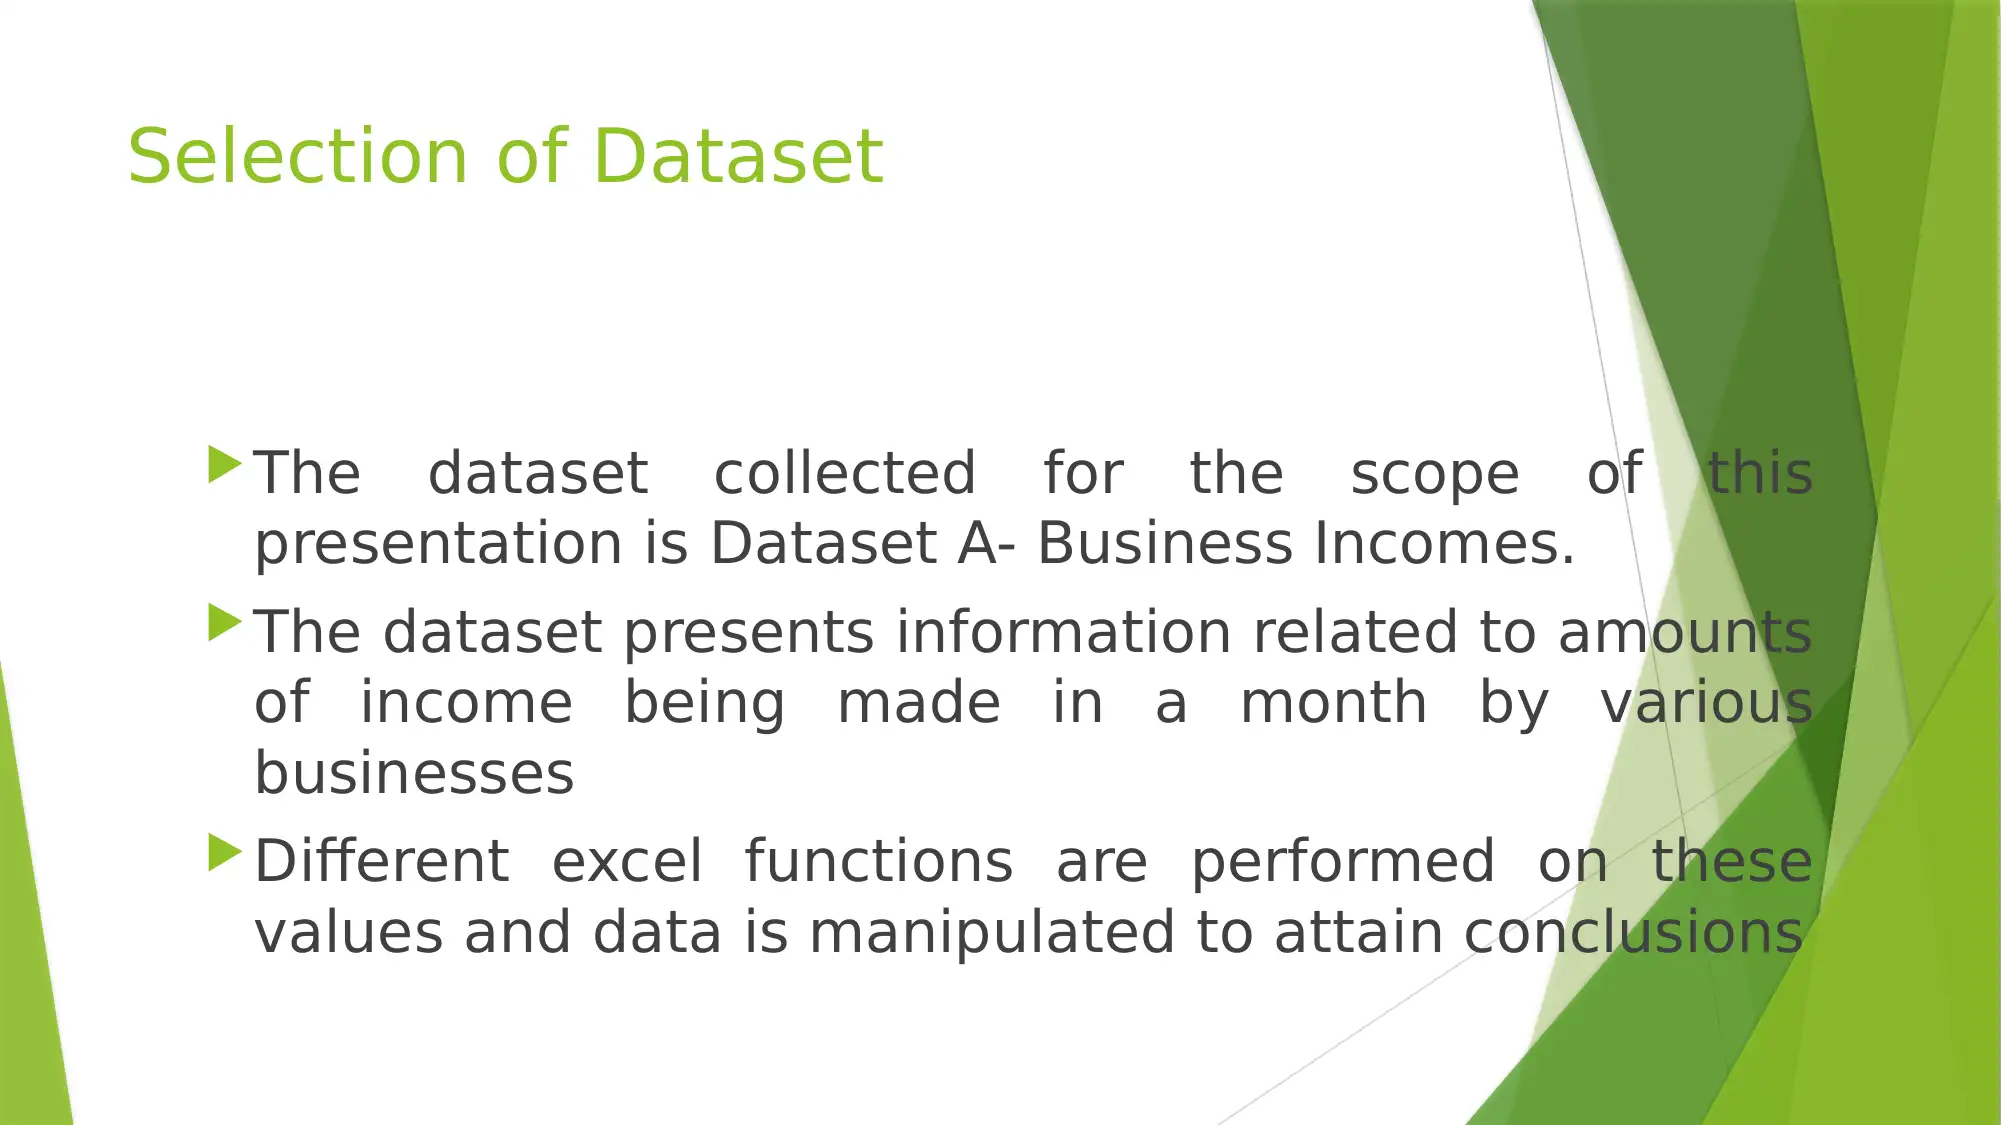
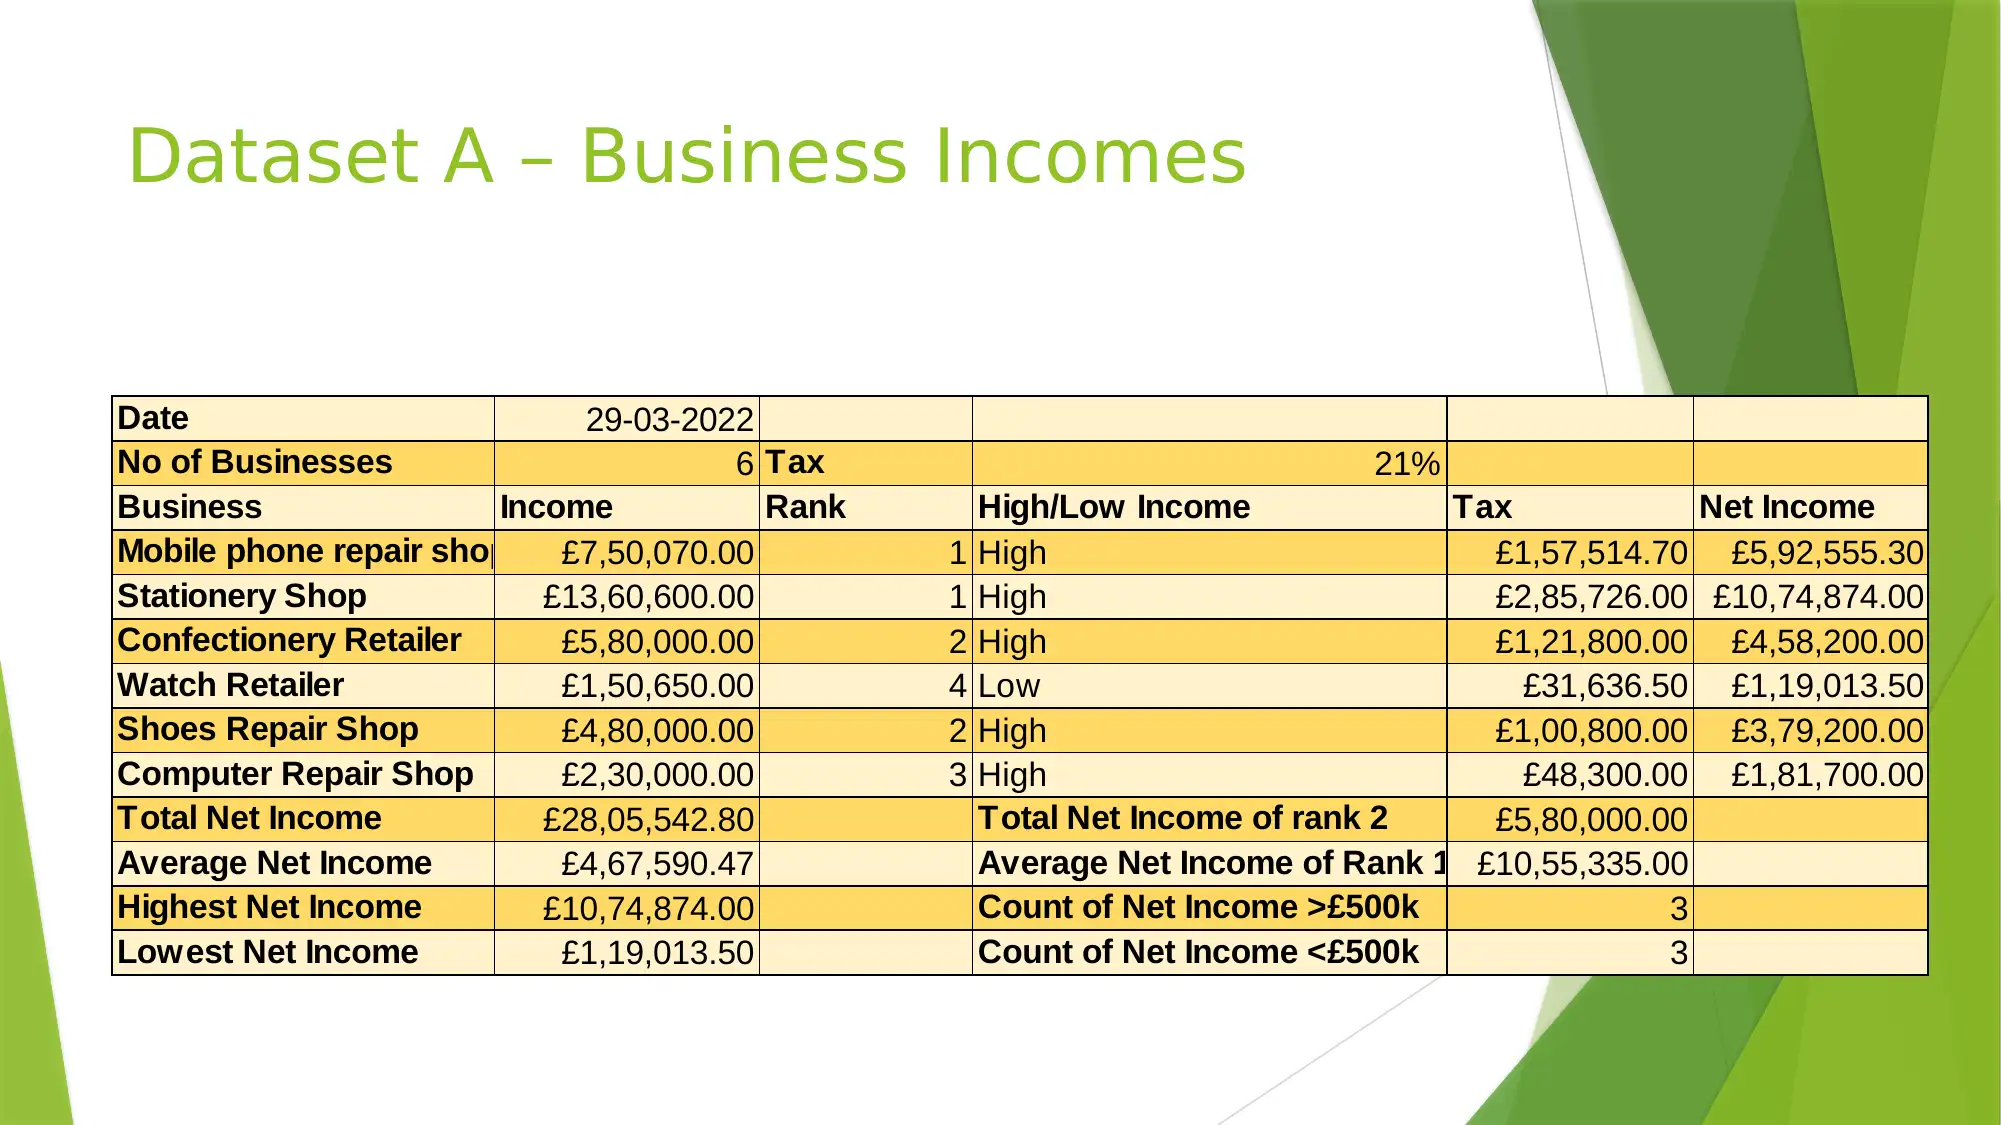
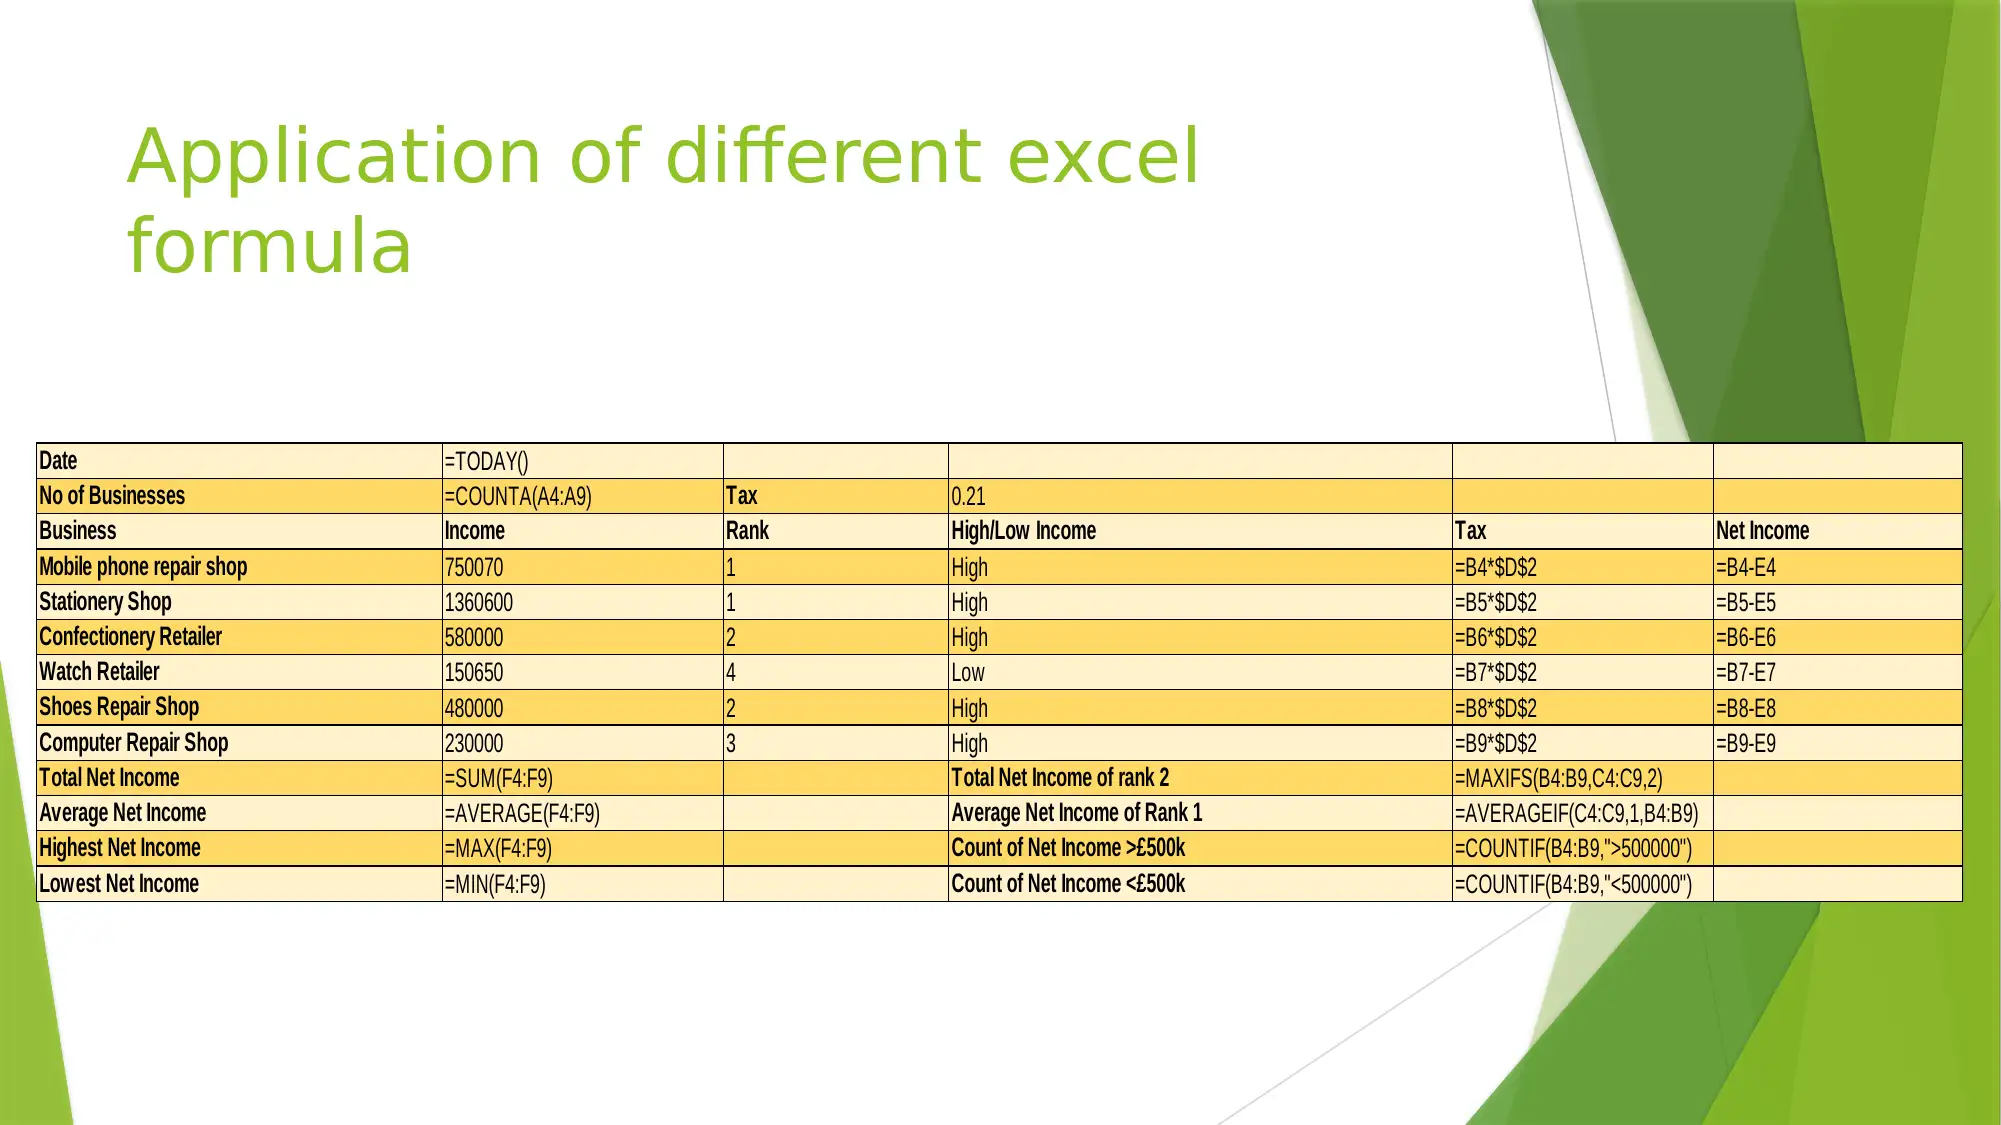
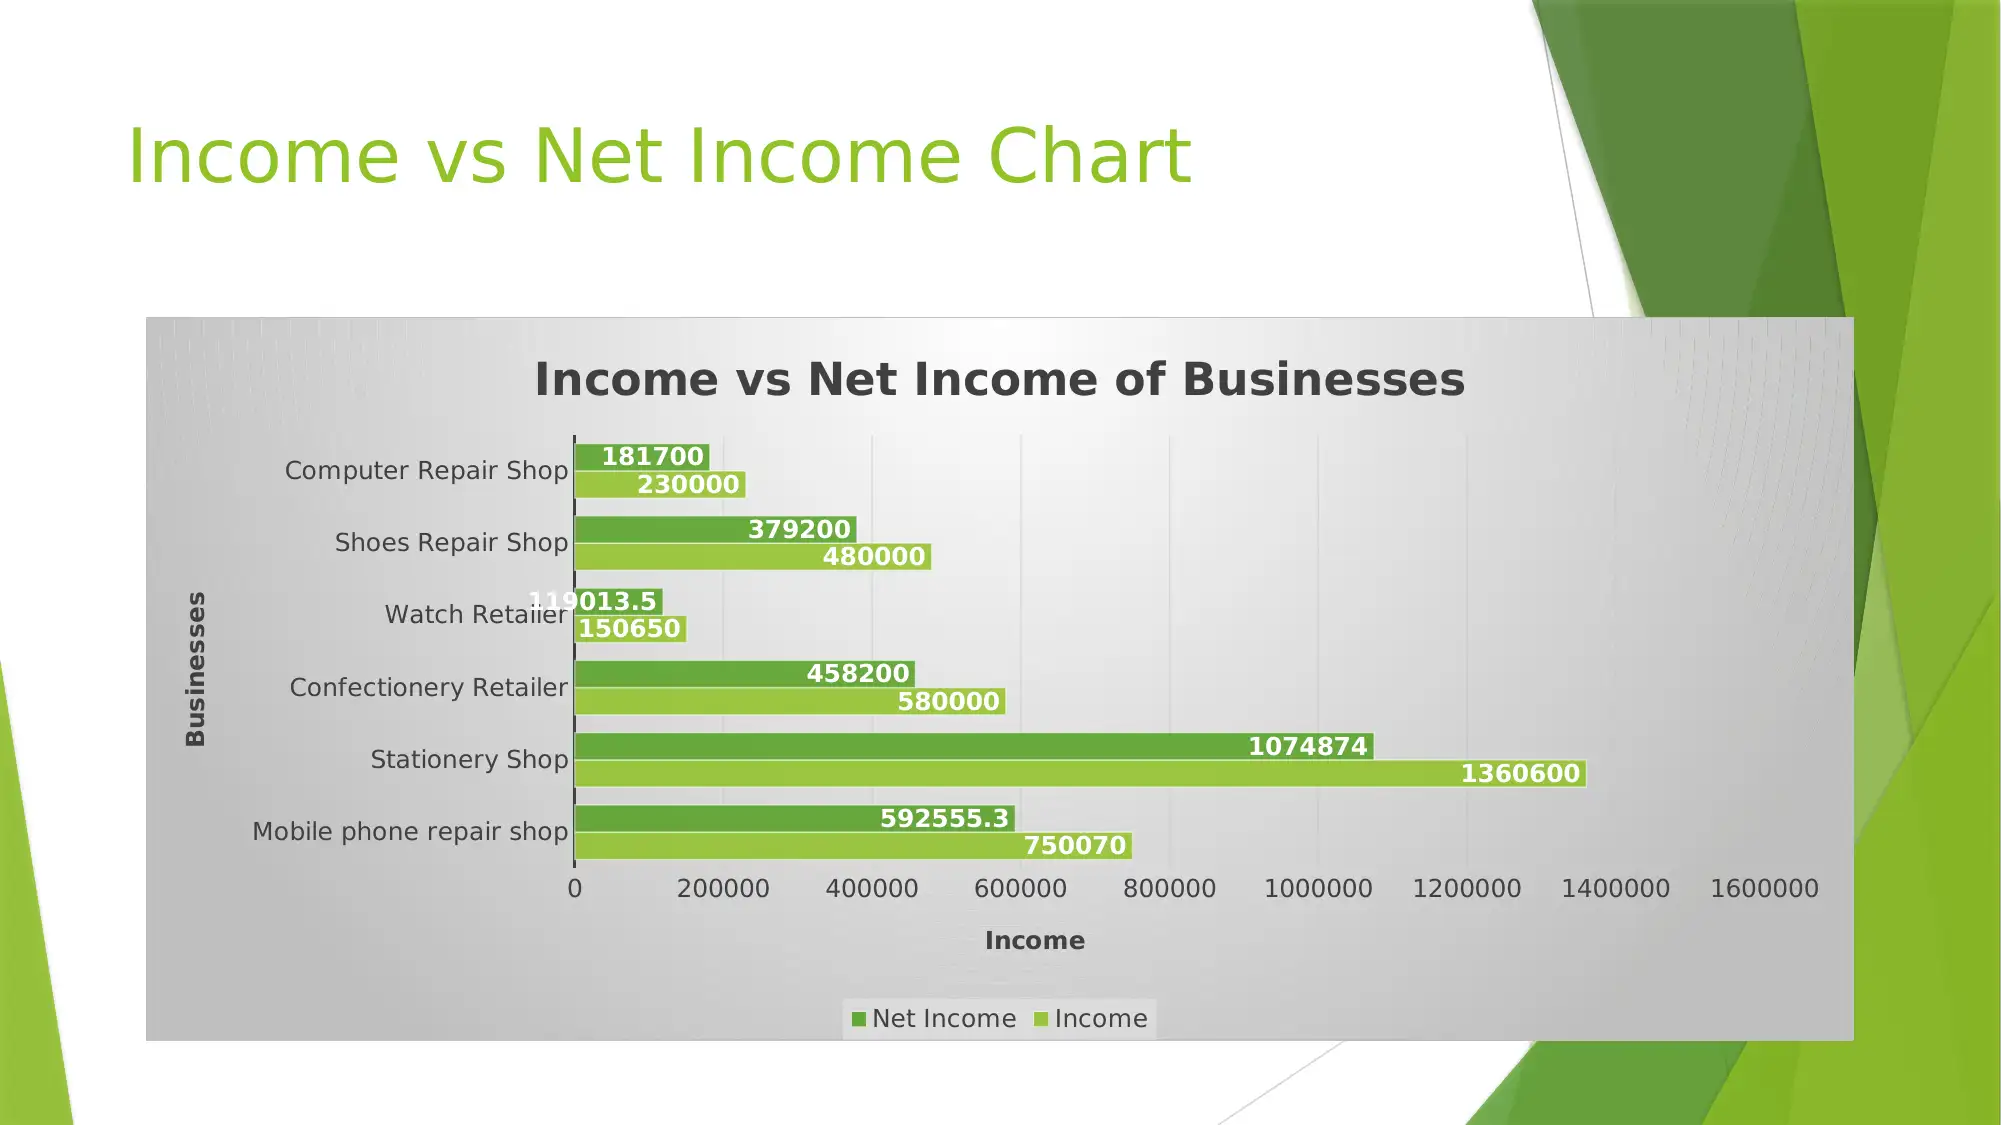
This practical assignment focuses on utilizing Microsoft Excel for data manipulation and analysis within the context of Information Communication Technology (ICT). The assignment uses a dataset ('Dataset A – Business Incomes') containing monthly income data from various businesses. Different Excel formulas such as SUM, AVERAGE, COUNT, MAX, MIN, and IF functions are applied to manipulate the data and derive meaningful insights. The analysis includes calculating total and average net incomes, identifying the highest and lowest net incomes, and categorizing businesses based on income ranks. A chart visualizing the relationship between income and net income is generated to enhance data interpretation. The assignment concludes that Excel is a valuable tool for analyzing datasets and presenting information in a clear and understandable format, which is crucial in ICT.
Document Page
Information
Communication
Technology
tabler-icon-diamond-filled.svg

Paraphrase This Document

Need a fresh take? Get an instant paraphrase of this document with our AI Paraphraser
Document Page
CONTENTS
INTRODUCTION
Data Manipulation
Selection of Dataset
Dataset A – Business Incomes
Application of different excel formula
Income vs Net Income Chart
Interpretation
CONCLUSION
Document Page
INTRODUCTION
The set of technologies that have been developed to
manage and transfer information from one location
to another. They deal with a wide range of issues.
They include information storage and retrieval
technologies. Additionally, you may send and
receive data from one site to another. Alternately,
process data to calculate results and generate
reports.
Document Page
Data Manipulation
Data manipulation is the process of modifying or
manipulating data in order to make it more organised and
readable.
The following functions are used to alter data in Excel and
are added using a formula of the same name:
Sum,
Average,
Count,
Max,
Min
IF function
tabler-icon-diamond-filled.svg

Paraphrase This Document

Need a fresh take? Get an instant paraphrase of this document with our AI Paraphraser
Document Page
Selection of Dataset
The dataset collected for the scope of this
presentation is Dataset A- Business Incomes.
The dataset presents information related to amounts
of income being made in a month by various
businesses
Different excel functions are performed on these
values and data is manipulated to attain conclusions
Document Page
Dataset A – Business Incomes
Date 29-03-2022
No of Businesses 6 Tax 21%
Business Income Rank High/Low Income Tax Net Income
Mobile phone repair shop £7,50,070.00 1 High £1,57,514.70 £5,92,555.30
Stationery Shop £13,60,600.00 1 High £2,85,726.00 £10,74,874.00
Confectionery Retailer £5,80,000.00 2 High £1,21,800.00 £4,58,200.00
Watch Retailer £1,50,650.00 4 Low £31,636.50 £1,19,013.50
Shoes Repair Shop £4,80,000.00 2 High £1,00,800.00 £3,79,200.00
Computer Repair Shop £2,30,000.00 3 High £48,300.00 £1,81,700.00
Total Net Income £28,05,542.80 Total Net Income of rank 2 £5,80,000.00
Average Net Income £4,67,590.47 Average Net Income of Rank 1 £10,55,335.00
Highest Net Income £10,74,874.00 Count of Net Income >£500k 3
Lowest Net Income £1,19,013.50 Count of Net Income <£500k 3
Document Page
Application of different excel
formula
Date =TODAY()
No of Businesses =COUNTA(A4:A9) Tax 0.21
Business Income Rank High/Low Income Tax Net Income
Mobile phone repair shop 750070 1 High =B4*$D$2 =B4-E4
Stationery Shop 1360600 1 High =B5*$D$2 =B5-E5
Confectionery Retailer 580000 2 High =B6*$D$2 =B6-E6
Watch Retailer 150650 4 Low =B7*$D$2 =B7-E7
Shoes Repair Shop 480000 2 High =B8*$D$2 =B8-E8
Computer Repair Shop 230000 3 High =B9*$D$2 =B9-E9
Total Net Income =SUM(F4:F9) Total Net Income of rank 2 =MAXIFS(B4:B9,C4:C9,2)
Average Net Income =AVERAGE(F4:F9) Average Net Income of Rank 1 =AVERAGEIF(C4:C9,1,B4:B9)
Highest Net Income =MAX(F4:F9) Count of Net Income >£500k =COUNTIF(B4:B9,">500000")
Lowest Net Income =MIN(F4:F9) Count of Net Income <£500k =COUNTIF(B4:B9,"<500000")
tabler-icon-diamond-filled.svg

Paraphrase This Document

Need a fresh take? Get an instant paraphrase of this document with our AI Paraphraser
Document Page
Income vs Net Income Chart
Mobile phone repair shop
Stationery Shop
Confectionery Retailer
Watch Retailer
Shoes Repair Shop
Computer Repair Shop
0 200000 400000 600000 800000 1000000 1200000 1400000 1600000
750070
1360600
580000
150650
480000
230000
592555.3
1074874
458200
119013.5
379200
181700
Income vs Net Income of Businesses
Net Income Income
Income
Businesses
Document Page
Interpretation
The overall net income of all firms is reported as
2,805,542 according to the above modified dataset
relating to the earnings of different enterprises. The
data set's average income was 467,590 dollars. And
there was only one firm with a revenue of less than
200,000, which was a watch store.
Document Page
CONCLUSION
From the above presentation it can be said that
excel is a great tool to be used in the ICT. It helps
the individuals and the businesses to critically
analyze the data set using the different formula and
functions. The presentation using chart is also a
great technique which presents a data set in better
and more understanding way.
chevron_up_icon
1 out of 10
circle_padding
hide_on_mobile
zoom_out_icon
[object Object]