Practical Assignment: Data Analysis with Excel, Access, and VBA

Verified

Added on  2019/09/16

|3
|938
|287
Practical Assignment
AI Summary
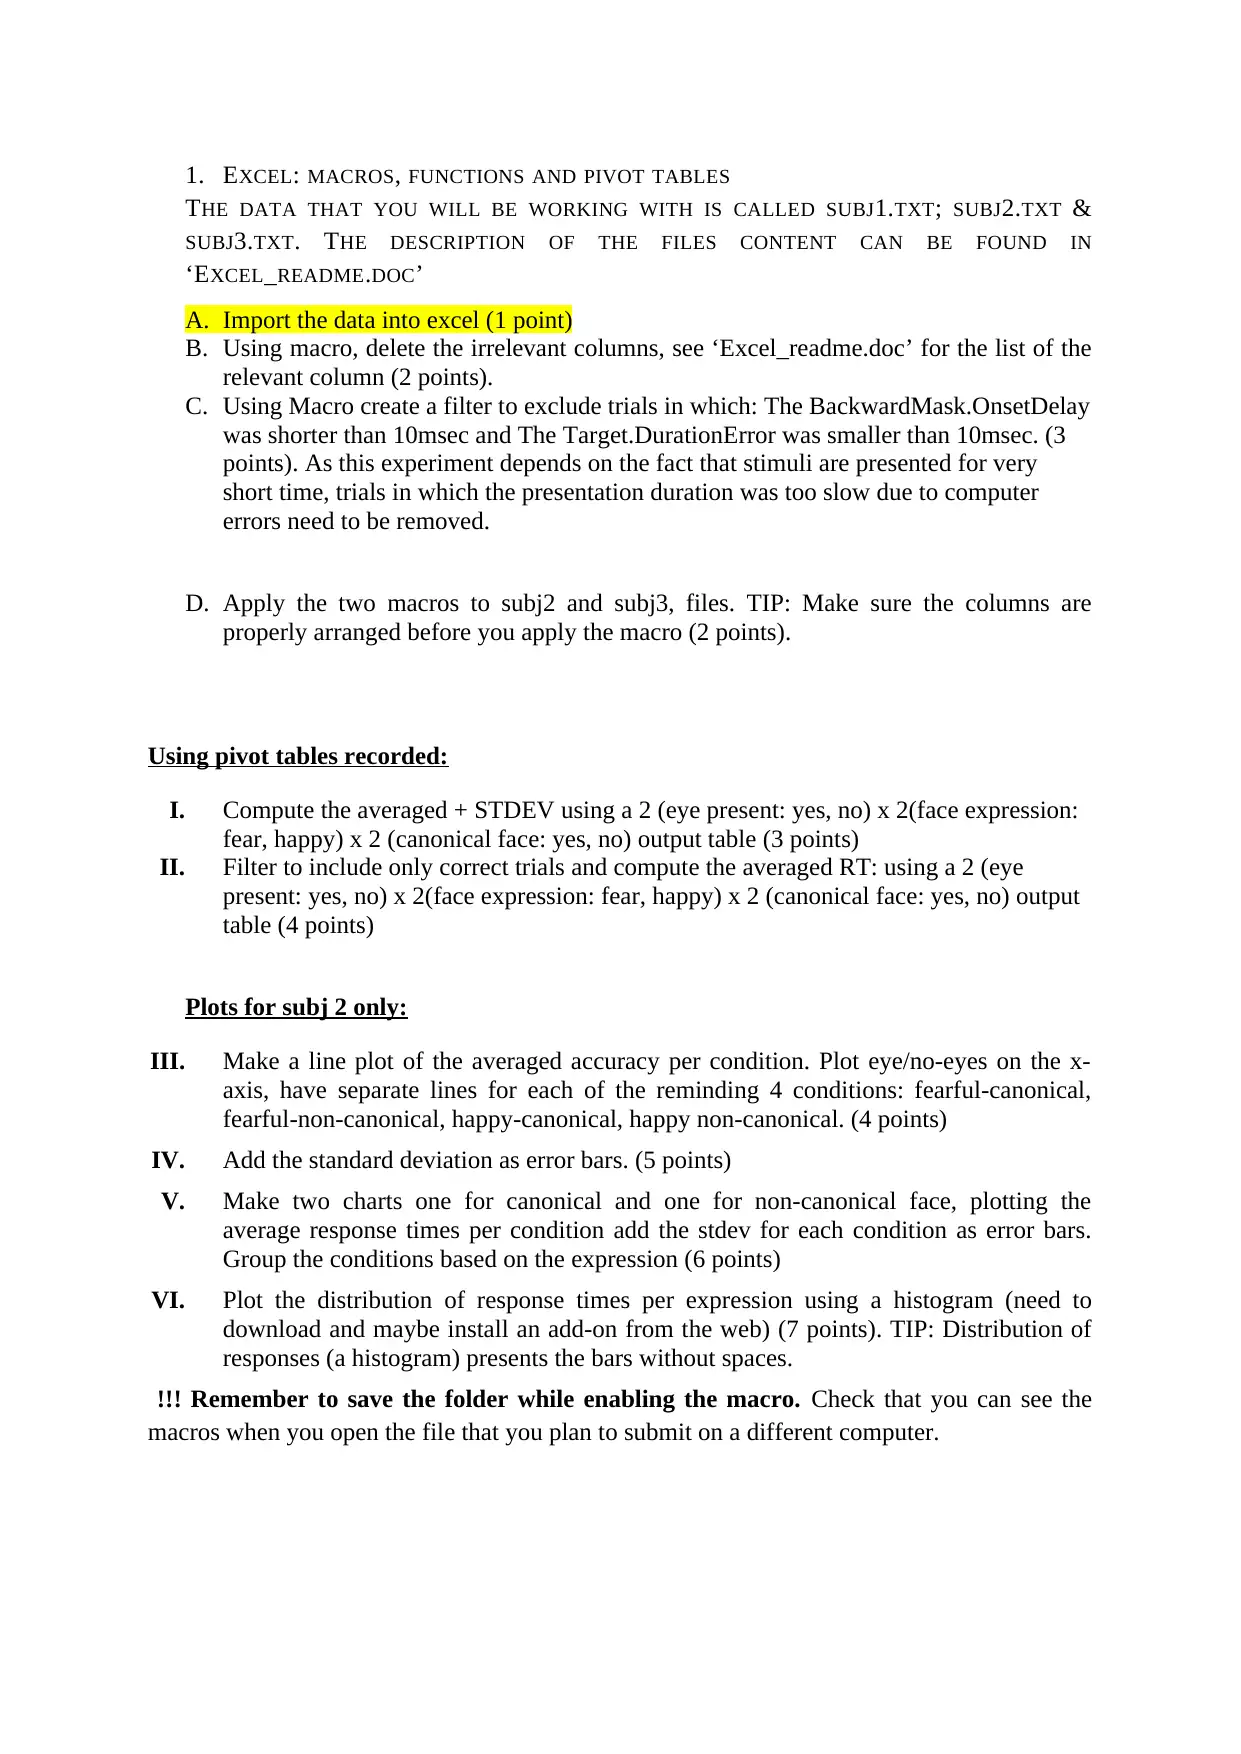
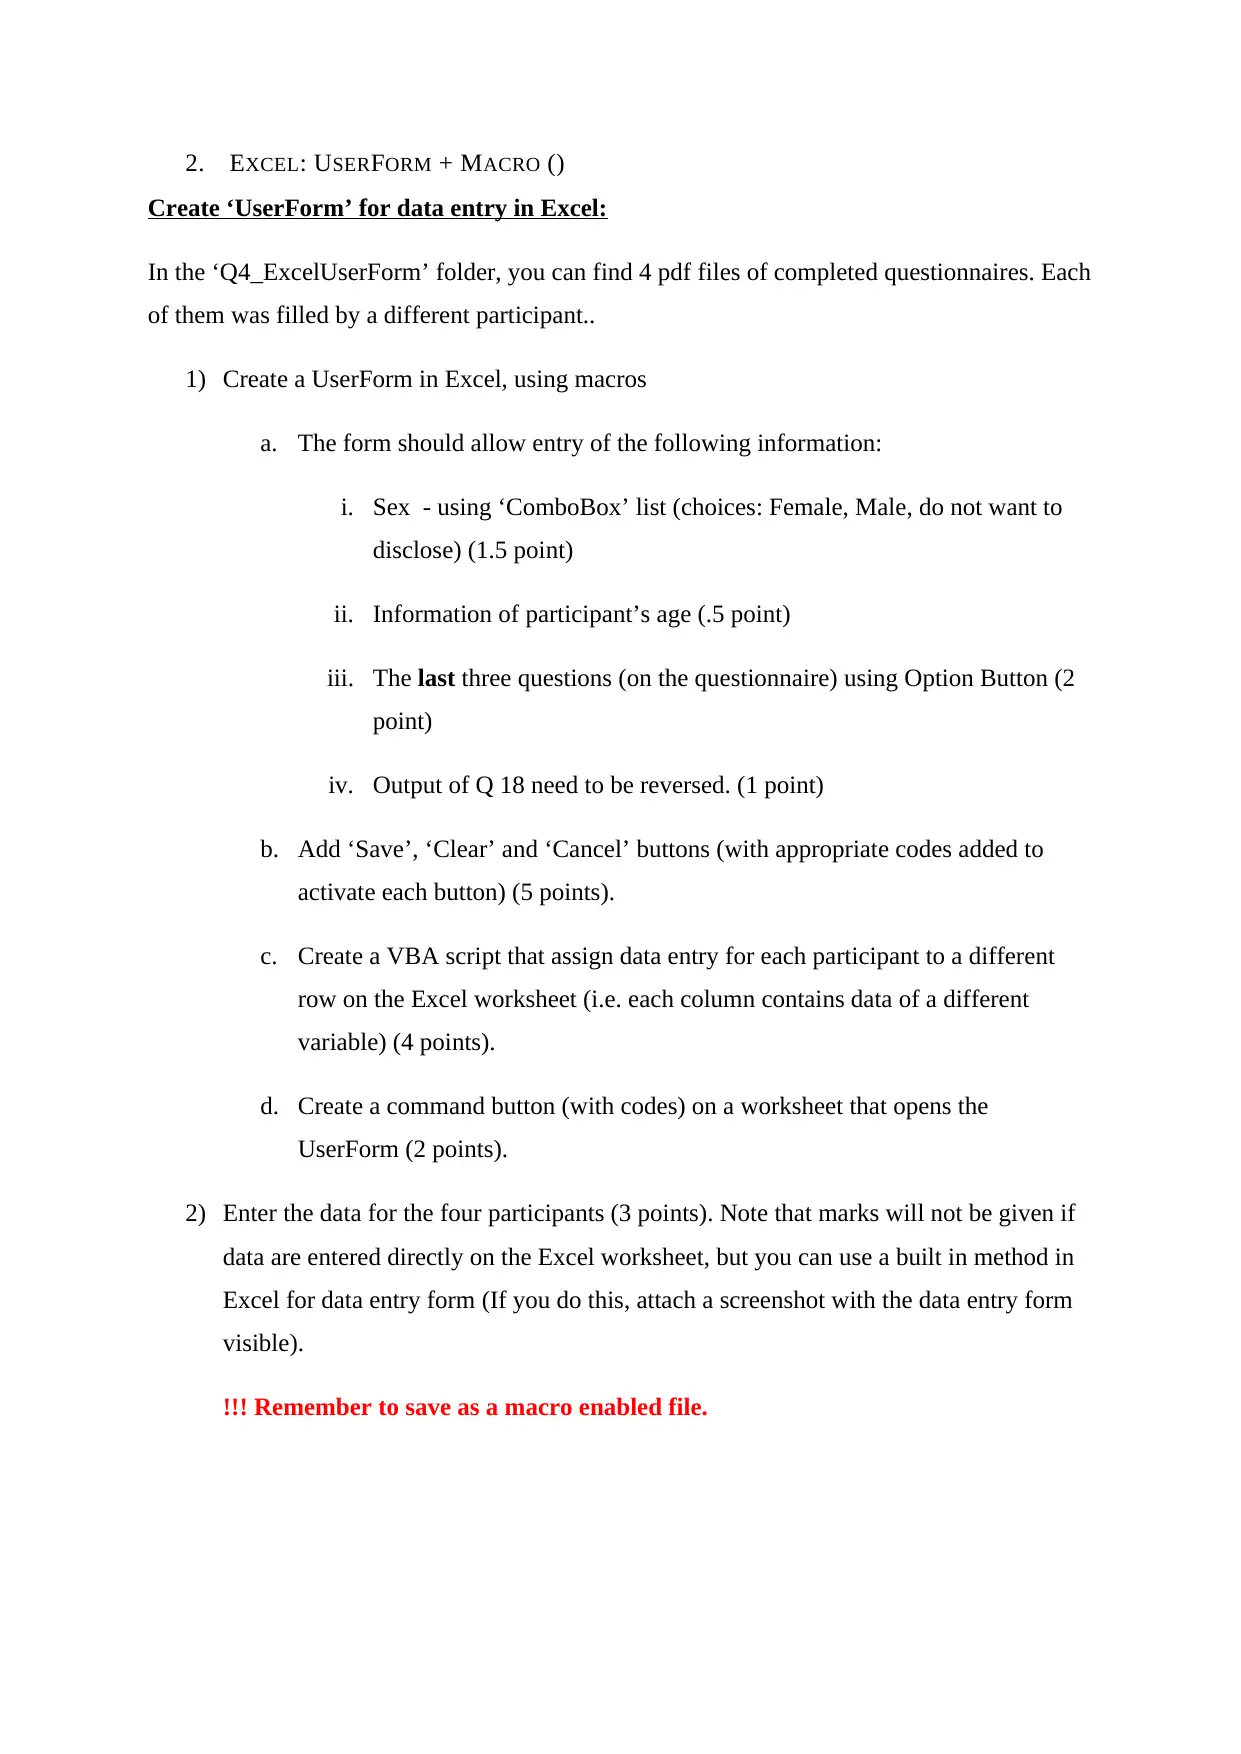
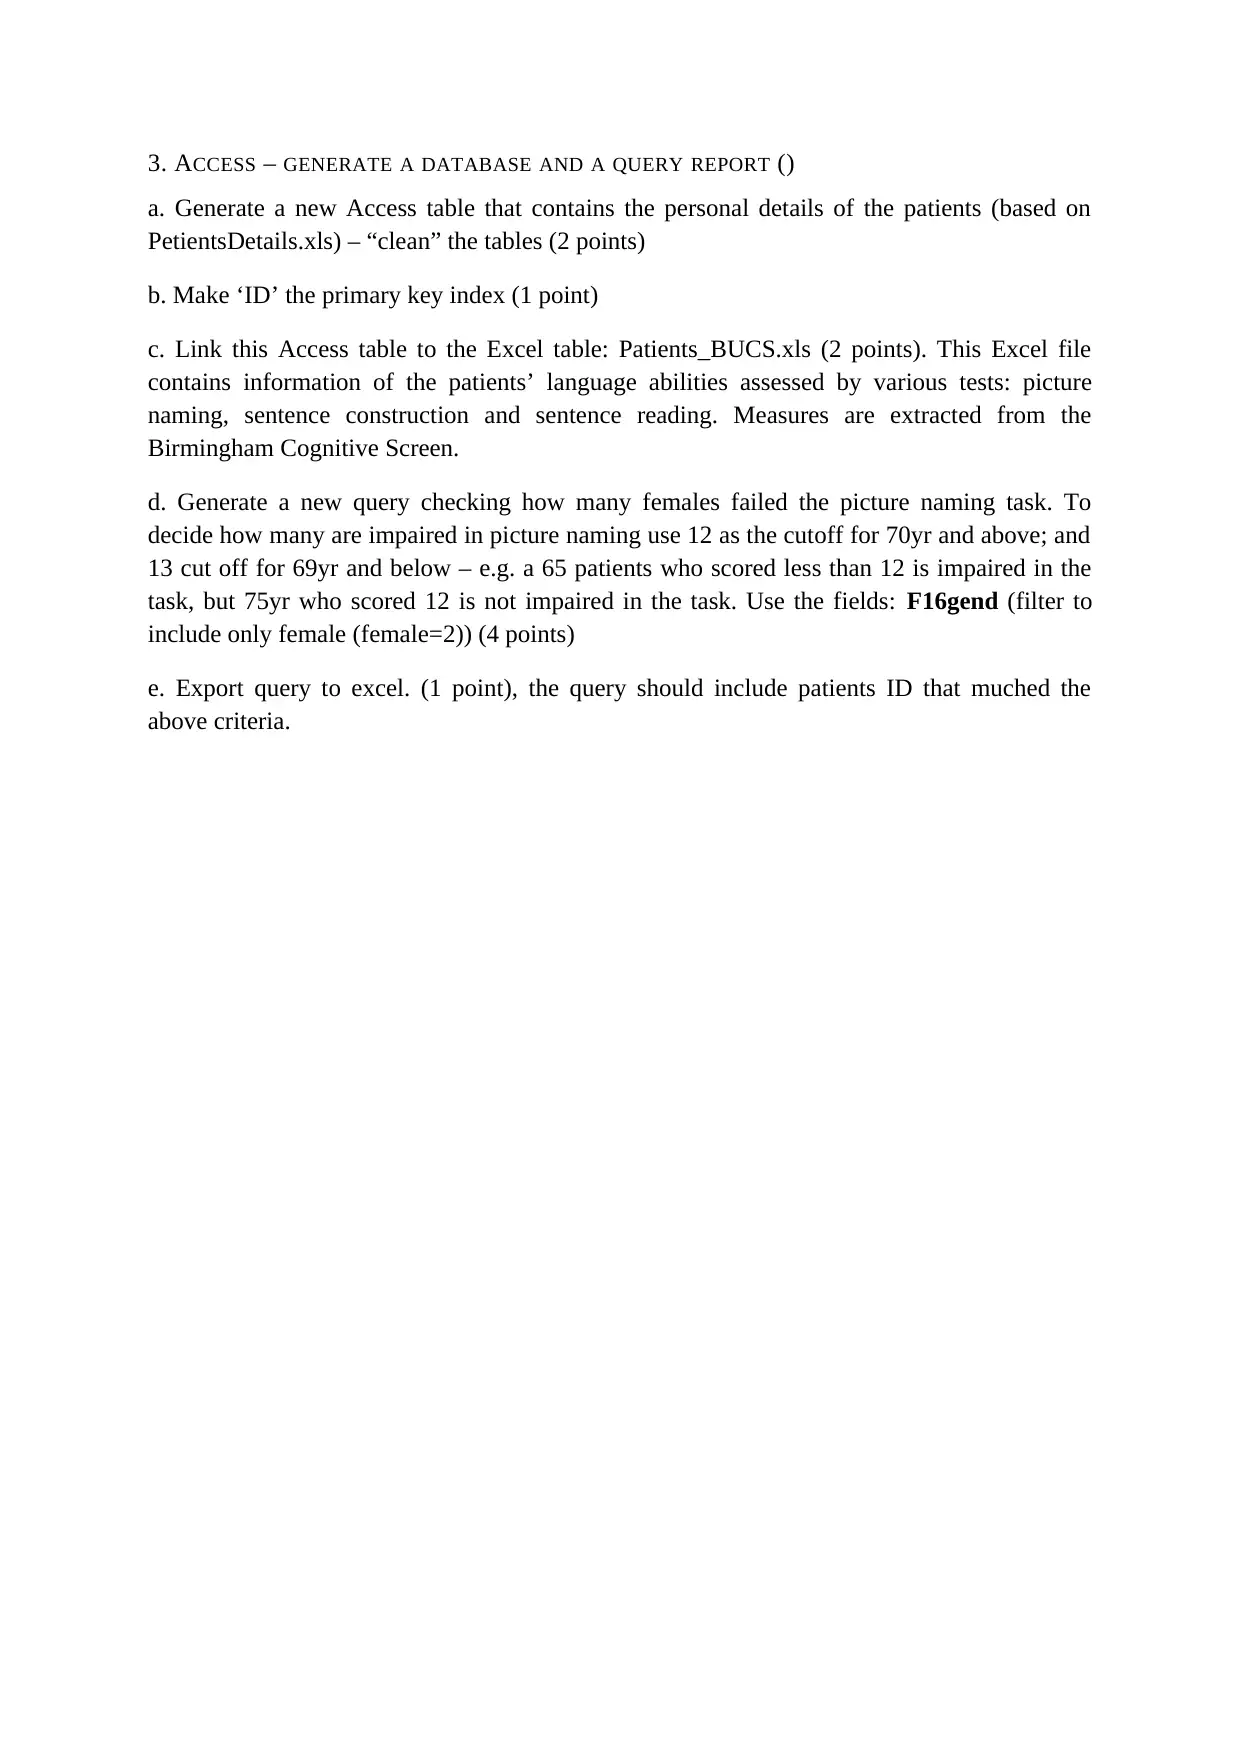
This assignment focuses on data analysis and database management using Microsoft Excel, Access, and VBA. The first part involves importing and manipulating data in Excel using macros to delete irrelevant columns and filter data based on specified criteria. Pivot tables are utilized to compute averages, standard deviations, and analyze data based on multiple conditions. Plots, including line plots and histograms with error bars, are created to visualize the data. The second part requires the creation of a UserForm in Excel using VBA for data entry, including various input types and command buttons. The final part involves generating a database in Access, linking it to an Excel table, and creating a query report to filter and export data based on specific criteria. The assignment emphasizes practical application of data analysis techniques, including data cleaning, transformation, visualization, and database management.
Document Page
1. EXCEL: MACROS, FUNCTIONS AND PIVOT TABLES
THE DATA THAT YOU WILL BE WORKING WITH IS CALLED SUBJ1.TXT; SUBJ2.TXT &
SUBJ3.TXT. THE DESCRIPTION OF THE FILES CONTENT CAN BE FOUND IN
‘EXCEL_README.DOC
A. Import the data into excel (1 point)
B. Using macro, delete the irrelevant columns, see ‘Excel_readme.doc’ for the list of the
relevant column (2 points).
C. Using Macro create a filter to exclude trials in which: The BackwardMask.OnsetDelay
was shorter than 10msec and The Target.DurationError was smaller than 10msec. (3
points). As this experiment depends on the fact that stimuli are presented for very
short time, trials in which the presentation duration was too slow due to computer
errors need to be removed.
D. Apply the two macros to subj2 and subj3, files. TIP: Make sure the columns are
properly arranged before you apply the macro (2 points).
Using pivot tables recorded:
I. Compute the averaged + STDEV using a 2 (eye present: yes, no) x 2(face expression:
fear, happy) x 2 (canonical face: yes, no) output table (3 points)
II. Filter to include only correct trials and compute the averaged RT: using a 2 (eye
present: yes, no) x 2(face expression: fear, happy) x 2 (canonical face: yes, no) output
table (4 points)
Plots for subj 2 only:
III. Make a line plot of the averaged accuracy per condition. Plot eye/no-eyes on the x-
axis, have separate lines for each of the reminding 4 conditions: fearful-canonical,
fearful-non-canonical, happy-canonical, happy non-canonical. (4 points)
IV. Add the standard deviation as error bars. (5 points)
V. Make two charts one for canonical and one for non-canonical face, plotting the
average response times per condition add the stdev for each condition as error bars.
Group the conditions based on the expression (6 points)
VI. Plot the distribution of response times per expression using a histogram (need to
download and maybe install an add-on from the web) (7 points). TIP: Distribution of
responses (a histogram) presents the bars without spaces.
!!! Remember to save the folder while enabling the macro. Check that you can see the
macros when you open the file that you plan to submit on a different computer.
tabler-icon-diamond-filled.svg

Paraphrase This Document

Need a fresh take? Get an instant paraphrase of this document with our AI Paraphraser
Document Page
2. EXCEL: USERFORM + MACRO ()
Create ‘UserForm’ for data entry in Excel:
In the ‘Q4_ExcelUserForm’ folder, you can find 4 pdf files of completed questionnaires. Each
of them was filled by a different participant..
1) Create a UserForm in Excel, using macros
a. The form should allow entry of the following information:
i. Sex - using ‘ComboBox’ list (choices: Female, Male, do not want to
disclose) (1.5 point)
ii. Information of participant’s age (.5 point)
iii. The last three questions (on the questionnaire) using Option Button (2
point)
iv. Output of Q 18 need to be reversed. (1 point)
b. Add ‘Save’, ‘Clear’ and ‘Cancel’ buttons (with appropriate codes added to
activate each button) (5 points).
c. Create a VBA script that assign data entry for each participant to a different
row on the Excel worksheet (i.e. each column contains data of a different
variable) (4 points).
d. Create a command button (with codes) on a worksheet that opens the
UserForm (2 points).
2) Enter the data for the four participants (3 points). Note that marks will not be given if
data are entered directly on the Excel worksheet, but you can use a built in method in
Excel for data entry form (If you do this, attach a screenshot with the data entry form
visible).
!!! Remember to save as a macro enabled file.
Document Page
3. ACCESS GENERATE A DATABASE AND A QUERY REPORT ()
a. Generate a new Access table that contains the personal details of the patients (based on
PetientsDetails.xls) – “clean” the tables (2 points)
b. Make ‘ID’ the primary key index (1 point)
c. Link this Access table to the Excel table: Patients_BUCS.xls (2 points). This Excel file
contains information of the patients’ language abilities assessed by various tests: picture
naming, sentence construction and sentence reading. Measures are extracted from the
Birmingham Cognitive Screen.
d. Generate a new query checking how many females failed the picture naming task. To
decide how many are impaired in picture naming use 12 as the cutoff for 70yr and above; and
13 cut off for 69yr and below – e.g. a 65 patients who scored less than 12 is impaired in the
task, but 75yr who scored 12 is not impaired in the task. Use the fields: F16gend (filter to
include only female (female=2)) (4 points)
e. Export query to excel. (1 point), the query should include patients ID that muched the
above criteria.
chevron_up_icon
1 out of 3
circle_padding
hide_on_mobile
zoom_out_icon
[object Object]