Descriptive and Inferential Statistics Analysis of Relationship
Added on 2021-02-22
BookmarkShareRelated Documents
Statistics Report and excel sheet work
INTRODUCTION...........................................................................................................................1 Descriptive Statistics...................................................................................................................1 Inferential Statistics.....................................................................................................................8 Analysis of relationship.............................................................................................................10 Summary/ Conclusion...................................................................................................................15
INTRODUCTION The present report is based upon two sample size data of simple and stratified sampling method in which the current report helps to determine the average and median salary earned by using descriptive statistics method. On the other side, in inferential statistics data, it describes the confidential interval and researcher also applies different models in order to interpret the data and describe the relationship as well. Descriptive Statistics 
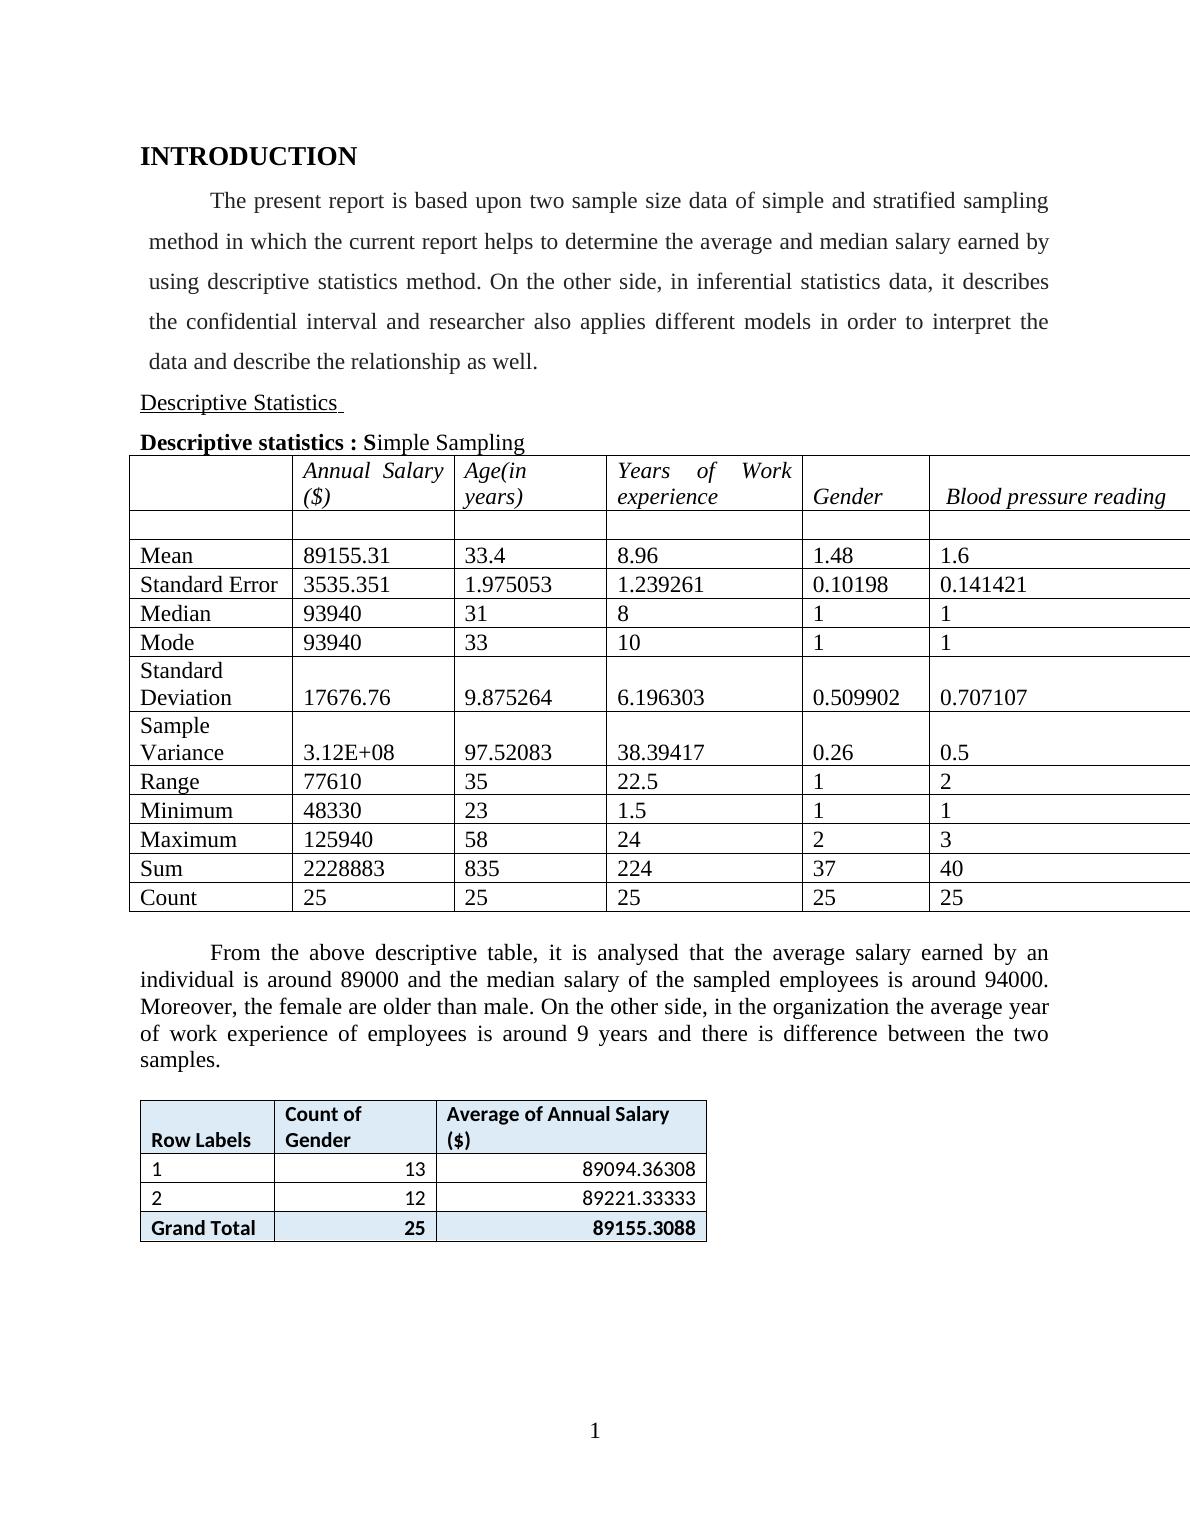
Descriptive statistics : Simple Sampling Annual Salary ($) Age(in years) YearsofWork experienceGenderBlood pressure reading Mean89155.3133.48.961.481.6 Standard Error3535.3511.9750531.2392610.101980.141421 Median9394031811 Mode93940331011 Standard Deviation17676.769.8752646.1963030.5099020.707107 Sample Variance3.12E+0897.5208338.394170.260.5 Range776103522.512 Minimum48330231.511 Maximum125940582423 Sum22288838352243740 Count2525252525 From the above descriptive table, it is analysed that the average salary earned by an individual is around 89000 and the median salary of the sampled employees is around 94000. Moreover, the female are older than male. On the other side, in the organization the average year of work experience of employees is around 9 years and there is difference between the two samples. Row Labels Count of Gender Average of Annual Salary ($) 11389094.36308 21289221.33333 Grand Total2589155.3088 1
(1 represents- Male, 2 represents- Female) Proportion of male/female: proportion of male is higher than female and on an average, female earn higher salary as compared to male. Yes, the salaries are varied according to gender. Distribution of Blood pressure according to gender: Row Labels Count of Gender 113 16 27 29 15 24 33 12 21 Grand Total25 2
End of preview
Want to access all the pages? Upload your documents or become a member.
Related Documents
Business Statistics: Summary, Hypothesis Testing, and Conclusionlg...
|17
|2715
|212
Business Statistics: Summary, Hypothesis Testing, and Conclusionlg...
|18
|3808
|269
Quantitative Methods Paper | Environmental Issueslg...
|13
|2182
|277
Factors Affecting Students’ Performancelg...
|15
|3179
|108
Using Statistics to Analyze Gender Preference for Unisex Gym and Time Spent on Cardio Machineslg...