Comprehensive Valuation of Beximco Pharma Stock: Methods and Analysis
VerifiedAdded on 2022/02/09
|33
|8244
|13
Project
AI Summary
This project provides a detailed stock valuation analysis of Beximco Pharma. It begins with an executive summary and an introduction outlining the objectives, description, methodology, and limitations of the study. Chapter Two offers a company overview, while Chapter Three dives into the valuation exercise, including beta calculation based on historical data, CAPM method, and the estimation of the constant dividend growth rate. The report then calculates the current stock price using the constant dividend growth model and applies the "method of comparables" using P/E, P/B, and P/S ratios. A critical analysis of the difference between calculated and market prices is also included. The project concludes with a summary of findings and provides references and an appendix for supporting data.
Executive Summary
Valuation is a must requirement for assessing an asset of a company in the market
before making any investment or other purposes. For valuation purposes, an analyst
needs to understand risk and return relationship, tailors required rate of return, uses
this rate as discount rate for assuming the value of a stock and determines a price
which might be different from market price.
Undiversifiable risk is the main concern of majority of people while deciding required
rate of return of a stock. BETA, measuring that risk, is 1.37 based on historical
monthly data of 5 years for BXPH stock, showing higher volatility corresponding to
market volatility. CAPM Method suggests that required return rate be 7.11%. Current
price of this stock is 120 Taka found using constant dividend growth model. Growth
rate is 5.93% found on the basis of 17% payout ratio and 7.14% ROE. Value per
share of Beximco Pharma is assumed through comparables methods. Using P/E
ratio, price of the share is 146 Taka. P/B ratio of 0.87 implies Beximco Pharma is
undervalued while P/S ratio of 1.49 says Beximco Pharma is overvalued. Calculated
price and market price do not match because constant growth rate model has
limitations like being inflexible with dynamic economy, disregarding non-dividend
factors. Quality of information disclosed by companies is also a factor for
mismatching calculation and market price.
i
Paraphrase This Document
Need a fresh take? Get an instant paraphrase of this document with our AI Paraphraser
Table of Contents
Executive Summary......................................................................................................ii
Chapter One: Introduction............................................................................................1
1.1 Objectives of the Study.......................................................................................1
1.2 Description of the study......................................................................................1
1.3 Methodology........................................................................................................1
1.4 Limitations...........................................................................................................2
Chapter Two: Company overview................................................................................3
Chapter Three: Valuation Exercise..............................................................................4
3.1 BETA...................................................................................................................4
3.2 CAPM Method...................................................................................................12
3.3 Estimation of the constant dividend growth rate of Beximco Pharmaceutical..14
3.4 Estimation of Current Stock Price of Beximco Pharmaceuticals......................16
3.5 “Method of Comparables” stock valuation approach........................................17
3.6 Critical analysis of the difference between calculated price and market price of
Beximco Pharma stock...........................................................................................24
Chapter Four: Conclusion...........................................................................................27
References.................................................................................................................28
Appendix.....................................................................................................................30
vii
Chapter One: Introduction
Valuation is the analytical process of determining the current (or projected) worth of
an asset or a company. Business management, capital structure, earnings prospect,
market value, economic condition, business cycle are some important factors for
placing a value on any company. Although many methods are available for valuation,
no single method can suit every stock. Different methods can result in different
values which may suggest different price of an asset compared to market price. And
again, valuation can be changed frequently with the change in corporate earnings
and economic events, making Analysts remodeling their methods. Analyst has to
employ a suitable set of valuation methods complying each situation to find the
appropriate result before making or suggesting an investment decision.
1.1 Objectives of the Study
The report is mainly made for academic purposes. It serves for students to apply the
knowledge achieved throughout the course to calculate and understand the risk
associated, return movement with respect to market, price and value of a particular
company stock.
1.2 Description of the study
This report contains application of various valuation methods on the Beximco
Pharma stock. CAPM BETA and CAPM method are applied on market return and
Beximco Pharma stock return of 5 consecutive historical years' monthly data, horizon
and frequency have been carefully chosen based on our best judgement we
developed throughout the course lessons. Constant dividend growth model is used
to calculate the stock price of Beximco Pharma based on a growth rate derived from
using payout ratio of Beximco Pharma. P/E ratio, P/B ratio, P/S ratio of 'methods of
comparables' are calculated for Beximco Pharma using most recent historical data
from financial statements. Finally, calculated price and market price of Beximco
Pharma stock differed and the reasons have been critically evaluated.
1.3 Methodology
Tasks were divided based on each team member’s skills and convenience.
Everything learned during course F-203 were reviewed.
1
⊘ This is a preview!⊘
Do you want full access?
Subscribe today to unlock all pages.
Trusted by 1+ million students worldwide
A listed company based on regular cash dividend payment history was
selected.
Relevant information to required valuation methods was accumulated.
Valuation methods were exercised on company stock by assigned group
member.
Calculation and evaluation were structured in presentable manner with proper
reference.
1.4 Limitations
Lack of experience.
Lack of in-depth knowledge of valuation and market.
Constraints due to pandemic.
Complications in choosing the appropriate data set to use.
Assumption for proxy components.
2
Paraphrase This Document
Need a fresh take? Get an instant paraphrase of this document with our AI Paraphraser

Chapter Two: Company overview
Figure 1: Logo of Beximco Pharmaceuticals Ltd. Source: Ahamed, 2020
Beximco Pharmaceuticals Ltd (Beximco Pharma) is one of the largest
pharmaceutical companies in Bangladesh. The company was established in 1976 in
Bangladesh and started commercial drug production in 1980.
'Life's all about staying healthy and enjoying the good things in life! However, illness
is inevitable at all stages of life'- with this viewpoint, the company is an emerging
generic drug player committed to providing access to affordable medicines. Currently
they are producing more than 500 products.
Beximco Pharma is accredited by many renowned regulatory authorities of world.
Rising cost of healthcare and medicines is a global concern. In order to reduce cost
across the value chain, pharmaceutical companies from developed markets are
partnering with Bangladeshi drug player Beximco Pharma for outsourcing their
production, as our country possesses probably the lowest labor cost. Beximco
Pharma has so far exported medicines to more than 40 countries around the world
(Rahman and Saha, 2015).
For relevance of our study, Beximco Pharma was listed in Dhaka Stock Exchange
(DSE) in 1985, later in Chittagong stock exchange of Bangladesh and in alternative
investments market (aim) of London stock exchange. Their paid-up capital amounts
Taka 4,461.1 million, number of shareholders Around 56,000; total shares
446,112,089. Shares listed with local Stock Exchanges of Bangladesh (ordinary
share) are 346,074,100 (77.58%). No. of GDRs listed on AIM in London Stock
Exchange 100,037,989 (22.42%), these shares are not traded in DSE and CSE.
3
Chapter Three: Valuation Exercise
3.1 BETA
People believing in portfolio theory, find risk as diversifiable and non-diversifiable.
Diversifiable risk can be mitigated by investment portfolio (Calin et al., 2013). It is
non-diversifiable risk that actually concerns the investors as it cannot be avoided.
Most Investors consider systematic risk as the actual measurement of an asset's
risk. This systematic risk is measured by BETA.
CAPM BETA is a theoretical measure of the way how a single stock moves with
respect to the overall market, by taking correlation between the both; market
represents the unsystematic risk and beta represents the systematic risk.
Calculation of BETA for Beximco Pharma Stock;
BETA calculation formula can be stated- covariance of market return and stock
return divided by variance of market return.
To calculate the BETAB of Beximco Pharma stock we need:
> Market return index
> Beximco Pharma Stock return index
Analyst decides for which period of time and how frequent data he or she wants to
use for BETA calculation.
BETA is dependent on time horizon and data frequency (Calin et al., 2013). BETA
calculated using daily data of one year and using monthly data of five years will not
be same. These choices make BETA more appropriate and tailored when they are
right. But these choices are also the weakness of this measurement if chosen
wrongly.
Besides, analyst has to choose the stock market proxy from all available indexes in
the market while different prices like closing price, maximum and minimum prices of
the day, avg price of the day are available there.
We used our best judgement developed based on course lessons and available
study materials to make the choices of time horizon and sample frequency.
4
⊘ This is a preview!⊘
Do you want full access?
Subscribe today to unlock all pages.
Trusted by 1+ million students worldwide
Time horizon
We have taken 5 years market return index and Beximco Pharma stock index. Since
the longer the time horizon for data is, the more accurate calculated BETA will be.
This 5-year time horizon covers pre-pandemic boosting cycle of market in the last
two months of 2017 and half of 2018; as well as during pandemic weak performance
of market, huge fall of mid 2020; and current rapid rising index since the start of 2021
by around 13% too. Thus, business cycle is covered well by this time period and
calculation will be closer to accuracy.
Sample frequency
We have chosen monthly data for market return index and Beximco Pharma stock
return index. The reason behind making this choice is mainly avoiding data noise.
Using daily data of 5 years would have been closest to accuracy but we hoped that
from students view point, we would be able to handle monthly data frequency for 5
years better and monthly data will be representative enough for the whole month's
transactions without much deviation. We have taken adjusted closing price so that
impact of cash dividend and stock dividend are also included in calculation.
Stock market proxy
There are two secondary markets: Dhaka Stock Exchange (DSE) and Chittagong
Stock Exchange (CSE). There are three indexes associated with the DSE. The DSE
Broad Index (DSEX) includes all the companies listed on the exchange. The DSE 30
Index (DS30) tracks the 30 largest companies by market capitalization. The DSE
Shariah Index (DSES) includes DSEX stocks that comply with Shariah law. We
chose DSEX that is DSE broad index as stock market proxy since it is representative
of the trend of whole market, not just good performing companies. That way we can
get result closer to reality. We have collected all the relevant data from a website
investing.com according to our need.
We know,
BETA formula
B= (Covariance of stock return with the market return)/ Variance of market return
5
Paraphrase This Document
Need a fresh take? Get an instant paraphrase of this document with our AI Paraphraser
BETA Calculation in Excel
BETA is a measure of stock price variability in relation to the overall stock market.
BETA is calculated by covariance of stock return and market return divided by
variance of market return.
Step 1: Download the Stock Prices & Index Data for the past 5 years
Step 2: Sort the Dates & Adjusted Closing Prices for downloaded data set. Open,
High, Low, Close & Volume are not required for BETA Calculations.
Step 3: Prepare a single sheet of Stock Prices Data & Index Data.
Step 4: Calculate the Fractional Monthly Return by any return less previous return
divided by previous return for both the stock return and market return.
Step 5: Calculate BETA – Three Methods
Either of the three methods can be used to calculate BETA – 1) Variance/Covariance
Method 2) Slope Function in excel 3) Data Regression
In our study, we used 1st method- variance/covariance method where covariance of
fractional market return and BXPH stock return and variance of fractional market
return are separately calculated using Excel formulas and finally divided to find the
BETA coefficient.
6
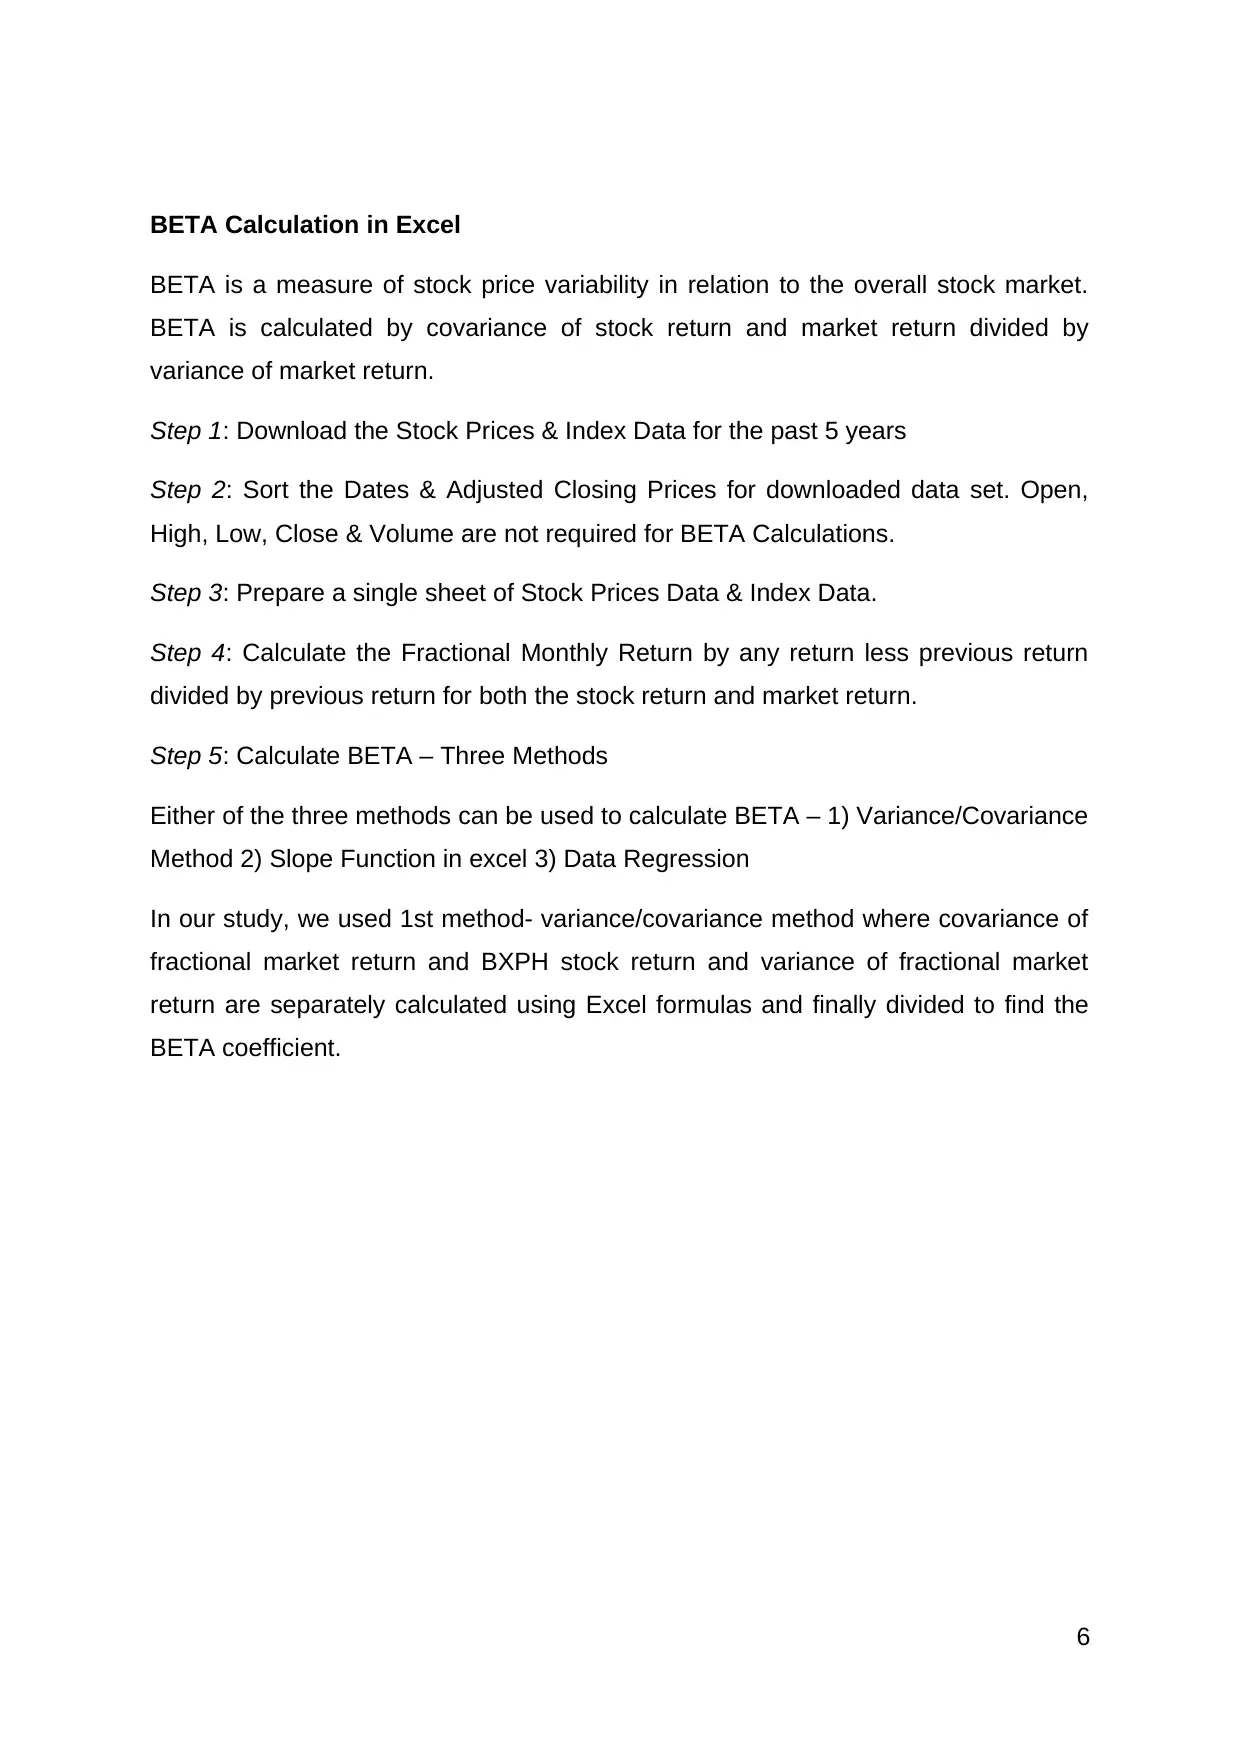
Date Price
BXPH Stock -
return DSEX Index DSEX Index Return
21-Jun 171 -0.41% 2,172.97 -1.49%
21-May 171.7 -10.57% 2,205.81 4.50%
21-Apr 192 3.56% 2,110.91 5.84%
21-Mar 185.4 5.16% 1,994.40 -3.04%
21-Feb 176.3 -4.29% 2,056.83 -4.79%
21-Jan 184.2 -3.31% 2,160.39 10.00%
20-Dec 190.5 32.85% 1,963.96 16.39%
20-Nov 143.4 33.33% 1,687.40 0.43%
20-Oct 107.55 0.43% 1,680.13 -0.94%
20-Sep 107.09 1.99% 1,695.99 -0.21%
20-Aug 105 43.13% 1,699.54 19.63%
20-Jul 73.36 16.61% 1,420.63 5.94%
20-Jun 62.91 3.74% 1,340.98 -1.79%
20-May 60.64 -0.10% 1,365.37 2.60%
20-Apr 60.7 10.00% 1,330.83 0.00%
20-Mar 55.18 -16.85% 1,330.83 -10.82%
20-Feb 66.36 -0.96% 1,492.37 -2.08%
20-Jan 67 6.20% 1,524.04 0.71%
19-Dec 63.09 -13.47% 1,513.34 -8.15%
19-Nov 72.91 3.62% 1,647.70 1.23%
19-Oct 70.36 -7.97% 1,627.74 -7.51%
19-Sep 76.45 0.12% 1,759.96 -2.23%
19-Aug 76.36 1.94% 1,800.05 -1.52%
19-Jul 74.91 -1.32% 1,827.90 -5.25%
19-Jun 75.91 6.92% 1,929.09 2.80%
19-May 71 -3.34% 1,876.59 1.62%
19-Apr 73.45 -4.05% 1,846.67 -6.13%
19-Mar 76.55 -7.47% 1,967.21 -1.57%
19-Feb 82.73 4.60% 1,998.65 -0.46%
19-Jan 79.09 9.98% 2,007.96 6.76%
18-Dec 71.91 0.25% 1,880.78 1.03%
18-Nov 71.73 3.96% 1,861.56 -0.88%
18-Oct 69 -7.44% 1,878.03 -0.62%
18-Sep 74.55 -7.76% 1,889.70 -3.62%
18-Aug 80.82 0.80% 1,960.71 4.21%
18-Jul 80.18 -6.07% 1,881.46 -4.00%
18-Jun 85.36 -4.48% 1,959.94 -0.76%
18-May 89.36 -6.83% 1,974.99 -7.86%
18-Apr 95.91 2.63% 2,143.54 1.78%
18-Mar 93.45 -2.29% 2,106.02 -1.88%
18-Feb 95.64 -1.13% 2,146.37 -4.13%
18-Jan 96.73 2.51% 2,238.95 -1.94%
17-Dec 94.36 -0.10% 2,283.22 0.58%
17-Nov 94.45 6.66% 2,270.13 4.71%
7
⊘ This is a preview!⊘
Do you want full access?
Subscribe today to unlock all pages.
Trusted by 1+ million students worldwide
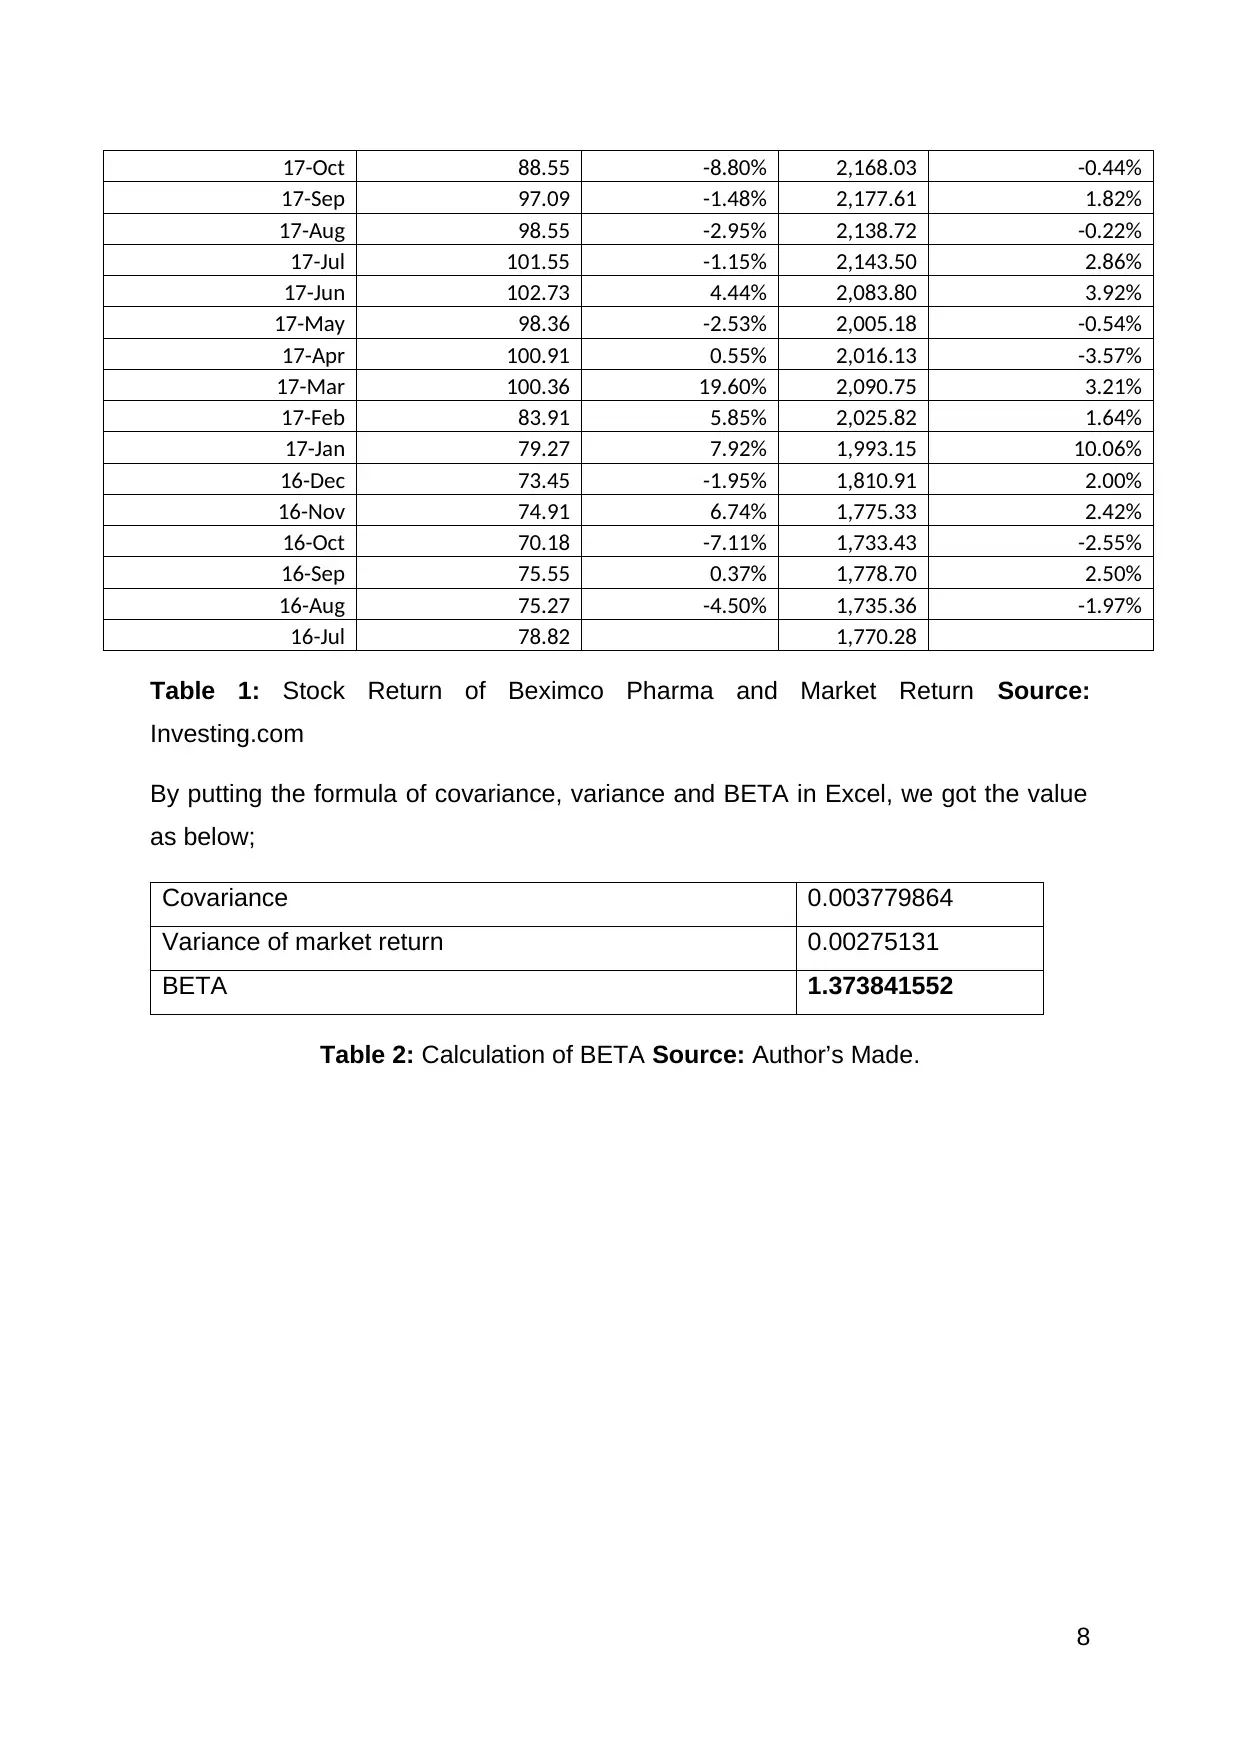
17-Oct 88.55 -8.80% 2,168.03 -0.44%
17-Sep 97.09 -1.48% 2,177.61 1.82%
17-Aug 98.55 -2.95% 2,138.72 -0.22%
17-Jul 101.55 -1.15% 2,143.50 2.86%
17-Jun 102.73 4.44% 2,083.80 3.92%
17-May 98.36 -2.53% 2,005.18 -0.54%
17-Apr 100.91 0.55% 2,016.13 -3.57%
17-Mar 100.36 19.60% 2,090.75 3.21%
17-Feb 83.91 5.85% 2,025.82 1.64%
17-Jan 79.27 7.92% 1,993.15 10.06%
16-Dec 73.45 -1.95% 1,810.91 2.00%
16-Nov 74.91 6.74% 1,775.33 2.42%
16-Oct 70.18 -7.11% 1,733.43 -2.55%
16-Sep 75.55 0.37% 1,778.70 2.50%
16-Aug 75.27 -4.50% 1,735.36 -1.97%
16-Jul 78.82 1,770.28
Table 1: Stock Return of Beximco Pharma and Market Return Source:
Investing.com
By putting the formula of covariance, variance and BETA in Excel, we got the value
as below;
Covariance 0.003779864
Variance of market return 0.00275131
BETA 1.373841552
Table 2: Calculation of BETA Source: Author’s Made.
8
Paraphrase This Document
Need a fresh take? Get an instant paraphrase of this document with our AI Paraphraser
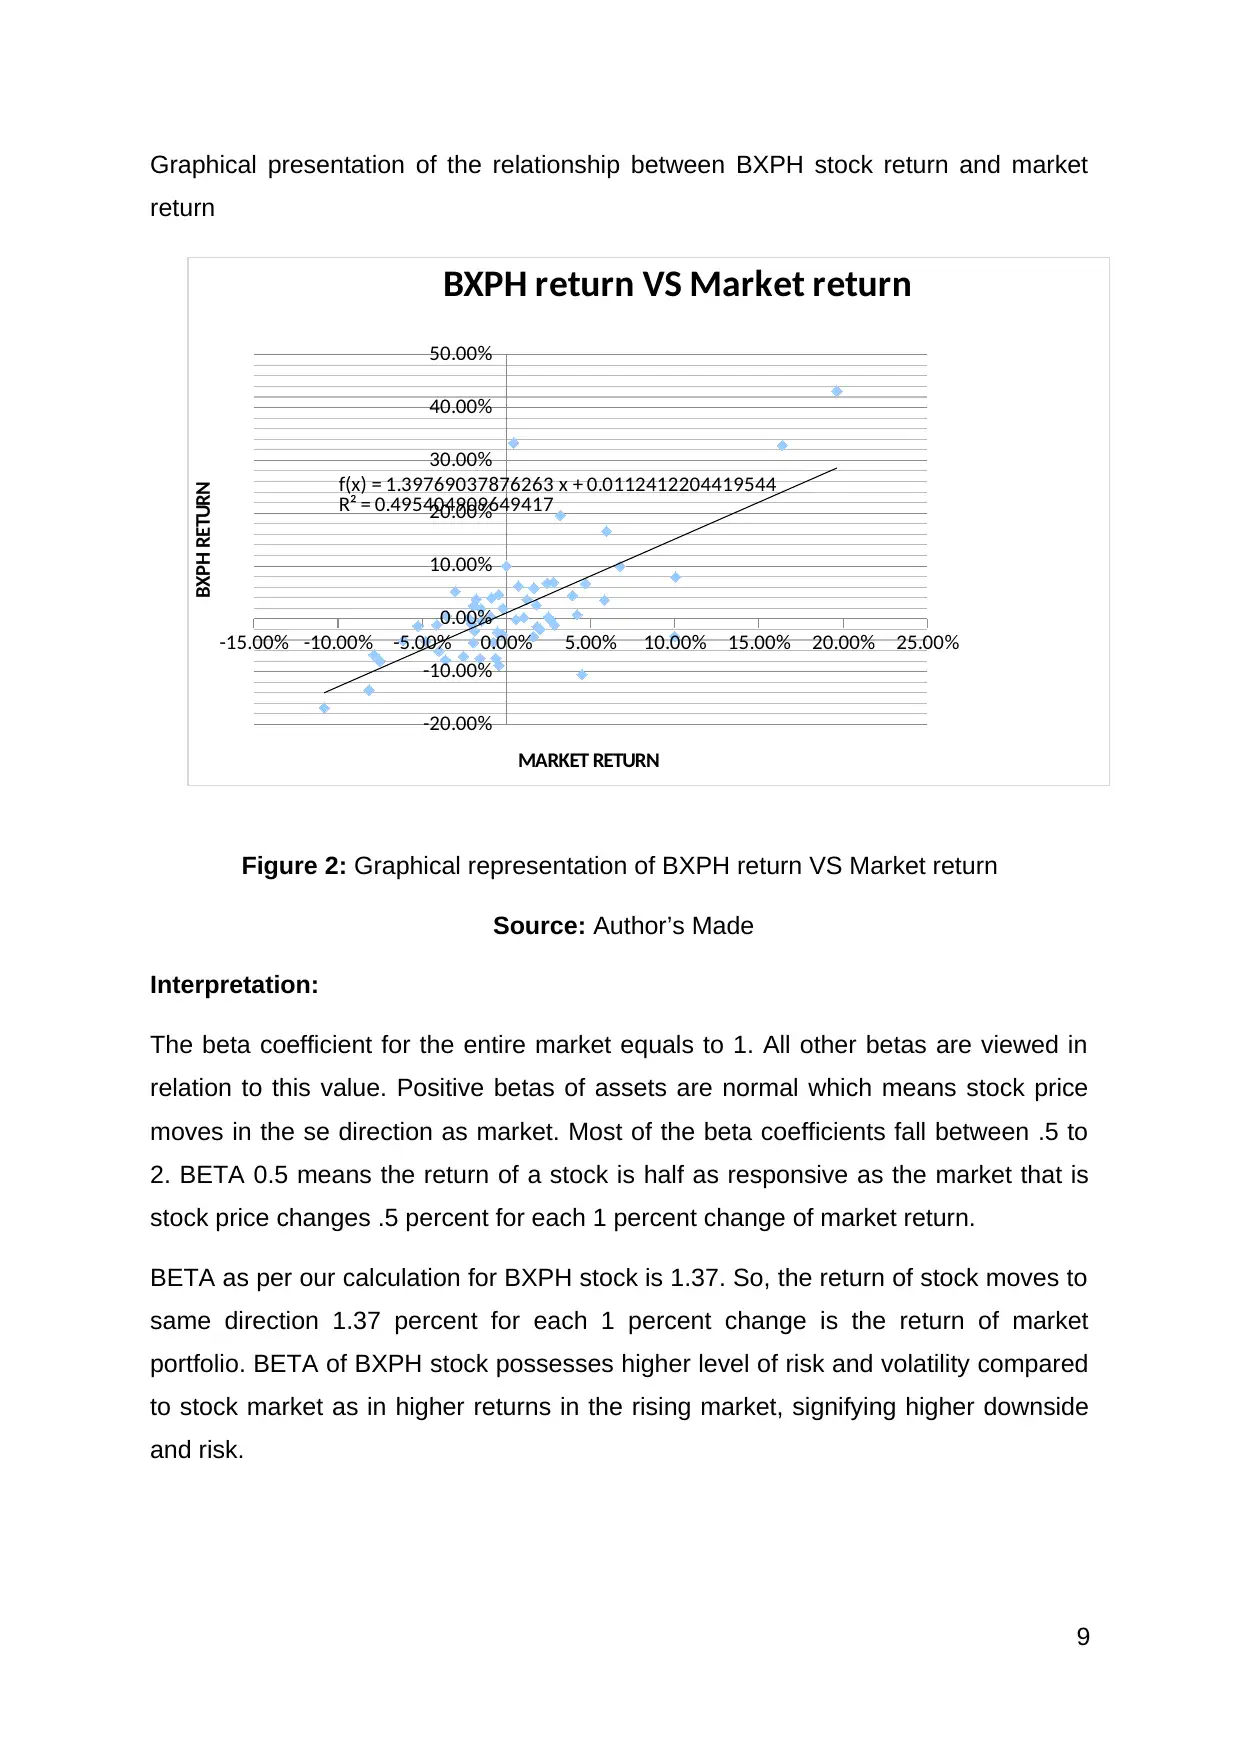
Graphical presentation of the relationship between BXPH stock return and market
return
Figure 2: Graphical representation of BXPH return VS Market return
Source: Author’s Made
Interpretation:
The beta coefficient for the entire market equals to 1. All other betas are viewed in
relation to this value. Positive betas of assets are normal which means stock price
moves in the se direction as market. Most of the beta coefficients fall between .5 to
2. BETA 0.5 means the return of a stock is half as responsive as the market that is
stock price changes .5 percent for each 1 percent change of market return.
BETA as per our calculation for BXPH stock is 1.37. So, the return of stock moves to
same direction 1.37 percent for each 1 percent change is the return of market
portfolio. BETA of BXPH stock possesses higher level of risk and volatility compared
to stock market as in higher returns in the rising market, signifying higher downside
and risk.
9
-15.00% -10.00% -5.00% 0.00% 5.00% 10.00% 15.00% 20.00% 25.00%
-20.00%
-10.00%
0.00%
10.00%
20.00%
30.00%
40.00%
50.00%
f(x) = 1.39769037876263 x + 0.0112412204419544
R² = 0.495404909649417
BXPH return VS Market return
MARKET RETURN
BXPH RETURN

Although pharmaceuticals industry is a low beta sector, that is not correlated with
economic growth swing, BXPH stock BETA is relatively higher and effected
significantly by economic changes in Bangladeshi Stock market context.
Advantages of CAPM BETA
> Single measures to provide an understanding of security volatility as compared to
the market.
> Therefore, helps an investor to make decisions of adding or deleting a security
from portfolio.
> Considers systematic risk, thereby providing the real picture of the risks involved
since unsystematic risk is mitigated by portfolio.
Disadvantages of CAPM BETA
> “Past Performance is no guarantee of future” – This rule also applies on BETA.
Using this historical beta may not hold true in the future.
> Cannot accurately measure BETA for new Stocks, unlisted or private stocks.
> BETA does not tell us whether the stock was more volatile during the bear phase
or the bull phase. It does not distinguish between upswings or downswing
movements of economy.
Levered vs. Unlevered BETA
Levered BETA or Equity BETA is the BETA that contains the effect of capital
structure, i.e., Debt and Equity both (Margaritis and Psillaki, 2010). The beta that we
calculated above is the Levered BETA.
Unlevered BETA is the BETA after removing the effects of the capital structure. As
seen above, once we remove the financial leverage effect, we will be able to
calculate Unlevered BETA.
Unlevered BETA can be calculated using the following formula –
BETA (Unlevered) = BETA (levered)/ [1+ (1-tax) * (Debt/Equity)]
Debt/equity ratio of Beximco Pharma is= Total Liabilities/ Total Equity
= (35569.55 / 15649.75) Million BDT
= 23.46%
10
⊘ This is a preview!⊘
Do you want full access?
Subscribe today to unlock all pages.
Trusted by 1+ million students worldwide
1 out of 33
Related Documents


Your All-in-One AI-Powered Toolkit for Academic Success.
+13062052269
info@desklib.com
Available 24*7 on WhatsApp / Email
![[object Object]](/_next/static/media/star-bottom.7253800d.svg)
Unlock your academic potential
Copyright © 2020–2026 A2Z Services. All Rights Reserved. Developed and managed by ZUCOL.