Financial Performance Analysis of Crocodile Garments Limited: Report
VerifiedAdded on 2019/09/30
|19
|5833
|365
Report
AI Summary
This report presents a comprehensive business and financial analysis of Crocodile Garments Limited, examining its core operations, market position, and financial performance. The report includes a detailed review of the company's financial statements, utilizing horizontal and vertical analysis to identify trends and key performance indicators. It assesses the company's structure, shareholding, and compares its performance with industry peers. Additionally, the report delves into corporate governance practices, investment appraisal, and the development of a future-oriented financial plan, culminating in a proposed audit plan to address potential areas of concern. The analysis aims to provide insights into the company's financial health, strategic direction, and potential for future growth, offering recommendations for improvement and investment strategies.

Executive Summary
This report is about the business and financial data study of the Crocodile Garments Limited.
The business study report will have the study about of the main operations of the business,
the values and market capitalization of the company and how it deals with its competitors and
other market segments. Followed by this, financial analysis, operational review are been done
through analyzing the vertical and horizontal analysis of the company financial report. The
ratios of the companies has been worked out to find out the actual reason where the progress
needs to be done and how the company can move ahead to the business. These all report are
been then compared with two other companies so to benchmark their status with the other
companies of similar industry.
Furthermore, the Corporate Governance policy has also been overlooked which will further
assist how the company follow the best practices available for their company.
Investment plans for the future growths has also been an area where this report will focus on
and suggest the best possible way to invest the funds in some of the projects. The investment
and fund-raising management of the company has to be done as per the total assets available
to the company.
After the whole analysis an audit report has been framed and the audit plan has been shared
with the company so to get the trace the adverse remarks and the things on early moments
and then plan the things further.
1
Paraphrase This Document
Need a fresh take? Get an instant paraphrase of this document with our AI Paraphraser

Table of Contents:
Particulars Page no.
1. Introduction 3
1.1. Background of the company
1.2. Company Structure
1.3. Company Shareholding
2. Financial Review 4
2.1. Horizontal Analysis 4
2.2. Vertical Analysis 7
2.3. Operational Analysis 11
2.4. Ratios Analysis 11
3. Corporate Governance 14
4. Investment Appraisal
5. Financial Plan 15
6. Audit Plan 16
7. Conclusion and Recommendation 17
8. References 18
2

1. Introduction:
1.1 Background of the company:
The company is having a business and associated in a business of several fashion labels and
is generated in the manufacture, retail and wholesale of fashions in Hong Kong, Macau and
Mainland China, as well as property investment and letting in Hon kong and Mainland China.
(Annual Report, 2018) So, when we discuss about the group, then all the above components
are in sales, lead by the main business i.e. Fashion in terms of Men’s Fashion, Women’s
Fashion, Kid’s Fashion and imported labels. During the year ended 31 July, 2018, the net
profit of the company steady by HK $ 265,004,000. Further to this, the order division profits
are been different and reported on segment basis, where it has been review that profit is been
dipped slightly by 0.5% and the profit has been reduced.
The company was first listed on the stock exchange in the year 1971, and then the shares
were traded continuously.
1.2. Company Structure
Crocodile Garments Limited (Annual Report,2018) disclosed that the company corporate
structure apart from the Board and the management. Despite the company’s main share are
been shared by the Managing director but still management of the company is having a big
structure having a big team of, CEO, Division managers, Admin & HR, information
technology, accounting and finance.
1.3 Company Shareholdings
During the year, there was no addition in the equity capital, so the total equity remains to
$332,323, adding to this the retained profits, 1,336,858 and other reserves the total value of
equity reached to 1,799,591. The list of shareholders in the company are:
1. Lam Kin Ming, 486,918,000 51.39%
2. Lam Wai Shan, 10,026,500 0.06%
3. Wan Edward Yee Hwa 610,000 0.06%
4. Rich Promise Limited 472,200,000 49.83%
The above shareholding includes the substantial shareholders and personal interests / interest
in the associated corporation.
3
⊘ This is a preview!⊘
Do you want full access?
Subscribe today to unlock all pages.
Trusted by 1+ million students worldwide

2. Financial Review:
2.1 Horizontal Analysis:
We can review the annual report of the company so to identify the financial improvement of
the company during the last three years. The years improvement has helped the company to
improve the core strength and increase the stability of the company’s resources. For the said
analysis last 3 years financials has been reviewed and analysis has been in terms of Vertical
and Horizontal analysis so to identify the clear picture of the company on the basis of each
items.
Crocodile Limited
Particulars 2018 2017
Amount
(Inc./De
c)
%
(inc./
Dec.) 2017 2016
Amount
(Inc./De
c)
%
(inc./
Dec.)
Revenue
265,0
04
264,1
19 885 0
264,1
19
313,2
17 (49,098) (16)
Cost of goods sold
84,53
2
95,02
7 (10,495) (11)
95,02
7
126,3
83 (31,356) (25)
Gross profit
180,4
72
169,0
92 11,380 7
169,0
92
186,8
34 (17,742) (9)
Operating Incomes
205,9
33
157,5
54 48,379 31
157,5
54
87,53
3 70,021 80
General and Admin
expenses
(64,3
18)
(60,1
79) (4,139) 7
(60,1
79)
(65,1
67) 4,988 (8)
Distribution and
selling expenses
(145,
512)
(155,
361) 9,849 (6)
(155,
361)
(197,
661) 42,300 (21)
Redemption and
Loss on change of
value
(11,6
67) 11,667 (100)
(11,6
67) (11,667)
#DIV/
0!
Finance Cost
(14,5
72)
(12,5
73) (1,999) 16
(12,5
73)
(12,1
05) (468) 4
Taxation Charge 490 1,252 (762) (61) 1,252 1,021 231 23
4
Paraphrase This Document
Need a fresh take? Get an instant paraphrase of this document with our AI Paraphraser

Net Profit
162,4
93
88,11
8 74,375 84
88,11
8 455 87,663
19,26
7
As per the above table, it can be reviewed that the revenue of the company has been increased
slightly during the year but the net profit has been increased by 84%. The reasons of such
increment are: Reduction of cost of goods sold by 11%, which results increment of gross
profit by 7%. Followed by the reduction of distribution and selling expenses by 6% and taxes
during the year by 61%. Also, the operating income i.e. exchange gains and other incomes
has been increased by 31% during the year 2018, so the net profit has been increased to
higher value. Comparing to the year 2016 and 2017, the profit has been increased drastically
from 455$ to 88,118 and the reasons of such increment are reduction of cost of goods sold by
25%, higher than the reduction of sales which means that the variable cost are been purchased
at less price and thus the cost of goods sold has been reduced for the period. Followed by this,
this other related cost in terms of reduction of general and admin expenses and selling and
distribution expenses has added value to the company and bring more effectiveness in the
workings of the company. This also highlight the optimation of the resources and building the
profits.
Yangtzekiang
Garment Limited
Particulars 2018 2017
Amount
(Inc./De
c)
%
(inc./
Dec.) 2017 2016
Amount
(Inc./De
c)
%
(inc./
Dec.)
Revenue
749,2
80
800,3
43 (51,063) (6)
800,3
43
938,4
34
(138,091
) (15)
Cost of properties
sold and services
611,7
31
661,0
36 (49,305) (7)
661,0
36
774,1
24
(113,088
) (15)
Gross profit
137,5
49
139,3
07 (1,758) (1)
139,3
07
164,3
10 (25,003) (15)
Operating Incomes
10,86
6
11,01
6 (150) (1)
11,01
6 9,029 1,987 22
General and
Admin expenses
(77,7
23)
(80,5
12) 2,789 (3)
(80,5
12)
(85,9
18) 5,406 (6)
Distribution and
selling expenses (53,5 (57,2 3,652 (6) (57,2 (64,1 6,868 (11)
5

96) 48) 48) 16)
Redemption and
Loss on change of
value
27,75
4
24,40
0 3,354 14
24,40
0
(12,2
88) 36,688 (299)
Finance Cost
(2,55
3)
(2,71
9) 166 (6)
(2,71
9)
(3,00
2) 283 (9)
Taxation Charge
(7,25
4)
(6,25
9) (995) 16
(6,25
9)
(3,65
8) (2,601) 71
Net Profit
35,04
3
27,98
5 7,058 25
27,98
5 4,357 23,628 542
As per the table above, the company net profit has been increased by 25% during the year
2018 and some of the reasons are, the cost of goods has been reduced by 7%, when the
revenue has been reduced by 6%, this is a sign of perfect variable cost bargaining and
realization of volume and price of the raw materials. Further the general, admin cost were
reduced by 3% and selling and distribution expenses reduced by 6%. This impact to increase
tax burden by 16%. While in comparing to the 2016, the net profit has drastically increased to
542%, and the reasons were due to reduction of change in exchange loss or redemption loss,
it has impact by 300%. Other expenses were reduced by 11and 6% for the period and this has
held to reduced the overall cost for the company and increase the profit for the period of the
company.
High Fashion
International
Limited
Particulars 2018 2017
Amount
(Inc./De
c)
%
(inc./
Dec.) 2017 2016
Amount
(Inc./De
c)
%
(inc./
Dec.)
Revenue
3,074
,745
2,732
,974 341,771 13
2,732
,974
2,422
,545 310,429 13
Cost of properties
sold and services
2,516
,612
2,208
,070 308,542 14
2,208
,070
1,947
,474 260,596 13
Gross profit
558,1
33
524,9
04 33,229 6
524,9
04
475,0
71 49,833 10
6
⊘ This is a preview!⊘
Do you want full access?
Subscribe today to unlock all pages.
Trusted by 1+ million students worldwide

Operating Incomes
70,39
5
133,1
47 (62,752) (47)
133,1
47
236,2
68
(103,121
) (44)
General and
Admin expenses
(344,
675)
(327,
201) (17,474) 5
(327,
201)
(384,
815) 57,614 (15)
Distribution and
selling expenses
(218,
051)
(209,
622) (8,429) 4
(209,
622)
(209,
933) 311 (0)
Redemption and
Loss on change of
value
(6,11
7) (527) (5,590) 1,061 (527) (619) 92 (15)
Finance Cost
(29,9
37)
(32,1
00) 2,163 (7)
(32,1
00)
(30,7
40) (1,360) 4
Taxation credit
(charges) 8,920
(45,9
26) 54,846 (119)
(45,9
26)
(43,9
68) (1,958) 4
Net Profit
38,66
8
42,67
5 (4,007) (9)
42,67
5
41,26
4 1,411 3
On the similar industry but having a difference impact on financials, High Fashion
International Limited net profit for the year 2018 has been noticed to be reduced by 9% than
previous years. Further the company’s net revenue has been increased by 13%, but due to
increase in COGS by 14% has resulted to decrease in net profit. Further the redemption and
loss changed by huge percentage and this is where the tax impact has been noticed and
reduced to a huge percentage. While comparing with 2016, the amount has been shown
where the COGS and revenue has been increased by 13% and the net profit has been
increased by 3% from 2016. If we compare these figures with the Easyknit international then
we can see that during the periods from 2016 to 2017, the potential of revenue has been
increased but the Easyknit has not shown any increase in the revenue. If the volume can be
increased then there is a potential change to change the profit for the company in much more
higher way that it is predictable.
2.2 Vertical Analysis:
Crocodile Garments:
7
Paraphrase This Document
Need a fresh take? Get an instant paraphrase of this document with our AI Paraphraser
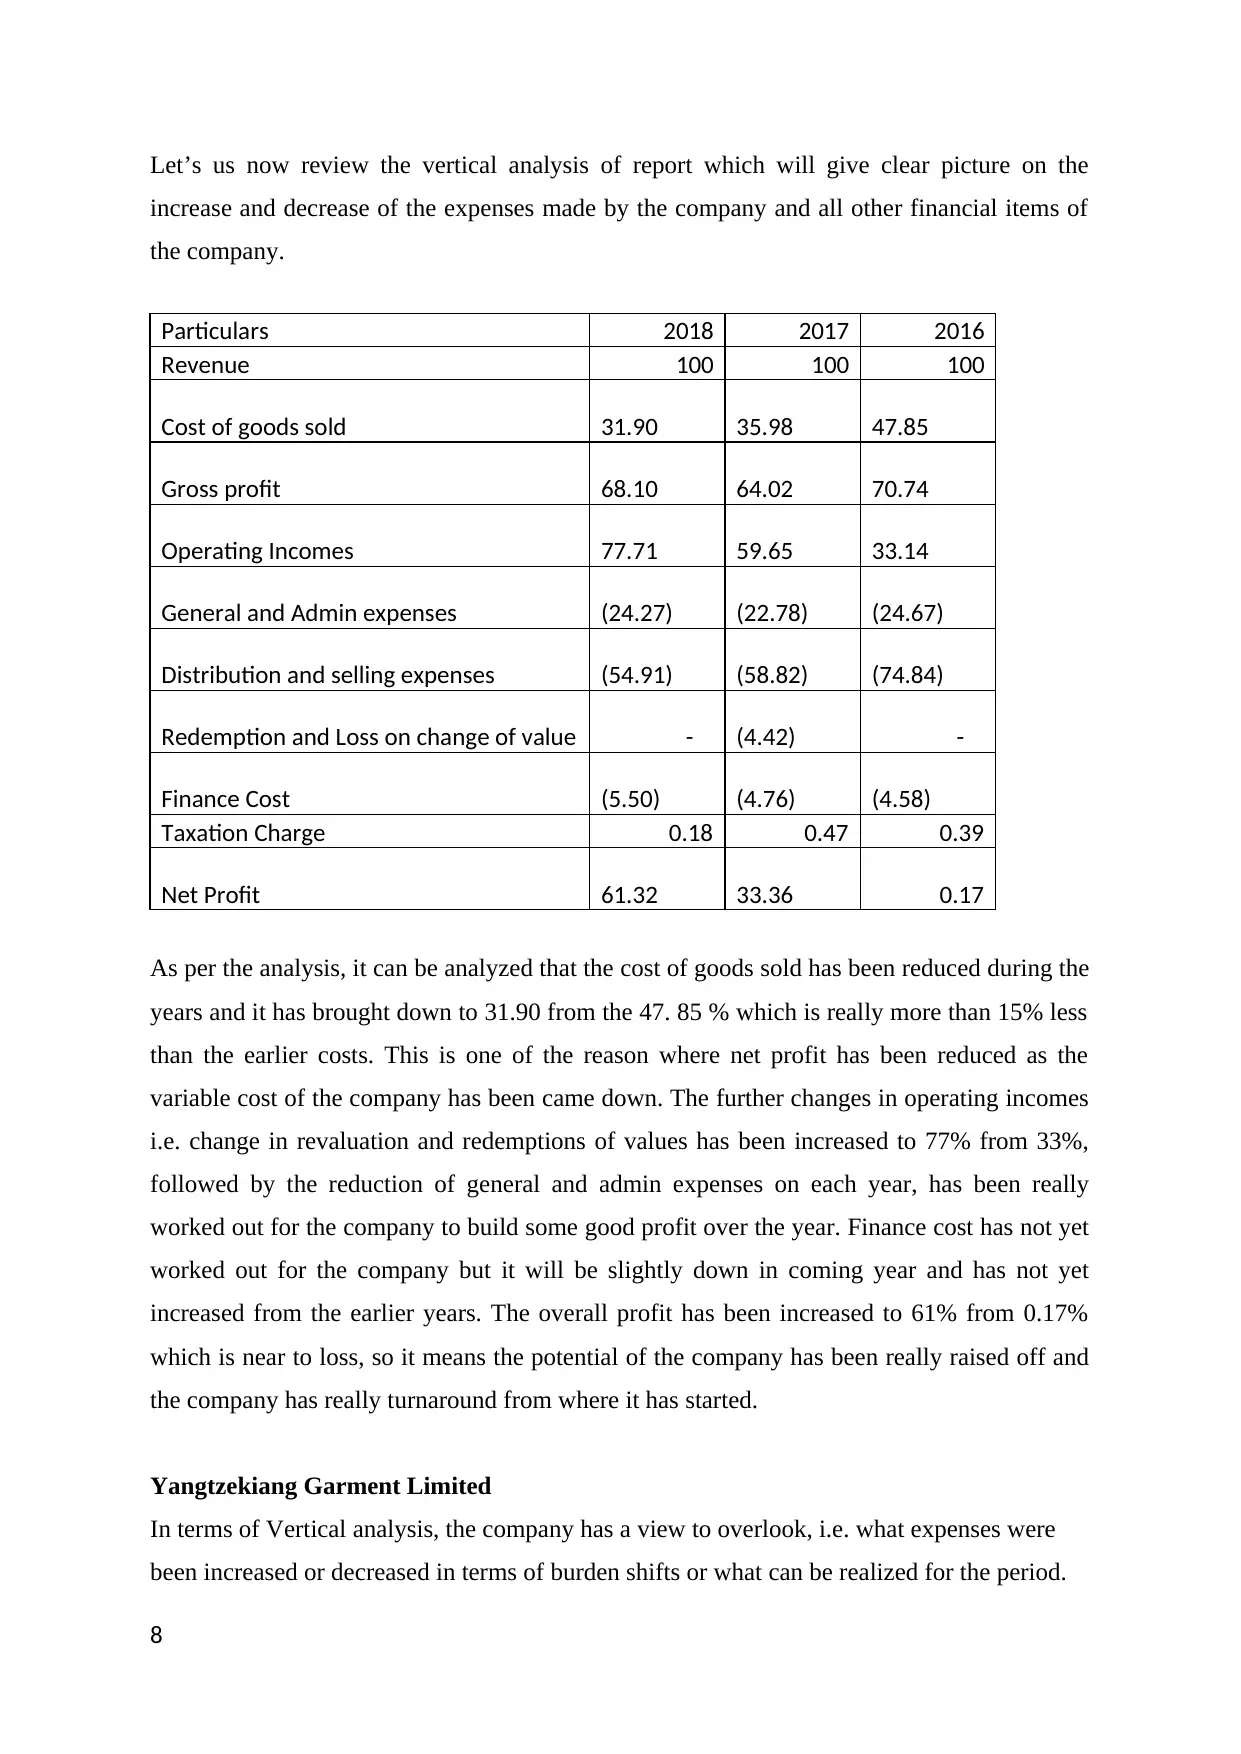
Let’s us now review the vertical analysis of report which will give clear picture on the
increase and decrease of the expenses made by the company and all other financial items of
the company.
Particulars 2018 2017 2016
Revenue 100 100 100
Cost of goods sold 31.90 35.98 47.85
Gross profit 68.10 64.02 70.74
Operating Incomes 77.71 59.65 33.14
General and Admin expenses (24.27) (22.78) (24.67)
Distribution and selling expenses (54.91) (58.82) (74.84)
Redemption and Loss on change of value - (4.42) -
Finance Cost (5.50) (4.76) (4.58)
Taxation Charge 0.18 0.47 0.39
Net Profit 61.32 33.36 0.17
As per the analysis, it can be analyzed that the cost of goods sold has been reduced during the
years and it has brought down to 31.90 from the 47. 85 % which is really more than 15% less
than the earlier costs. This is one of the reason where net profit has been reduced as the
variable cost of the company has been came down. The further changes in operating incomes
i.e. change in revaluation and redemptions of values has been increased to 77% from 33%,
followed by the reduction of general and admin expenses on each year, has been really
worked out for the company to build some good profit over the year. Finance cost has not yet
worked out for the company but it will be slightly down in coming year and has not yet
increased from the earlier years. The overall profit has been increased to 61% from 0.17%
which is near to loss, so it means the potential of the company has been really raised off and
the company has really turnaround from where it has started.
Yangtzekiang Garment Limited
In terms of Vertical analysis, the company has a view to overlook, i.e. what expenses were
been increased or decreased in terms of burden shifts or what can be realized for the period.
8

Particulars
Revenue 100 100 100
Cost of properties sold and services 81.64 82.59 82.49
Gross profit 18.36 17.41 17.51
Operating Incomes 1.45 1.38 0.96
General and Admin expenses (10.37) (10.06) (9.16)
Distribution and selling expenses (7.15) (7.15) (6.83)
Redemption and Loss on change of value 3.70 3.05 (1.31)
Finance Cost (0.34) (0.34) (0.32)
Taxation Charge (0.97) (0.78) (0.39)
Net Profit 4.68 3.50 0.46
It can be reviewed that the net profit has been changed and raised from 0.46 to 4.68%
between the three years. The change has been noticed by a reasons, the gross profit has been
increased in the year 2018 with a slight decrease in the year 2017. Other incomes has also a
few light up but the cost of the company has been increased from 9.16 to 10.37 during the 3
years, in terms of general and admin expenses also there is a increase in selling and
distribution expenses from 6.83 % to 7.15%. Finance cost has a lower impact and has been
noticed lower to 0.34% from 0.32% for the years to 2018. The overall profit has an impact on
the tax charges and has been noticed to 0.97% from the period 0.39%, the reason behind such
change is due to higher proportion of the profit and this has been obtained with reduction of
various expenses, which we can compare with the EasyKnit international where the net profit
has huge bounce back from 2017. So, EasyKnit had a worse business year in 2017 but has
improved their figures in the year 2018. The other impacts on the business in terms of
expenses can also be noticed and can be corrected.
High Fashion International Limited
Further to this the Vertical Analysis can be reviewed and can have following figures and
benchmarking can be done in various ways like:
9
⊘ This is a preview!⊘
Do you want full access?
Subscribe today to unlock all pages.
Trusted by 1+ million students worldwide

Particulars 2018 2017 2016
Revenue 100 100 100
Cost of properties sold and services 81.85 80.79 80.39
Gross profit 18.15 19.21 19.61
Operating Incomes 2.29 4.87 9.75
General and Admin expenses (11.21) (11.97) (15.88)
Distribution and selling expenses (7.09) (7.67) (8.67)
Redemption and Loss on change of value (0.20) (0.02) (0.03)
Finance Cost (0.97) (1.17) (1.27)
Taxation credit (charges) 0.29 (1.68) (1.81)
Net Profit 1.26 1.56 1.70
The net profit ratio in terms of the sales has been reduced from 1.7 to 1.26, the various
aspects of these decrease is increase in finance cost in the year 2018 and cost of goods sold
percentage has been increased in the years more than the sales in respect to the sales
percentage. Further to this the redemption and loss on change of value has been increased
during all these years and thus the profit has been directly hit and these figures has been
reduced. While comparing the figures with the Easyknit international holdings, the profit has
been increased a huge than high fashion international limited but then other several cost were
not reduced in a way that the company. Also, the main component is the increase in sales
revenue which has not been seen as increment.
After the financial report analysis, we can analyze and review the ratio’s of the company and
see how much they are viable to their profitability, to the shareholders, liquidity potential and
solvent for the future payoff.
10
Paraphrase This Document
Need a fresh take? Get an instant paraphrase of this document with our AI Paraphraser

2.3. Operational position:
2018 2017 2016
-
500,000
1,000,000
1,500,000
2,000,000
2,500,000
3,000,000
3,500,000
Revenue
Crocodile Garments Yangtzekiang Garments Limited High Fashion International Limited
As per the operational effort the company has been progressed in the year of 2018 and High
Fashion International limited revenue is higher than their benchmarked companies.
2.4 Ratio Analysis:
Current Assets 636940 413338 438376
Quick Assets 597280 365284 365040
Current Liabilities 714205 469542 457414
Total Debt 969570 738759 741783
Equity 1799591 1638915 1551384
Profitability Ratios:
Gross profit margin 68.10 64.02 59.65
Net profit margin 61.32 33.36 0.15
Gross profit margin of the company illustrates that how much the COGS of the company has
been effectively lower than the higher in revenue. There are two components in determining
the gross profit –
11

a. Revenue : the revenue of the company can be increased on the basis of increase in
volume of the product/services and then increase in the base price or stabilize the
price of the product/services, if these figures are been put into the picture then the
figures for the company can up and then can be extracted to best potential.
b. COGS: the lower the variable cost of the company, there is higher the probability to
increase the profits for the company. The variable costs of the company will then
shows the cost of raw material, processing cost, packing cost and all other direct costs
which are related to the product or the services provided. So, if the COGS is lower
then the gross profit can be at higher side.
During the years the gross profit has been increased to 68.10% in the year 2018. So, higher
the gross profit will give an impact to have a good net profit ratios, subject to higher in the
indirect cost of the company.
Net profit margin, this illustrates that after the gross profit of the company has been identified
then the company will then identify or clarifies what other costs attracts to the development
of the product or services, all these costs then will be indirectly related to the product sales or
services deliver. Further to this, company should noticed that how the indirect costs can go
down and how the cost can be efficiently put upfront and increase the net profit of the
company. In having variance to the subject there can be variance in the strategy but the
indirect costs can always be a factors which can be reduced in higher than any direct related
costs. During the year net profit margin has been raised to 61.32 (2018) from the 33.36%.
There has been huge rise in the profit during the years. The increase and decrease in net profit
will attract the stakeholders to invest into the business and move ahead.
Market Ratios:
Earnings per share 17.15 9.3 0.05
Market Ratio also has a segment which illustrates that how much a company will repay as a
return to the shareholders on the investment made by them. The EPS will be covering the
amount which is an outcome from the business and that amount will be divided and send to
the shareholders as the amount of return. So, as the EPS will increase the attraction for the
shareholders will also increase and potential to increase the market price of the company.
Further to this, the company EPS has been increased drastically from 0.05 in the year 2016 to
12
⊘ This is a preview!⊘
Do you want full access?
Subscribe today to unlock all pages.
Trusted by 1+ million students worldwide
1 out of 19
Related Documents


Your All-in-One AI-Powered Toolkit for Academic Success.
+13062052269
info@desklib.com
Available 24*7 on WhatsApp / Email
![[object Object]](/_next/static/media/star-bottom.7253800d.svg)
Unlock your academic potential
Copyright © 2020–2026 A2Z Services. All Rights Reserved. Developed and managed by ZUCOL.