Business Intelligence Dashboard: Environmental Issues Analysis Report
VerifiedAdded on 2023/03/17
|27
|4484
|39
Project
AI Summary
This project addresses environmental problems using Business Intelligence (BI) tools and data analysis. The project begins with an executive summary and introduction that outlines the environmental challenges such as climate change, pollution, and resource depletion. The project aims to use SAP analysis, specifically descriptive and prescriptive analysis, to evaluate data and develop a dashboard for visualizing environmental issues. The project includes the design of a mobile application and a justification of BI reporting solutions for reducing environmental problems. The report explores the impact of CO2 on the environment and discusses the importance of energy consumption and the use of solar energy. The project utilizes BI reporting solutions, including descriptive and prescriptive analysis, to provide insights and recommendations for addressing environmental concerns. Finally, the project explores the design of a mobile application and offers insights on BI reporting for reducing environmental issues and concludes with recommendations.

Paraphrase This Document
Need a fresh take? Get an instant paraphrase of this document with our AI Paraphraser
Executive Summary
Our planet, Earth has been facing lot of atrocities in the form of environmental
problems and in this project we shall be making use of Business intelligence device
like Dashboard to help in addressing this issue. Use of SAP analysis on the collected
datasets like Descriptive analysis and Prescriptive analysis is utilised to study and
evaluating this information. Developing of a design model application is carried out
and then with the guidance of the Dashboard, the evaluation of the problems
concerning the environmental problems is displayed.
Finally we shall discus all the above points and present our report related to
Business intelligence Reporting and usage of Dashboard.
Table of Contents
1. Introduction................................................................................................................................1
1.1 Problem Statement...........................................................................................................2
1.2 Objectives...........................................................................................................................2
1.3 Environmental Issues......................................................................................................2
1.4 Impact of CO2 Use on Environment.............................................................................3
2. Business Intelligence Reporting Solution with the help of Analytics..........................5
2.1 Descriptive Analysis........................................................................................................6
2.1.1 Dashboard..................................................................................................................6
2.1.2 SAP Analysis..............................................................................................................8
2.2 Prescriptive Analysis.......................................................................................................8
2.2.1 Dashboard..................................................................................................................9
2.2.2 SAP Analysis..............................................................................................................9
2.3 Dashboard Prototype.....................................................................................................10
3. Design of a Mobile Application...........................................................................................11
4. BI Reporting Solutions Justified for Reducing Environmental issues......................13
5. Conclusion...............................................................................................................................15
References.......................................................................................................................................16
⊘ This is a preview!⊘
Do you want full access?
Subscribe today to unlock all pages.
Trusted by 1+ million students worldwide

Paraphrase This Document
Need a fresh take? Get an instant paraphrase of this document with our AI Paraphraser
1. Introduction
Business Intelligence (BI) tools are variety of different application software for
finding the way of collecting information/ data for finding information basically by, to
collect and analyse huge volumes of unstructured data from internal/ external
systems. For preparing reports, dashboards and data visualisations, these given
tools also aid in creating the data for evaluation. Aimed for the business users, SAP
BIis is a reporting and analytics business intelligence (BI) platform. Creating and
making reports that look into the insights, this also consists of a number of reporting
applications that allow users to discover data, perform analysis to derive insights.
SAP BI tools are a great boon specially when handling huge amount of data,
by using and identifying patterns formed, to make smart decisions and effective
strategy for any and all types of settings, without the size or the complexities factor.
This helps to discover data, see the insights of the data, helps to solve the
identified issues and same time predict forecasts (Guru99.com, 2019). The benefits
of using this tool are,
Analysis and reporting
Data visualisation and analytics applications
Office integration
Mobile analytics.
Now after the studies and research regarding the concerns to the Environmental, the
following were the factors affecting it,
Depletion of ozone layer
Shortage of water
Changes in environmental climate
1
Air/ Water pollution
Deforestation
Rapid Urbanisation
High energy consumption
Over population
Danger signs are already there regarding concerns to human life as the ill effects of
changes in the environment, which has been causing release of Greenhouse gases
and overall increase in Global Warming and catastrophic climate changing
conditions.
With the assistance of the Dashboard we shall highlight all these problems and their
solutions for improvement of our Environment, planet and finally our lives.
1.1 Problem Statement
Climate change, pollution, environmental degradation, and resource depletion etc
are some of the major present environmental problems faced by earth. Protection of
endangered species, protection of any ecologically valuable natural areas,
genetically modified foods and global warming are some of the topics that the
conservation movement lobbies are fighting for. And from all these, the biggest
environmental risk facing us is Weather Change and Global warming.
Human activities have destroyed the environment in a very rapid and uncontrollable
rate which is not only affecting the weather, climate but also endangering the lives of
many species.
.
Everyday there are numerous issues creeping in as the activities tend to increase
and repeat. These activities have kept on intensifying and causing severe damage.
One of the major influences to these activities is the wide climatic conditions being
observed. The severity of weather change, more severe weather like storms,
2
⊘ This is a preview!⊘
Do you want full access?
Subscribe today to unlock all pages.
Trusted by 1+ million students worldwide
cyclones, torrential rainfall, drought, typhoons, etc are the by-products of this
changes taking place in the environment.
We have to face the reality that we are the reason and the cause of all this
catastrophes that is taking place all over the world. These have been doing more
damage and destruction than the natural catastrophes. And sooner we realise this
fact, the better it will be for the future of mankind.
Our project aims to identify the solutions to these problems and with the iad of
business tolls like Dashboard, highlight the answers to these problems.
Objectives
The following are the objectives of this project:
1) To know the causes of carbon dioxide and its impact on the
environment.
2) To resolve energy consumption issue.
3) To perform descriptive analysis
4) To perform prescriptive analysis (Data.worldbank.org, 2019).
5) To design a predictive analytical application.
1.2 Environmental Issues
With Global warming being the hot topic of discussion and research around the
globe, we tend to forget the other factors that are contributing to the decline of
environment around the planet. Research has shown that many other factors are
influencing the damages to the environment and these too have to be studied and
answers sought out for. Thought Climate change has been occurring largely to the
global warming threat, there are factors that are the basic cause for this. And one of
the major contributors to this influence is the high energy consumption around the
3
Paraphrase This Document
Need a fresh take? Get an instant paraphrase of this document with our AI Paraphraser
globe. An environmental impact on our air, water and land, is due to the high usage
of electricity. The amount of fuel needed to generate electricity and the amount of
greenhouse gases and other air pollution emitted all are minimized and reduced
when, producing and using electricity more efficiently. The burning of these fossil
fuels puts tons of C02 in the atmosphere which leads to Global Warming and also by
making use of excessive amount of energy from sources like fossil fuel, biomass,
and waste burning power plants. Negative effects on the environment are caused
with additional impact on human health cause of tall these combustion products.
Adding to the woes of the Greenhouse effect is the emission of CO2 gas. Harmful to
plants and to animals that live in water is the acid rain caused by the SO2 gas in the
atmosphere. This is leading to catastrophic proportions on planet earth.
Financesonline.com, 2019).
A sustained and systematic planning and execution is required from everyone, right
from the nations, governments, organizations, firms, the business community,
families and lastly us, individuals to contribute and reverse this trend. This is the
outcome of many years and decades of abuse and it won’t be stopped or reversed in
an instant. A Collective effort is required to make a powerful impact and change.
Spreading Awareness and letting everyone know about the influences via media,
propaganda channels etc to make sure that the message has been passed well and
understood by everyone that it is our life and our future that we are taking this risk
with.
1.3 Impact of CO2 Use on Environment
CO2 gases impact on the environment is vast and huge including, air pollution,
emission effects etc which is impacting the weather changes. According to studies
4
done by the National Oceanic and Atmospheric Administration (NOAA), the surface
temperature of earth has risen over the last 100 years. CO2 gas is the prime culprit
in this case as per experts even though the effects of this are far more complex.
Resulting in a loss of shoreline and coastal wetlands, evidence finds that ocean
water levels have been steadily increasing, plants and leaf pores shrink as CO2
levels are rising, less cooling power of tree’s as less water is released etc. Knowing
well the ill effects of CO2 gas emissions in the environment, still we have been
releasing an uncontrolled amount of CO2 gas in the atmosphere. This is especially
true for the last few decades and harming the climatic conditions to irreversible
levels. Thus we can clearly observe the damaging effects of environmental CO2
emissions. Fossil fuels release CO2 gas and this continues with the use of auto
vehicles, electricity usage, machinery, factories etc and this is in addition to other
waste gases released during combustion. With the ever increasing population on the
planet, resources are diminishing and in reverse these dangerous gases are
multiplying to unimaginable amount.
We can observe the various energy types’ contribution to the world energy usage in
the pie diagram below.
Other types of energy sources, other than natural fossil fuels, also contribute
(directly or indirectly) to the quantity of CO2 emissions to the environment. This
includes nuclear energy, biomass energy etc. Hydro energy, solar energy, wind
energy etc are the type of renewable energies required ("Energy Use and the
Environment", 2019).
5
⊘ This is a preview!⊘
Do you want full access?
Subscribe today to unlock all pages.
Trusted by 1+ million students worldwide
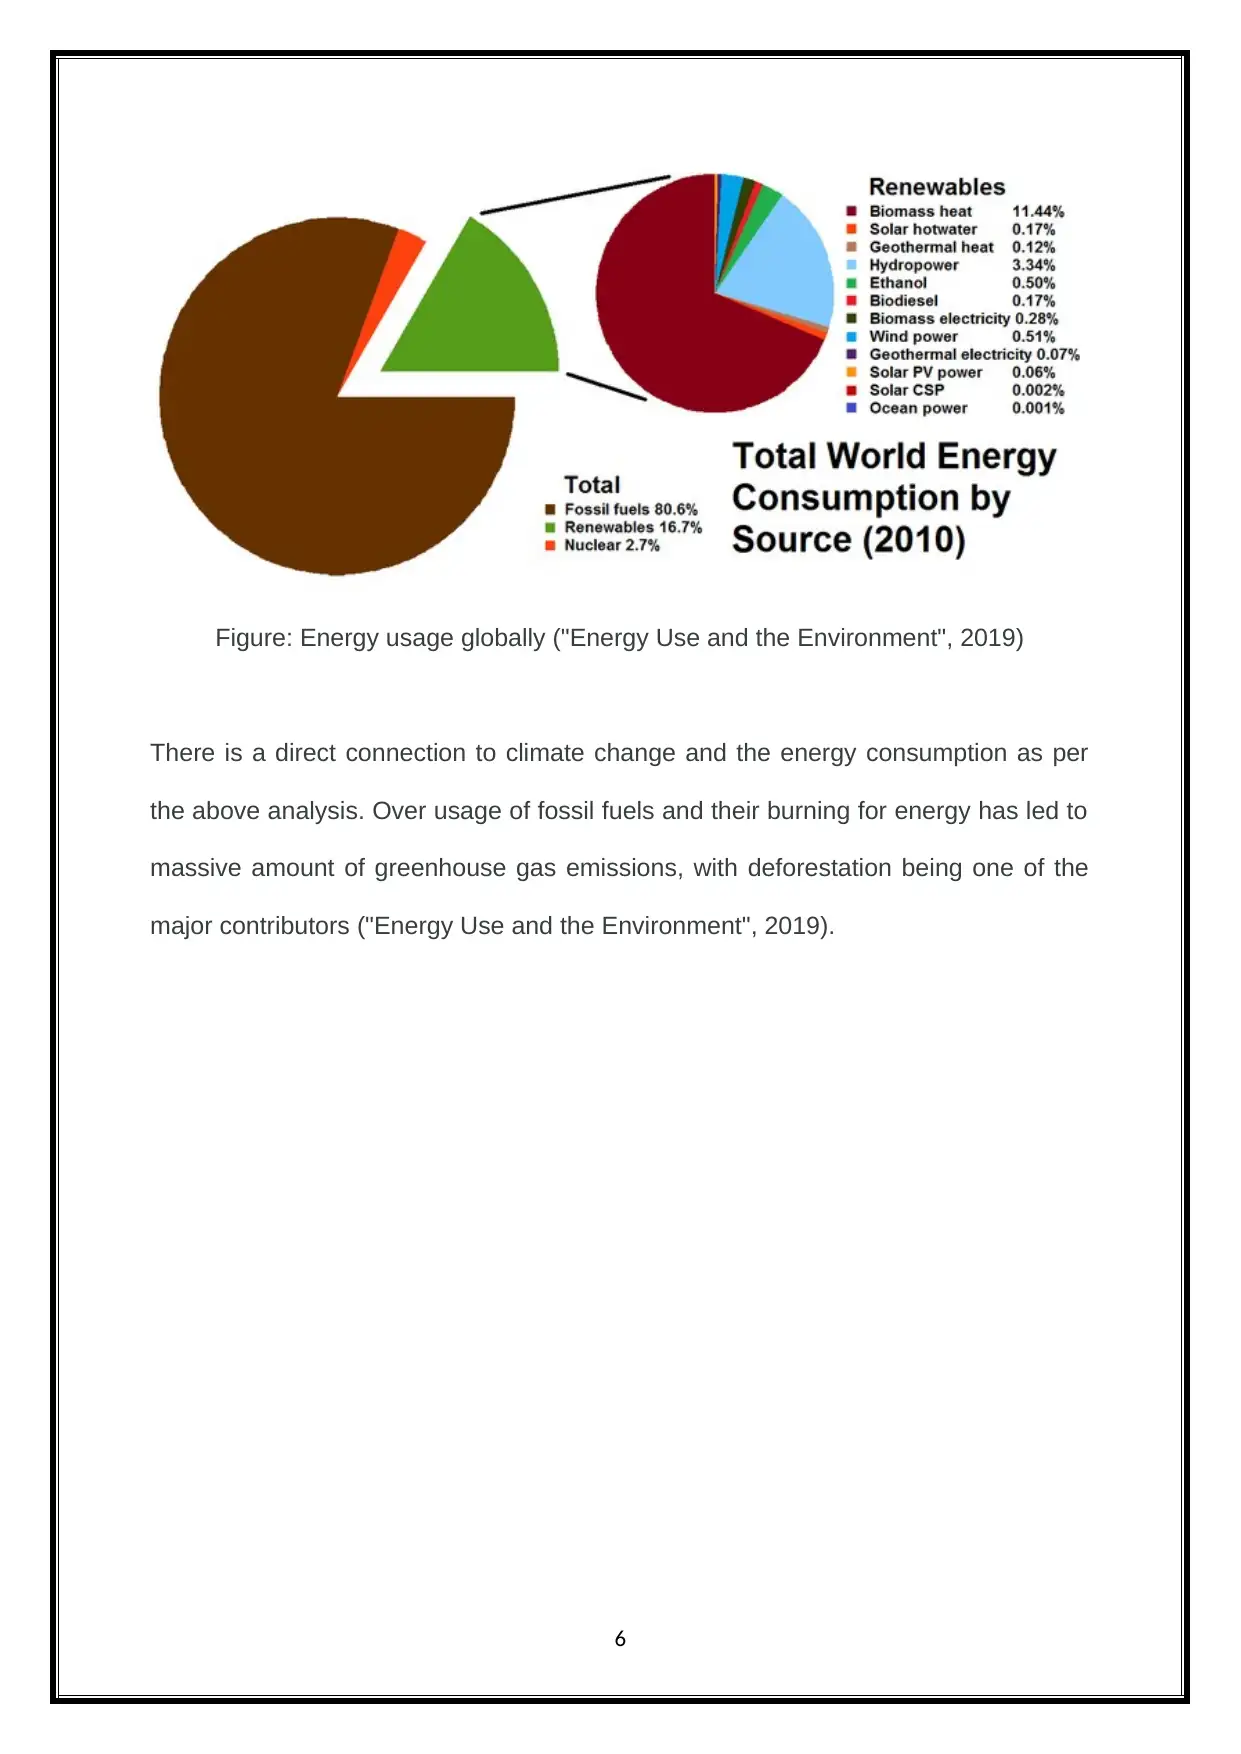
Figure: Energy usage globally ("Energy Use and the Environment", 2019)
There is a direct connection to climate change and the energy consumption as per
the above analysis. Over usage of fossil fuels and their burning for energy has led to
massive amount of greenhouse gas emissions, with deforestation being one of the
major contributors ("Energy Use and the Environment", 2019).
6
Paraphrase This Document
Need a fresh take? Get an instant paraphrase of this document with our AI Paraphraser
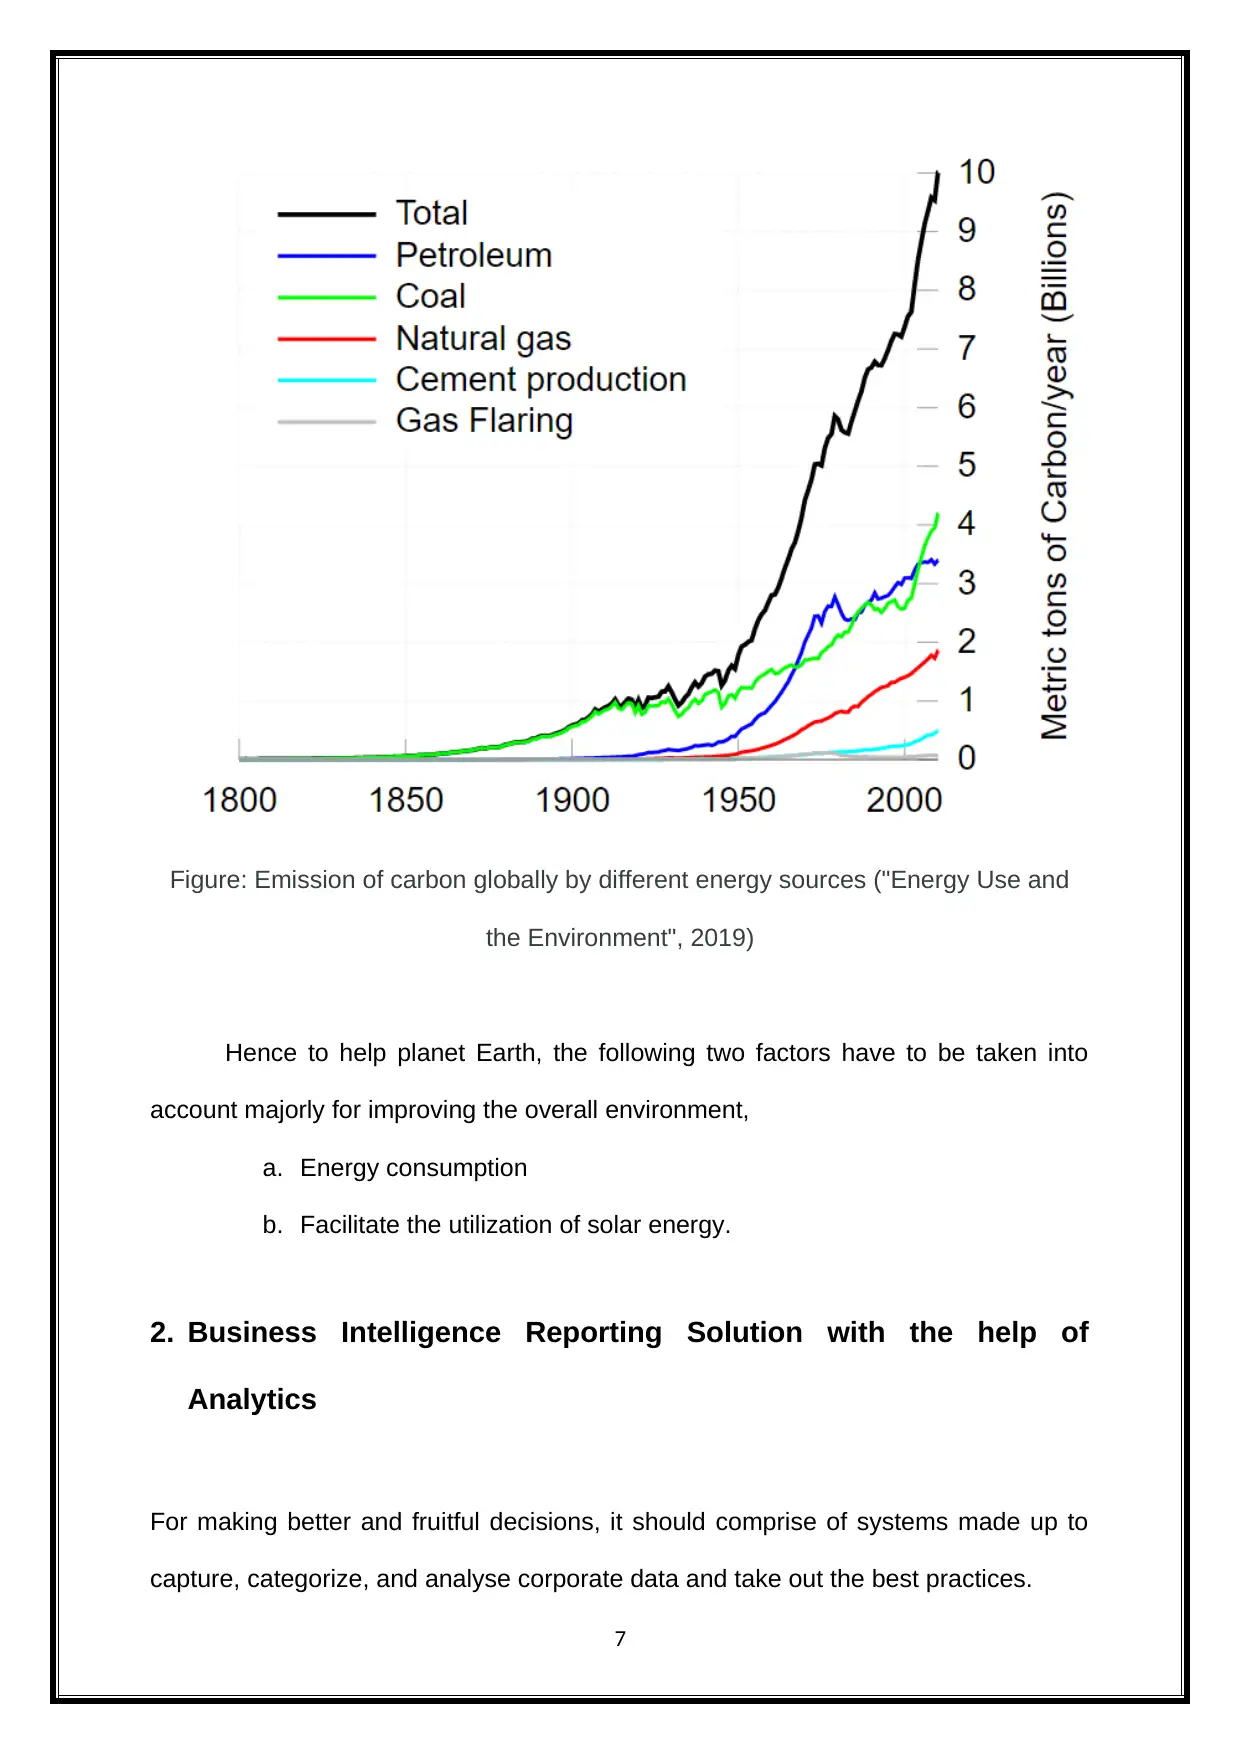
Figure: Emission of carbon globally by different energy sources ("Energy Use and
the Environment", 2019)
Hence to help planet Earth, the following two factors have to be taken into
account majorly for improving the overall environment,
a. Energy consumption
b. Facilitate the utilization of solar energy.
2. Business Intelligence Reporting Solution with the help of
Analytics
For making better and fruitful decisions, it should comprise of systems made up to
capture, categorize, and analyse corporate data and take out the best practices.
7
Making use of more data set sources, involving, including internal metrics converging
from various company areas, and external data extracted from third-party systems,
social media channels, emails, or even macroeconomic data for the more advanced
Business Intelligence Tools. Assisting companies and firms to gain insight on their
overall growth, sales trends, and customer behaviour, are the optimal business
intelligence software’s. Giving support via cloud deployment, mobile platforms,
applications, BI analysis assists the users to assess the data and the analysis
methodology anywhere they are comfortable to use them. Graphic user friendly
display, data markers, key parameters etc are all used for assisting in decision
making.
External/ Internal sources are used for collecting, generating, filtering , applying
parameters, for generating queries and executing them, preparing reports and finally
displaying the results on the dashboard for the user to make final decisions.
A data management tool that checks, evaluates, controls, and gives a visual
output for the prime business metrics while letting the users to interact with data,
letting them to develop a well-informed, data-driven, and healthy business decisions,
is the tool which we call as Dashboard. These are made use with various business
intelligence (BI) environment, making links between managers and the company’s
strategy, allowing various areas to collaborate more efficiently, and letting employees
to perform with an increased productivity level. To reply the critical business
questions on-demand with the latest up-to-date data with interactive analysis
empowers users. Various perspectives and point of views with just a few clicks is the
additional advantage where data can be checked, with facilities like zooming-in/out,
detailing time intervals, filtering countries or show and hide specific parameters.
8
⊘ This is a preview!⊘
Do you want full access?
Subscribe today to unlock all pages.
Trusted by 1+ million students worldwide
1 out of 27
Related Documents


Your All-in-One AI-Powered Toolkit for Academic Success.
+13062052269
info@desklib.com
Available 24*7 on WhatsApp / Email
![[object Object]](/_next/static/media/star-bottom.7253800d.svg)
Unlock your academic potential
Copyright © 2020–2026 A2Z Services. All Rights Reserved. Developed and managed by ZUCOL.