Comprehensive Financial Analysis Report: BHP Billiton (2017-2018)
VerifiedAdded on 2023/01/11
|3
|1377
|23
Report
AI Summary
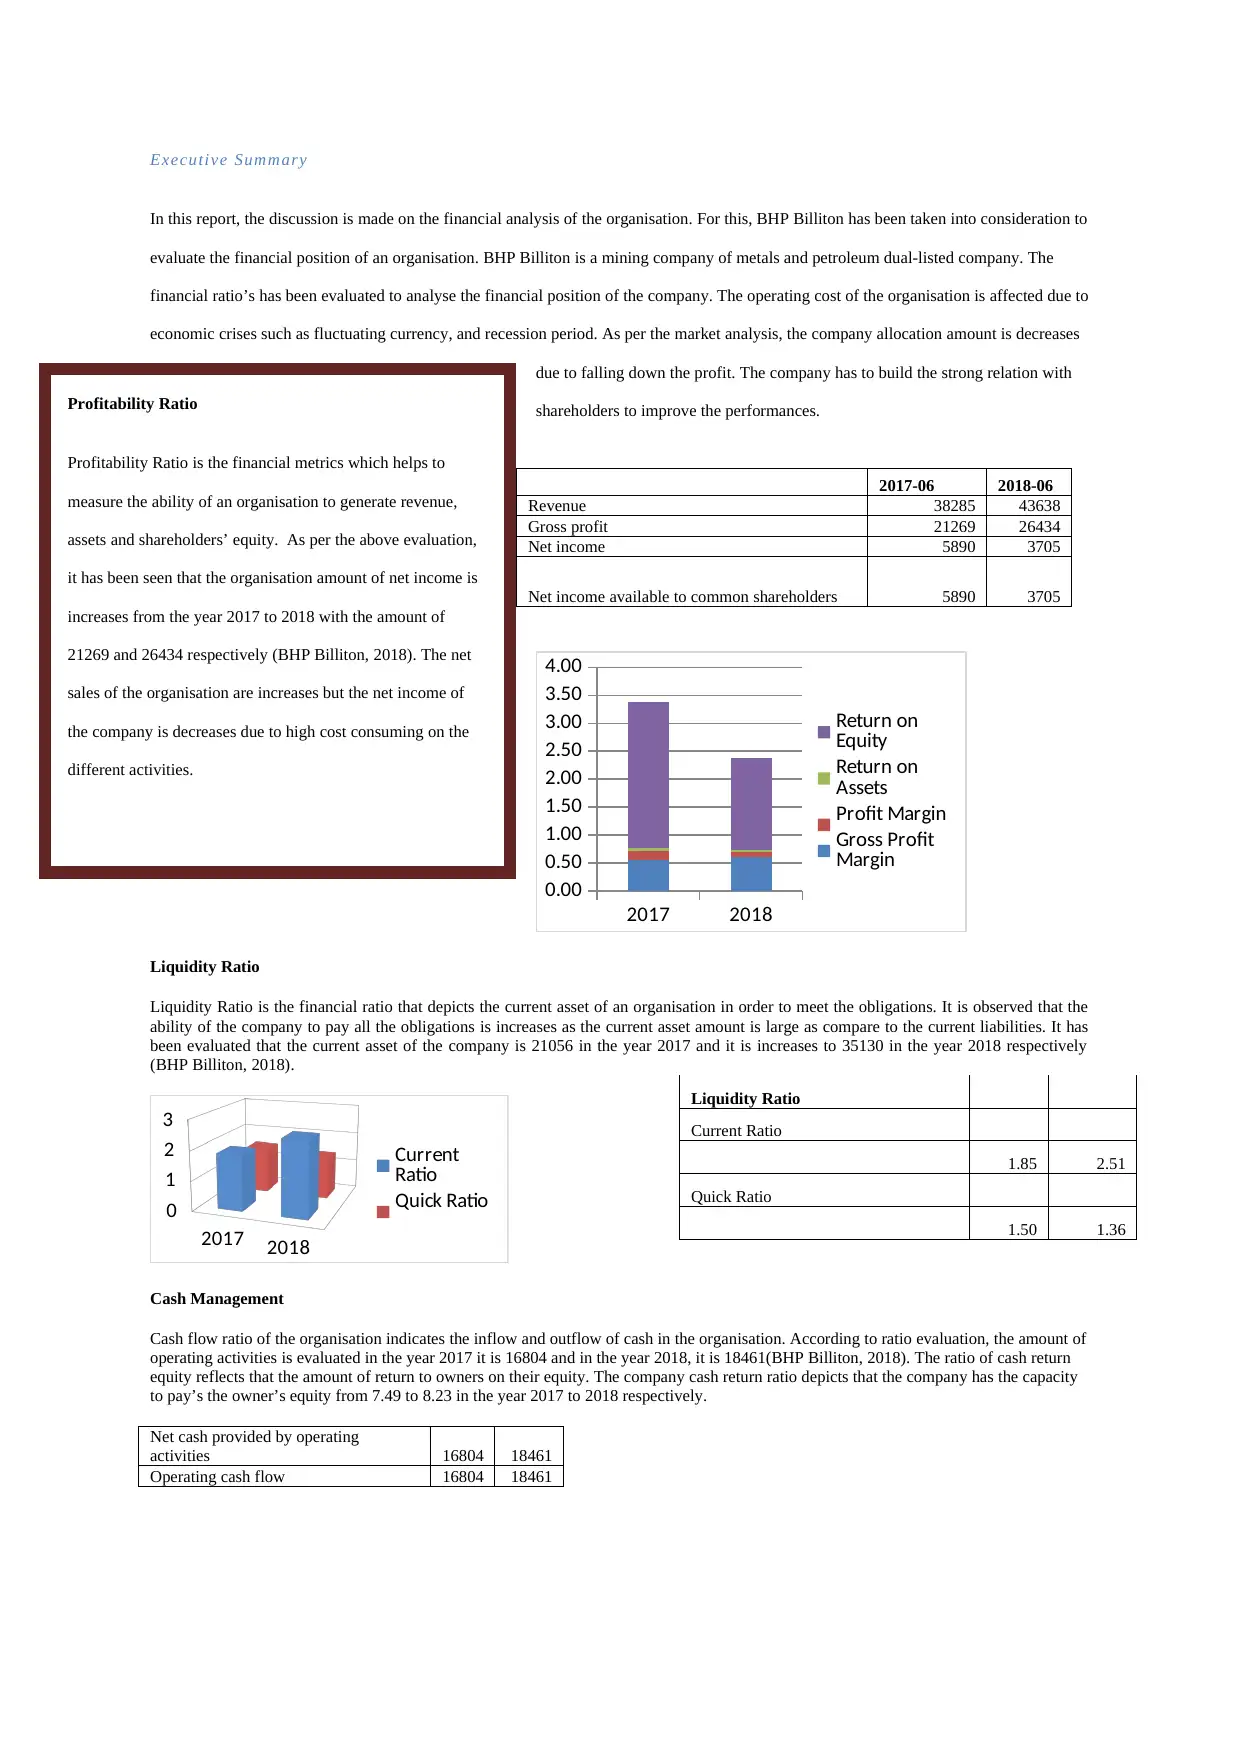
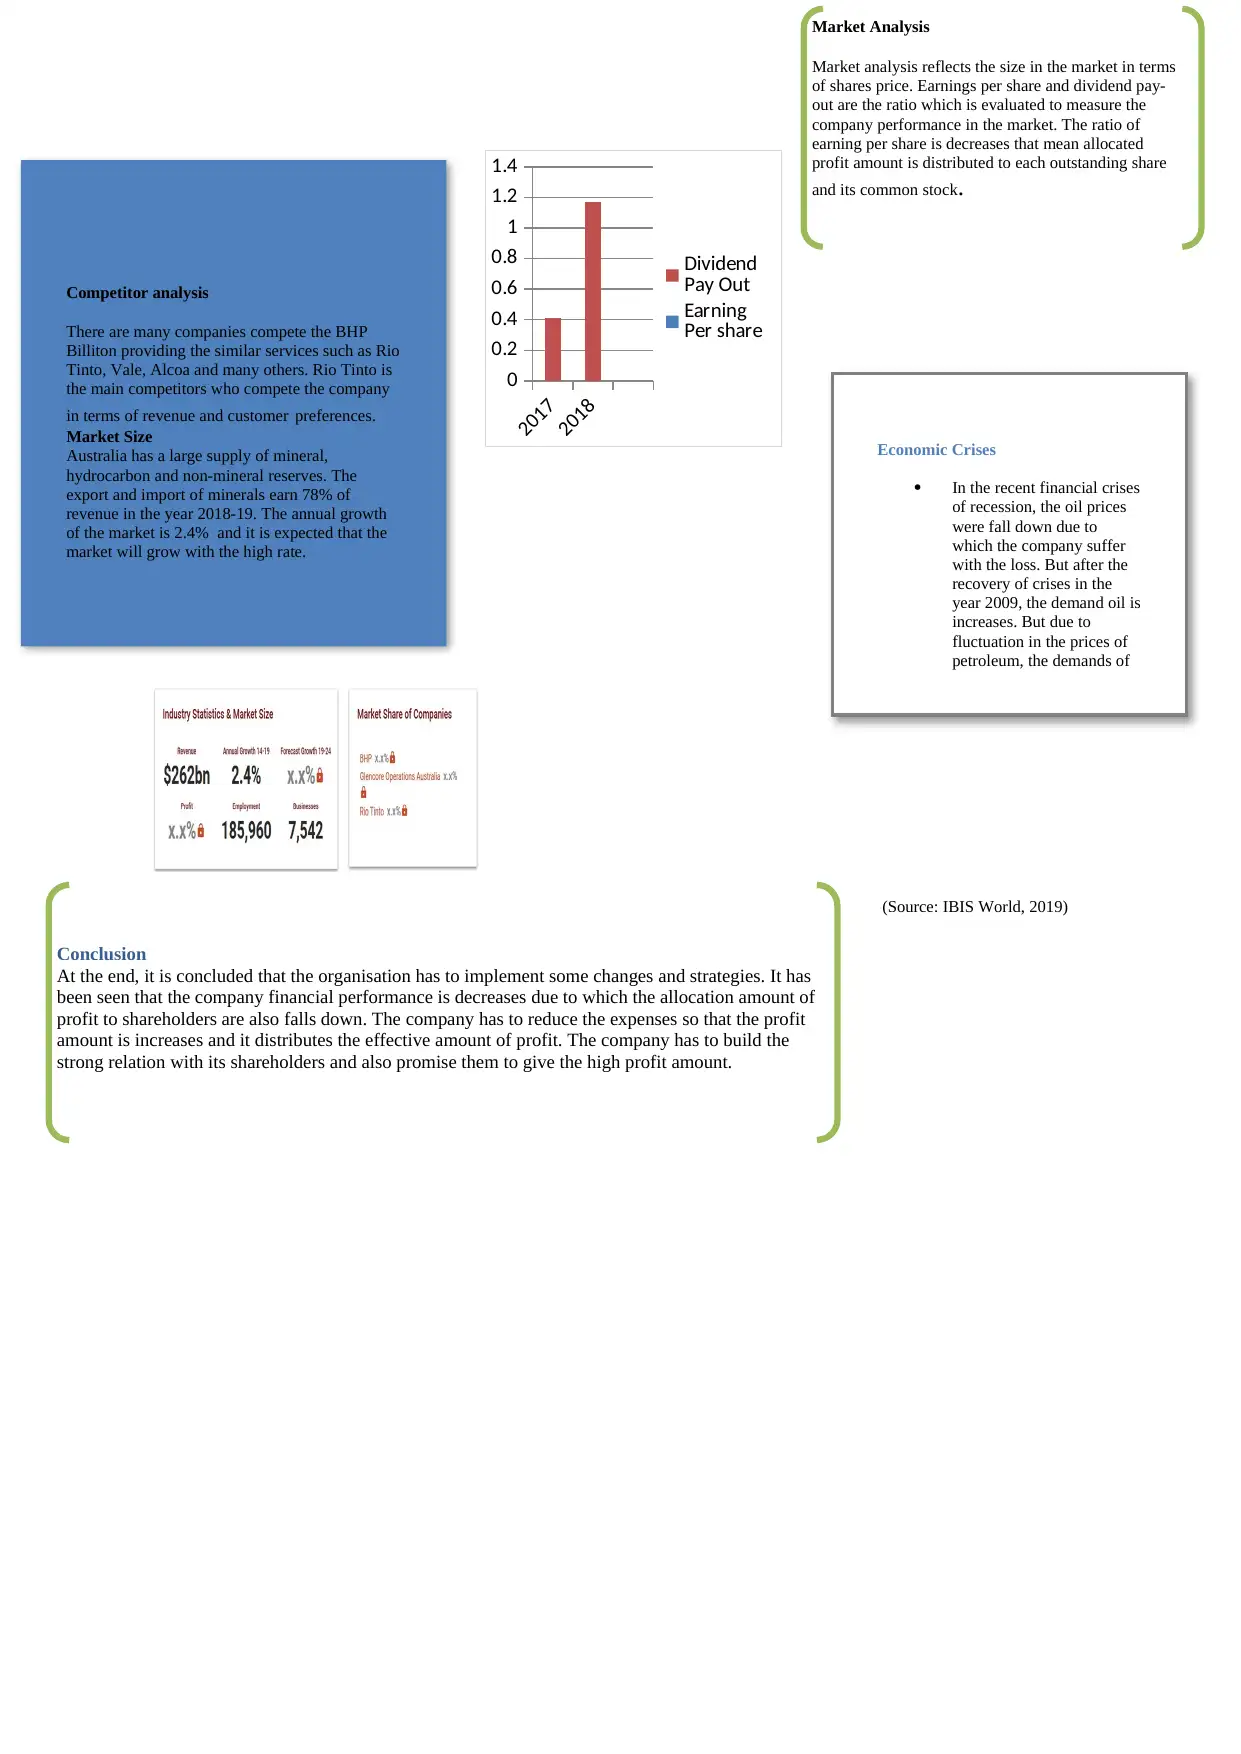
This report presents a financial analysis of BHP Billiton, examining its performance from 2017 to 2018. It evaluates key financial metrics such as profitability ratios (net income, gross profit), liquidity ratios (current and quick ratios), and cash management. The analysis highlights trends in revenue, operating costs, and net income, noting the impact of economic crises like fluctuating currency and recession. The report also includes market analysis, competitor analysis (Rio Tinto, Vale, Alcoa), and the company's market size in Australia. It concludes with recommendations for strategic improvements, focusing on cost reduction and strengthening shareholder relations. The report references BHP Billiton's annual reports, CSI Market, IBIS World, and other sources to support its findings.
1 out of 3
Related Documents


Your All-in-One AI-Powered Toolkit for Academic Success.
+13062052269
info@desklib.com
Available 24*7 on WhatsApp / Email
![[object Object]](/_next/static/media/star-bottom.7253800d.svg)
Copyright © 2020–2026 A2Z Services. All Rights Reserved. Developed and managed by ZUCOL.