Statistics 101: Hypothesis Testing and Statistical Analysis Assignment
VerifiedAdded on 2020/04/15
|53
|8860
|745
Homework Assignment
AI Summary
This assignment covers various concepts in hypothesis testing, including formulating null hypotheses, understanding p-values, and interpreting statistical significance. The solutions address questions on one-tailed and two-tailed tests, Type I and Type II errors, and the application of t-tests. Examples include testing differences between means, analyzing correlational studies, and determining the effectiveness of interventions. The document provides step-by-step solutions to problems involving sample means, significance levels, and the interpretation of statistical results. The assignment also delves into the assumptions underlying statistical tests and the importance of controlling for familywise error rates in multiple comparisons. It covers the analysis of variance (ANOVA) and the use of post-hoc tests like Tukey HSD to determine group differences.
Exercise 11:
1. An experiment is conducted to test the claim that James Bond can taste the difference
between a Martini that is shaken and one that is stirred. What is the null hypothesis?
Solution
Null hypothesis (H0) is that James Bond cannot taste the difference between a Martini
that is shaken and one that is stirred.
2. The following explanation is incorrect. What three words should be added to make it
correct?
The probability value is the probability of obtaining a statistic as different (or more
different/extreme) from the parameter specified in the null hypothesis as the statistic
obtained in the experiment. The probability value is computed assuming that the null
hypothesis is true.
3. Why do experimenters test hypotheses they think are false?
Solution
To establish directionality.
To place the burden of proof on the alternative
4. State the null hypothesis for:
a. An experiment testing whether echinacea decreases the length of colds.
Solution
H0: Echinacea does not have an effect on the length of colds
b. A correlational study on the relationship between brain size and intelligence.
Solution
H0: Brain size is not correlated with intelligence (H0 :r=0¿
Paraphrase This Document
Need a fresh take? Get an instant paraphrase of this document with our AI Paraphraser
c. An investigation of whether a self-proclaimed psychic can predict the outcome of a
coin flip.
Solution
H0: Self-proclaimed psychic cannot predict the outcome of a coin flip
d. A study comparing a drug with a placebo on the amount of pain relief. (A one tailed
test was used).
Solution
H0: There is no difference in the amount of pain relief by placebo and drug.
5. Assume the null hypothesis is that μ = 50 and that the graph shown below is the sampling
distribution of the mean (M). Would a sample value of M= 60 be significant in a two-
tailed test at the .05 level? Roughly what value of M would be needed to be significant?
Solution
Yes a sample of M = 60 would be significant in a two-tailed test at the 0.05 level.
Roughly the M value should be less than or equal to 40 or greater than or equal to 60.
6. A researcher develops a new theory that predicts that vegetarians will have more of a
particular vitamin in their blood than non-vegetarians. An experiment is conducted and
vegetarians do have more of the vitamin, but the difference is not significant. The
probability value is 0.13. Should the experimenter's confidence in the theory increase,
decrease, or stay the same?
Solution
His confidence should increase that the null hypothesis is false
7. A researcher hypothesizes that the lowering in cholesterol associated with weight loss is
really due to exercise. To test this, the researcher carefully controls for exercise while
comparing the cholesterol levels of a group of subjects who lose weight by dieting with a
control group that does not diet. The difference between groups in cholesterol is not
significant. Can the researcher claim that weight loss has no effect?
Solution
The researcher cannot claim that weight loss has no effect, only that the data do not
support the hypothesis.
8. A significance test is performed and p = .20. Why can't the experimenter claim that the
probability that the null hypothesis is true is .20?
Solution
The p-value just indicates the probability of obtaining a particular statistic only (where in
this case, a proportion) from the sample data under the assumption that the null
hypothesis is true. This is NEVER the same as saying the probability of the null
hypothesis being true is.20.
9. For a drug to be approved by the FDA, the drug must be shown to be safe and effective.
If the drug is significantly more effective than a placebo, then the drug is deemed
effective. What do you know about the effectiveness of a drug once it has been approved
by the FDA (assuming that there has not been a Type I error)?
Solution
⊘ This is a preview!⊘
Do you want full access?
Subscribe today to unlock all pages.
Trusted by 1+ million students worldwide
10. When is it valid to use a one-tailed test? What is the advantage of a one-tailed test? Give
an example of a null hypothesis that would be tested by a one-tailed test.
Solution
Advantage of a one-tailed test
The advantage of adopting the one-tailed test is an improvement in power to reject the
null hypothesis if the null hypothesis is truly false.
Example;
Null hypothesis (H0): The average weight of students is less than 60 kilograms (i.e.
H0 : μ<60 ¿ .
11. Distinguish between probability value and significance level.
Solution
The probability value (also called the p-value) is the probability of the observed result
found in your research study of occurring (or an even more extreme result occurring),
under the assumption that the null hypothesis is true (i.e., if the null were true). On the
other hand, the significance level (also called the alpha level) is the cutoff value the
researcher selects and then uses to decide when to reject the null hypothesis.
12. Suppose a study was conducted on the effectiveness of a class on "How to take tests."
The SAT scores of an experimental group and a control group were compared. (There
were 100 subjects in each group.) The mean score of the experimental group was 503 and
Paraphrase This Document
Need a fresh take? Get an instant paraphrase of this document with our AI Paraphraser
the mean score of the control group was 499. The difference between means was found to
be significant, p = .037. What do you conclude about the effectiveness of the class?
Solution
If you set alpha =.05: There is sufficient evidence to reject the null hypothesis that there
is no difference between the groups, since p<.05. There is a significant difference
between the mean score of the groups.
13. Is it more conservative to use an alpha level of .01 or an alpha level of .05? Would beta
be higher for an alpha of .05 or for an alpha of .01?
Solution
Choosing a lower significance level, alpha, is more conservative in that you are less
likely to reject the null hypothesis when it is true. Generally, in biostatistics applications,
making a type I error (e.g. declaring a new treatment beneficial when in truth it is not) is
more serious than making a type II error (e.g. failing to show the benefit of a new
treatment, even though it has some benefit). There is a trade-off between error rates--
lower alpha will increase beta.
14. Why is "Ho: "M1 = M2" not a proper null hypothesis?
Solution
The null hypothesis to be formulated should state that there is NO significant difference
between M1 and M2
15. An experimenter expects an effect to come out in a certain direction. Is this sufficient
basis for using a one-tailed test? Why or why not?
Solution
Not really. We need not to care about effects in the opposite direction. Just because we
think something will go one way or another is different.
16. How do the Type I and Type II error rates of one-tailed and two-tailed tests differ?
Solution
One-tailed tests have lower Type II error rates and more power than do two-tailed
tests
17. A two-tailed probability is .03. What is the one-tailed probability if the effect were in the
specified direction? What would it be if the effect were in the other direction?
Solution
The one-tailed probability if the effect were in the specified direction would be 0.015.
The probability would however be 0.985 if the effect were in the other direction.
18. You choose an alpha level of .01 and then analyze your data.
(a) What is the probability that you will make a Type I error given that the
null hypothesis is true?
Solution
⊘ This is a preview!⊘
Do you want full access?
Subscribe today to unlock all pages.
Trusted by 1+ million students worldwide
The probability of type I error is actually alpha given that the null
hypothesis is true so it is .01
(b) What is the probability that you will make a Type I error given that the
null hypothesis is false?
Solution
When null hypothesis is false, it is impossible to make a type I error. It
means probability that you will make a type I error given the null
hypothesis is false is zero
19. Why doesn't it make sense to test the hypothesis that the sample mean is 42?
Solution
Hypothesis tests must be about parameters, not sample statistics
20. True/false: It is easier to reject the null hypothesis if the researcher uses a smaller
alpha (α) level.
Solution
False
21. True/false: You are more likely to make a Type I error when using a small sample than
when using a large sample.
Solution
Paraphrase This Document
Need a fresh take? Get an instant paraphrase of this document with our AI Paraphraser
False
22. True/false: You accept the alternative hypothesis when you reject the null hypothesis.
Solution
True
23. True/false: You do not accept the null hypothesis when you fail to reject it.
Solution
False
24. True/false: A researcher risks making a Type I error any time the null hypothesis is
rejected.
Solution
True
Exercise 12:
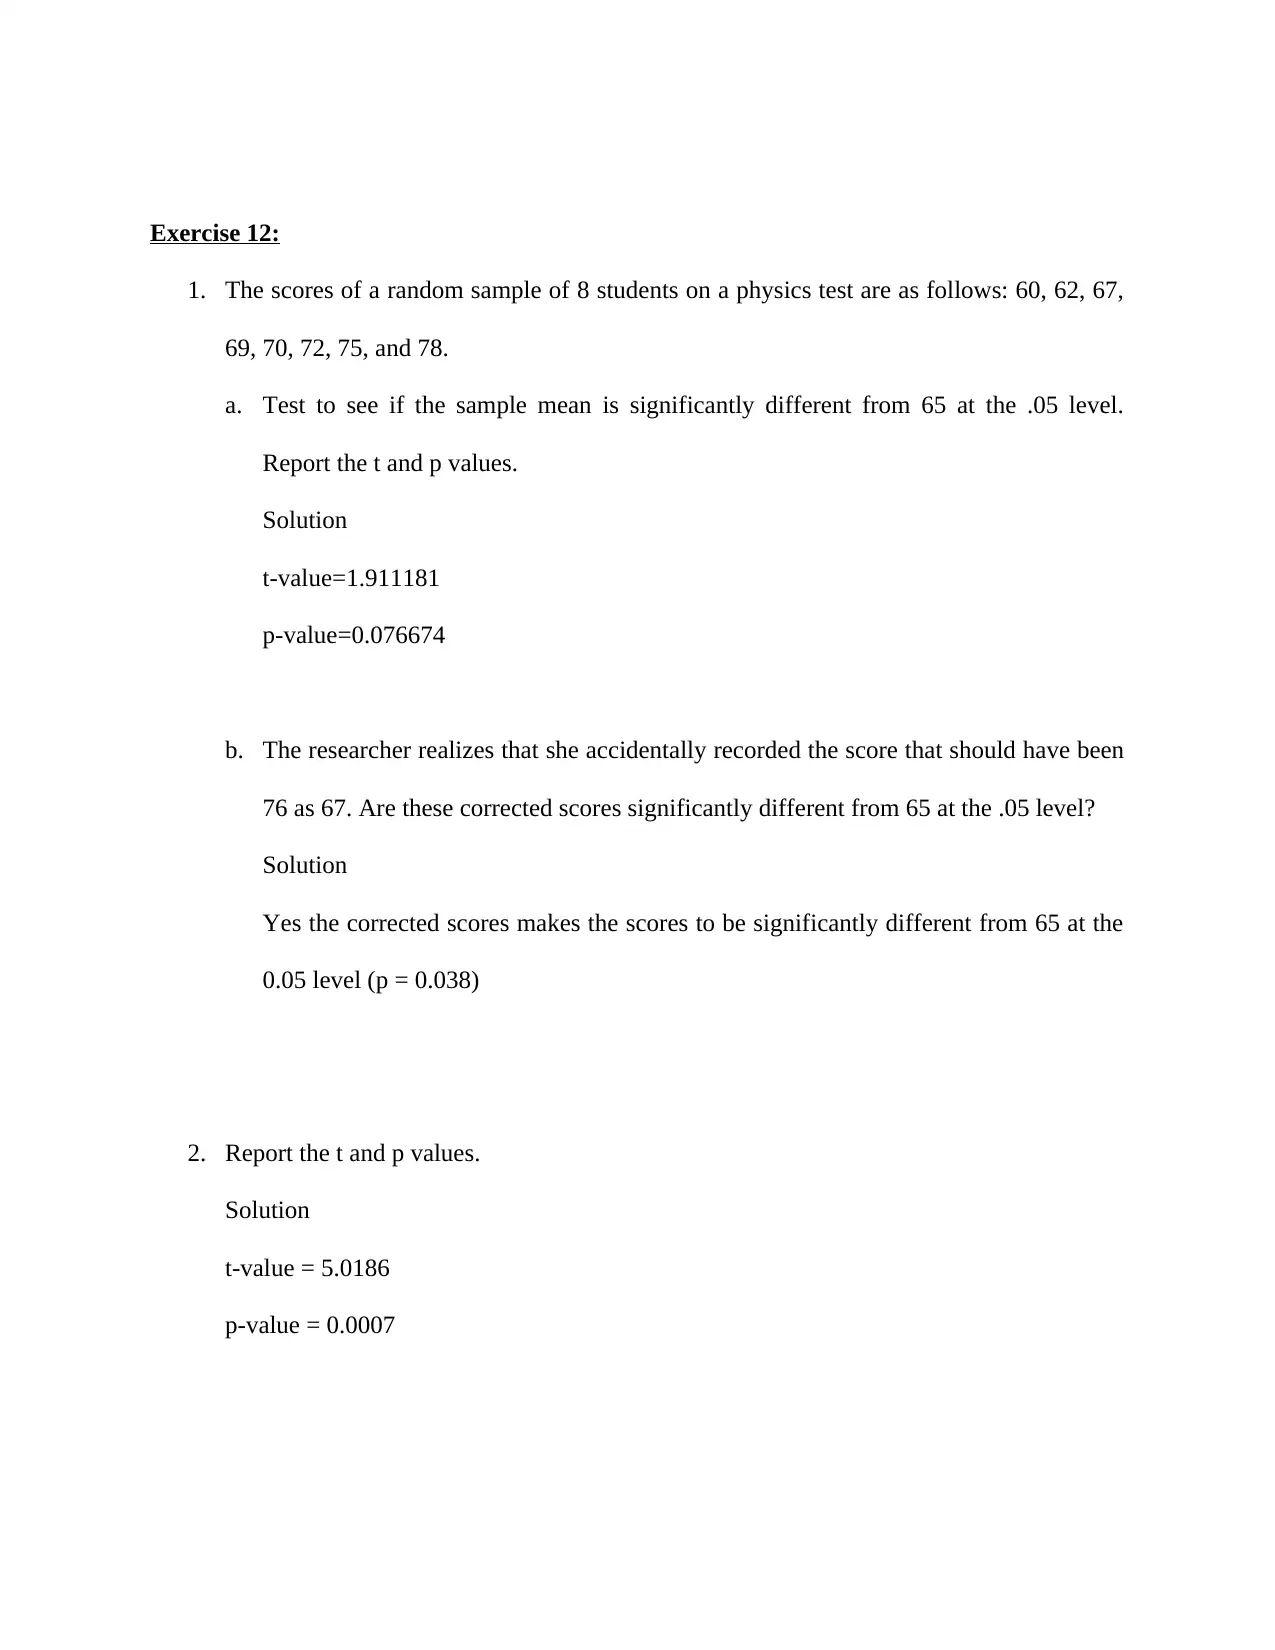
1. The scores of a random sample of 8 students on a physics test are as follows: 60, 62, 67,
69, 70, 72, 75, and 78.
a. Test to see if the sample mean is significantly different from 65 at the .05 level.
Report the t and p values.
Solution
t-value=1.911181
p-value=0.076674
b. The researcher realizes that she accidentally recorded the score that should have been
76 as 67. Are these corrected scores significantly different from 65 at the .05 level?
Solution
Yes the corrected scores makes the scores to be significantly different from 65 at the
0.05 level (p = 0.038)
2. Report the t and p values.
Solution
t-value = 5.0186
p-value = 0.0007
⊘ This is a preview!⊘
Do you want full access?
Subscribe today to unlock all pages.
Trusted by 1+ million students worldwide
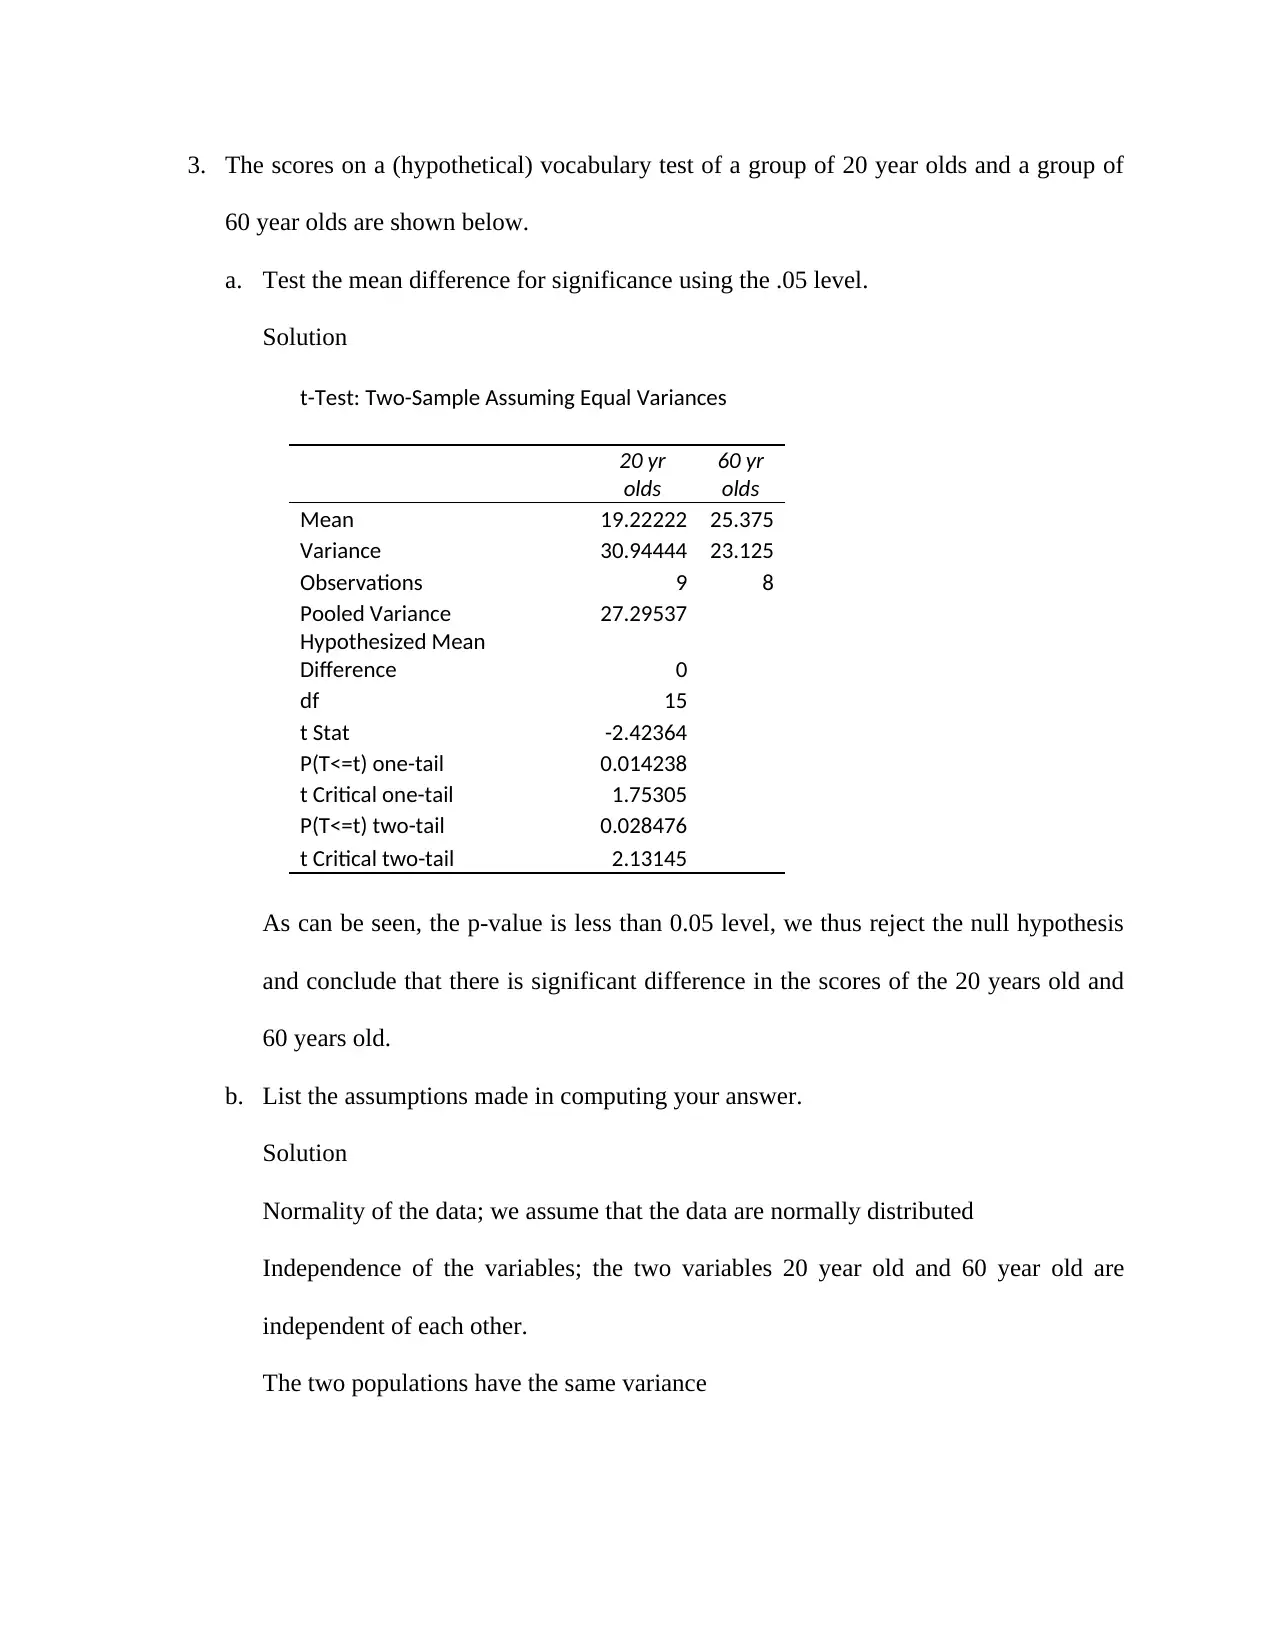
3. The scores on a (hypothetical) vocabulary test of a group of 20 year olds and a group of
60 year olds are shown below.
a. Test the mean difference for significance using the .05 level.
Solution
t-Test: Two-Sample Assuming Equal Variances
20 yr
olds
60 yr
olds
Mean 19.22222 25.375
Variance 30.94444 23.125
Observations 9 8
Pooled Variance 27.29537
Hypothesized Mean
Difference 0
df 15
t Stat -2.42364
P(T<=t) one-tail 0.014238
t Critical one-tail 1.75305
P(T<=t) two-tail 0.028476
t Critical two-tail 2.13145
As can be seen, the p-value is less than 0.05 level, we thus reject the null hypothesis
and conclude that there is significant difference in the scores of the 20 years old and
60 years old.
b. List the assumptions made in computing your answer.
Solution
Normality of the data; we assume that the data are normally distributed
Independence of the variables; the two variables 20 year old and 60 year old are
independent of each other.
The two populations have the same variance
Paraphrase This Document
Need a fresh take? Get an instant paraphrase of this document with our AI Paraphraser
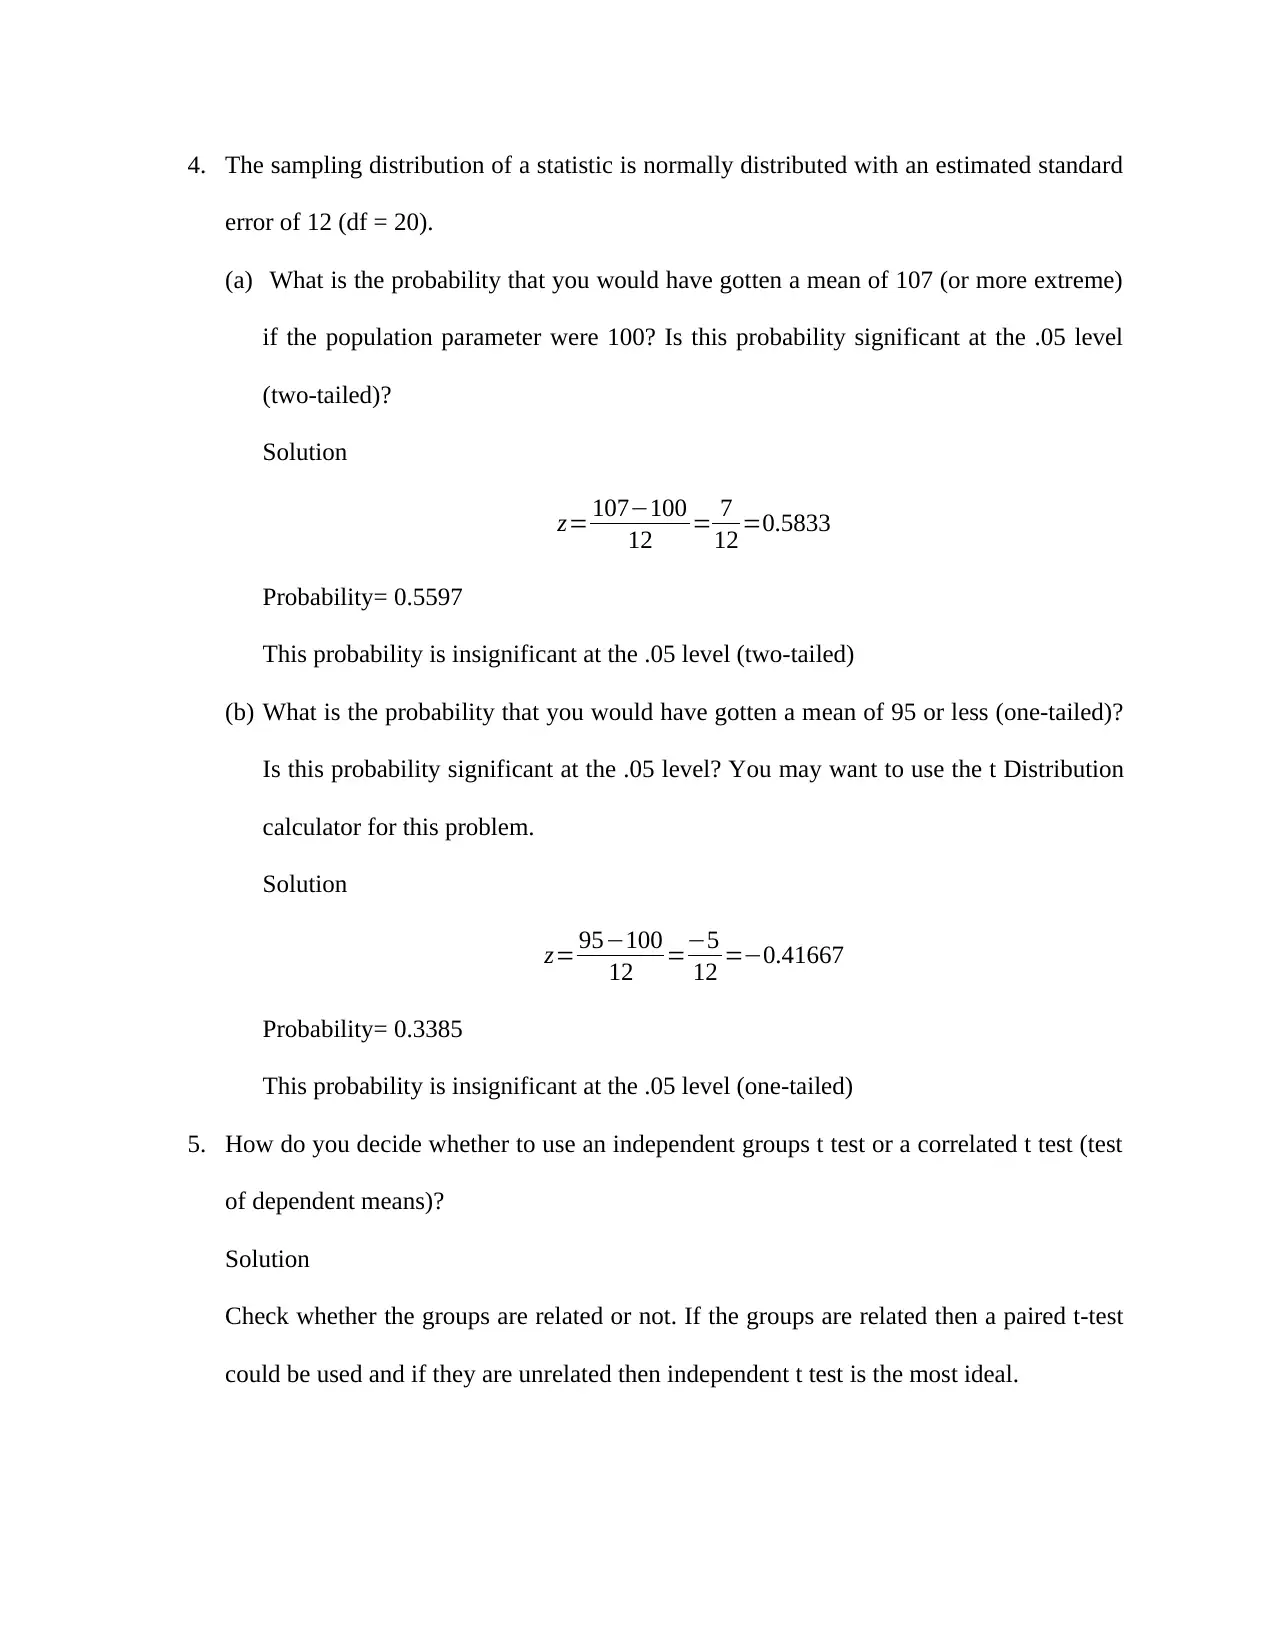
4. The sampling distribution of a statistic is normally distributed with an estimated standard
error of 12 (df = 20).
(a) What is the probability that you would have gotten a mean of 107 (or more extreme)
if the population parameter were 100? Is this probability significant at the .05 level
(two-tailed)?
Solution
z= 107−100
12 = 7
12 =0.5833
Probability= 0.5597
This probability is insignificant at the .05 level (two-tailed)
(b) What is the probability that you would have gotten a mean of 95 or less (one-tailed)?
Is this probability significant at the .05 level? You may want to use the t Distribution
calculator for this problem.
Solution
z= 95−100
12 =−5
12 =−0.41667
Probability= 0.3385
This probability is insignificant at the .05 level (one-tailed)
5. How do you decide whether to use an independent groups t test or a correlated t test (test
of dependent means)?
Solution
Check whether the groups are related or not. If the groups are related then a paired t-test
could be used and if they are unrelated then independent t test is the most ideal.
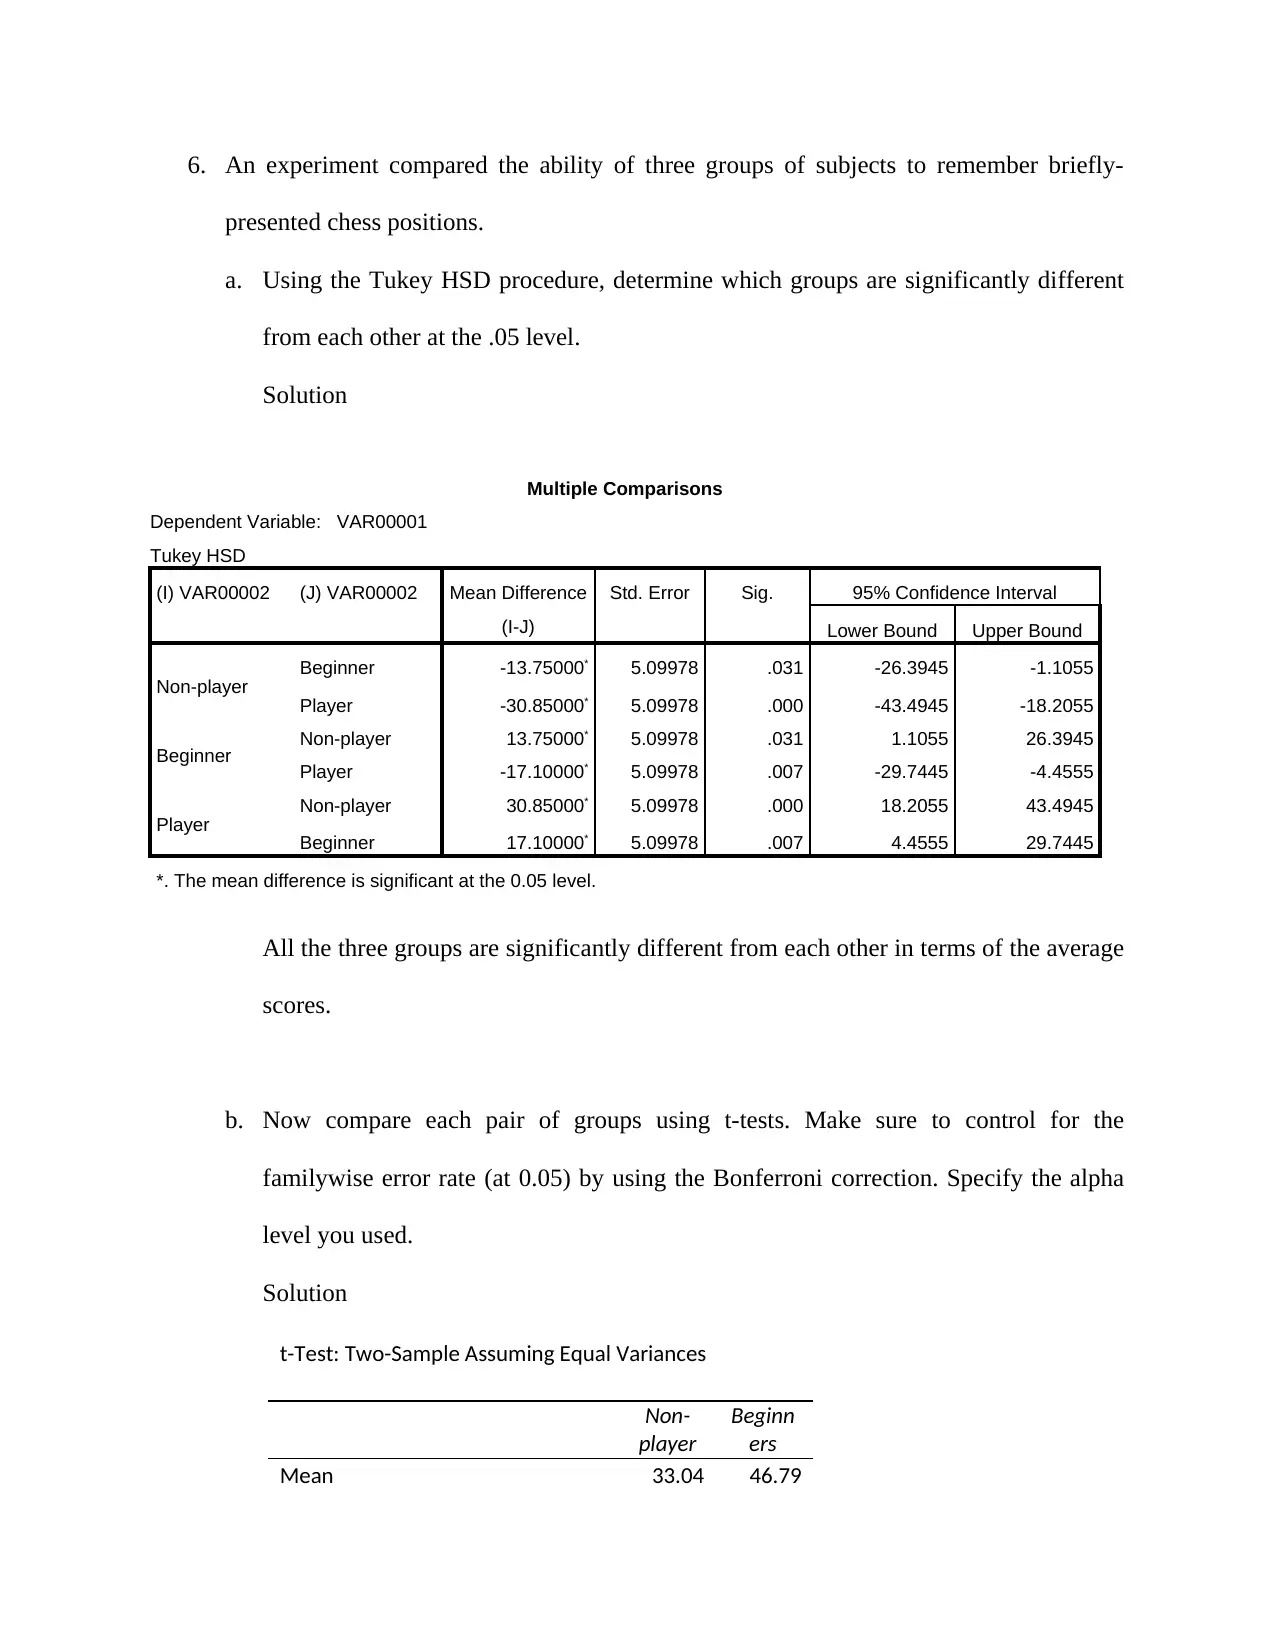
6. An experiment compared the ability of three groups of subjects to remember briefly-
presented chess positions.
a. Using the Tukey HSD procedure, determine which groups are significantly different
from each other at the .05 level.
Solution
Multiple Comparisons
Dependent Variable: VAR00001
Tukey HSD
(I) VAR00002 (J) VAR00002 Mean Difference
(I-J)
Std. Error Sig. 95% Confidence Interval
Lower Bound Upper Bound
Non-player Beginner -13.75000* 5.09978 .031 -26.3945 -1.1055
Player -30.85000* 5.09978 .000 -43.4945 -18.2055
Beginner Non-player 13.75000* 5.09978 .031 1.1055 26.3945
Player -17.10000* 5.09978 .007 -29.7445 -4.4555
Player Non-player 30.85000* 5.09978 .000 18.2055 43.4945
Beginner 17.10000* 5.09978 .007 4.4555 29.7445
*. The mean difference is significant at the 0.05 level.
All the three groups are significantly different from each other in terms of the average
scores.
b. Now compare each pair of groups using t-tests. Make sure to control for the
familywise error rate (at 0.05) by using the Bonferroni correction. Specify the alpha
level you used.
Solution
t-Test: Two-Sample Assuming Equal Variances
Non-
player
Beginn
ers
Mean 33.04 46.79
⊘ This is a preview!⊘
Do you want full access?
Subscribe today to unlock all pages.
Trusted by 1+ million students worldwide
1 out of 53