Environmental Science: Geomorphology Exercises on Landforms
VerifiedAdded on 2023/01/17
|7
|1368
|91
Homework Assignment
AI Summary
This document provides comprehensive solutions to a series of geomorphology exercises. The exercises cover diverse topics including coastal blowout dunes, moraines and pitted outwash plains, alpine glaciation, and permafrost analysis. Detailed solutions are provided for each exercise, including calculations of contour intervals, ratio scales, and relief. The solutions also involve the creation of cross-sectional profiles, identification of landform features such as oxbows and meander scars, and analysis of environmental changes over time, such as the growth of a river delta and the movement of glaciers. The document uses maps, graphs, and profiles to illustrate the concepts and provide answers to questions related to wind direction, ice movement, and the impact of permafrost. Furthermore, the solutions incorporate references to scientific literature, providing a well-rounded understanding of the subject matter.
Exercise 2: Moraine and Pitted Outwash Plain
1.
a) The contour interval for the map is the contour spacing. In this map the intervals
have a difference of 50 feet between successive contours. Thus its contour interval is
50 feet.
b) The ratio scale = 1: 62,500
Fractional scale ¿ 1
62,500
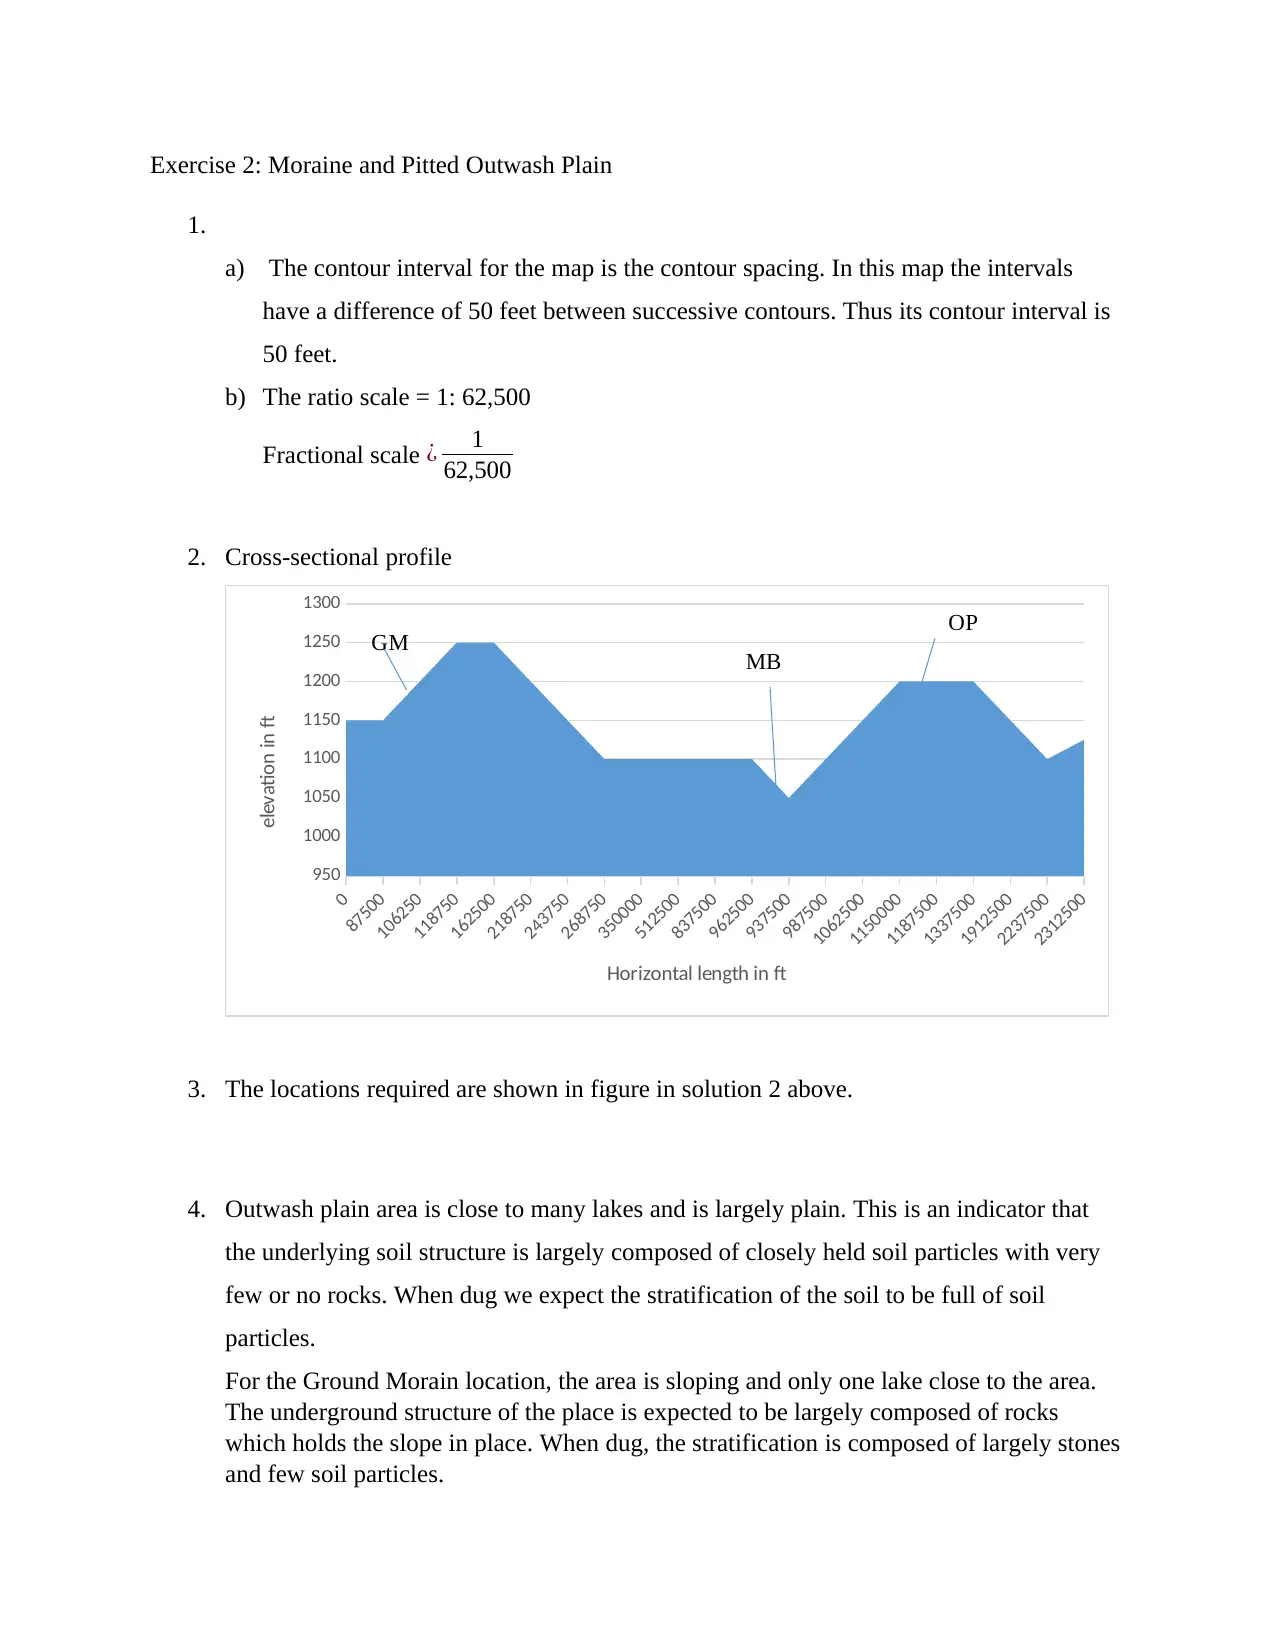
2. Cross-sectional profile
0
87500
106250
118750
162500
218750
243750
268750
350000
512500
837500
962500
937500
987500
1062500
1150000
1187500
1337500
1912500
2237500
2312500
950
1000
1050
1100
1150
1200
1250
1300
Horizontal length in ft
elevation in ft
MB
OP
GM
3. The locations required are shown in figure in solution 2 above.
4. Outwash plain area is close to many lakes and is largely plain. This is an indicator that
the underlying soil structure is largely composed of closely held soil particles with very
few or no rocks. When dug we expect the stratification of the soil to be full of soil
particles.
For the Ground Morain location, the area is sloping and only one lake close to the area.
The underground structure of the place is expected to be largely composed of rocks
which holds the slope in place. When dug, the stratification is composed of largely stones
and few soil particles.
Paraphrase This Document
Need a fresh take? Get an instant paraphrase of this document with our AI Paraphraser
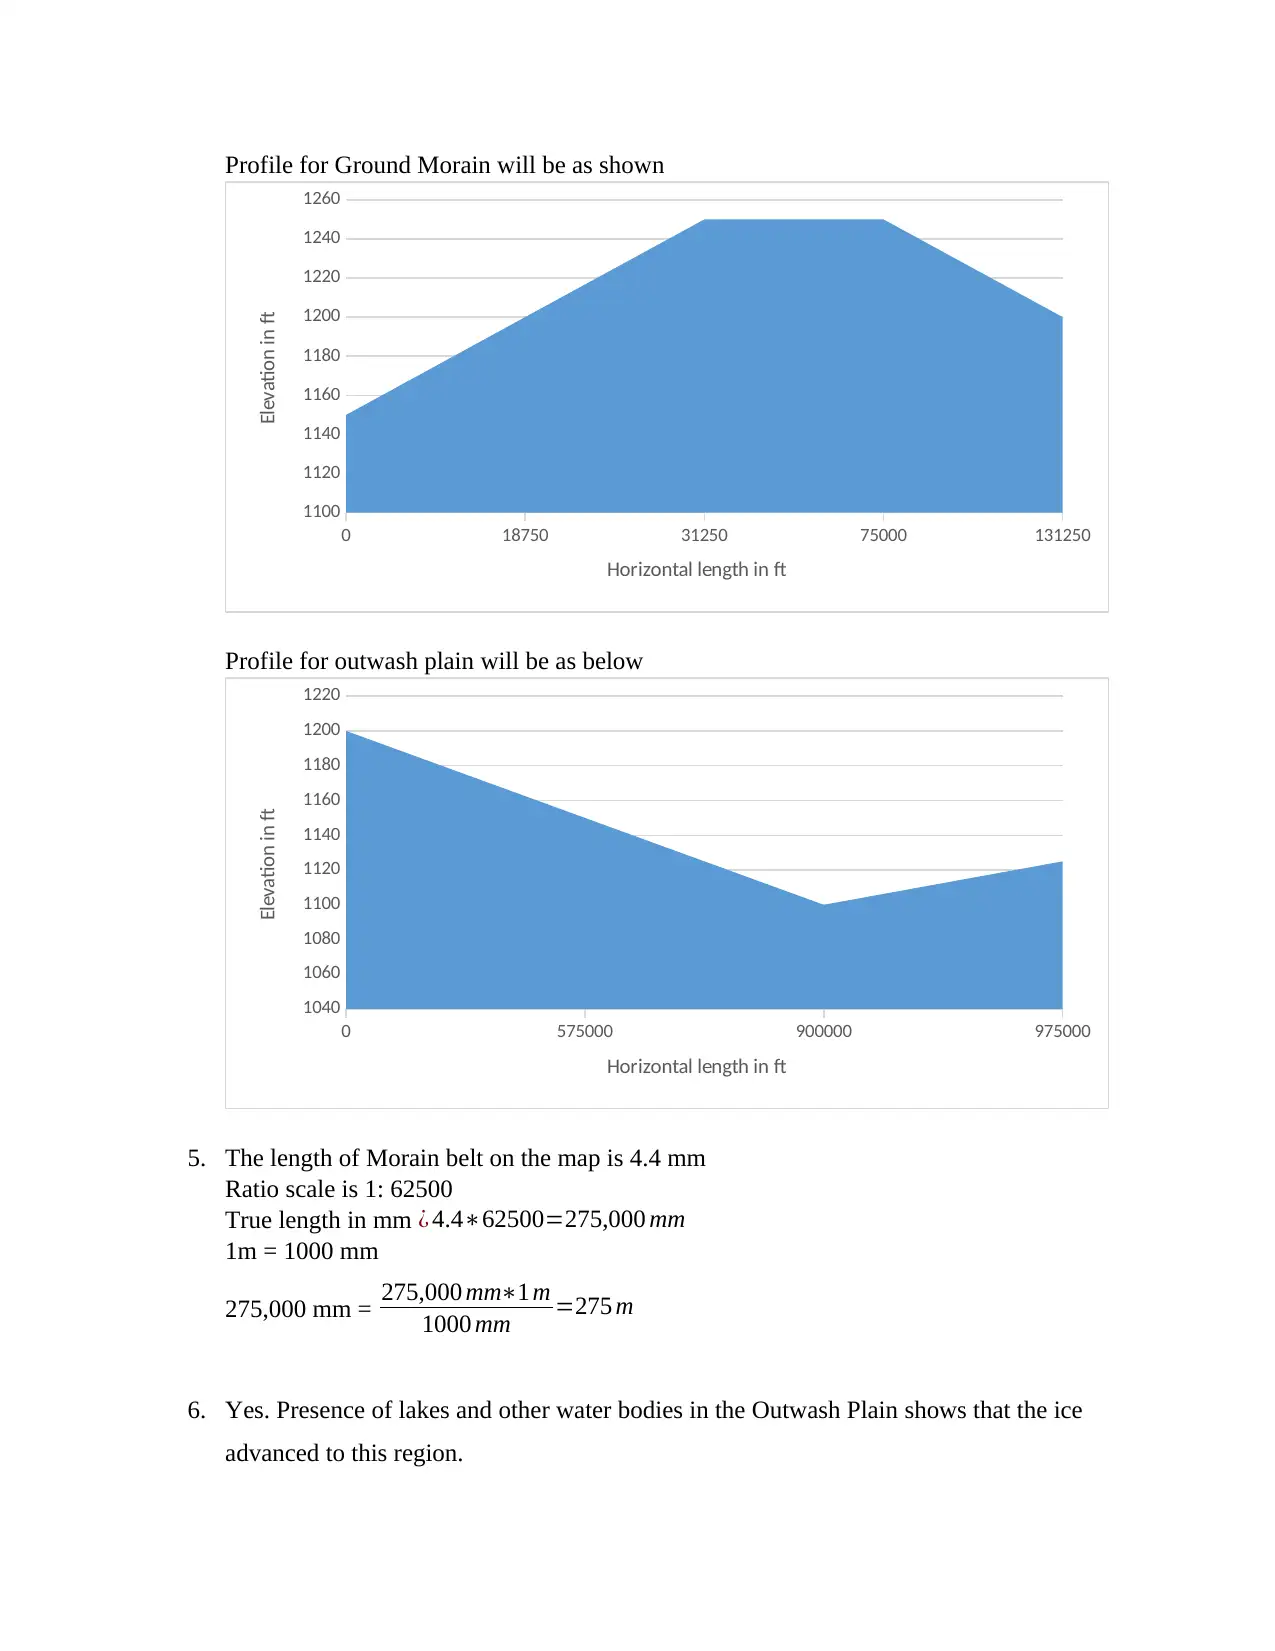
Profile for Ground Morain will be as shown
0 18750 31250 75000 131250
1100
1120
1140
1160
1180
1200
1220
1240
1260
Horizontal length in ft
Elevation in ft
Profile for outwash plain will be as below
0 575000 900000 975000
1040
1060
1080
1100
1120
1140
1160
1180
1200
1220
Horizontal length in ft
Elevation in ft
5. The length of Morain belt on the map is 4.4 mm
Ratio scale is 1: 62500
True length in mm ¿ 4.4∗62500=275,000 mm
1m = 1000 mm
275,000 mm = 275,000 mm∗1 m
1000 mm =275 m
6. Yes. Presence of lakes and other water bodies in the Outwash Plain shows that the ice
advanced to this region.
7. The Outwash plain to the south borders the Morain belt with a steep slope then later a
plain section extended over a large area. For Ground Morain, the area covered is
relatively small as compared to Outwash plain. Ground Morain is made up of small steep
slope and plain section. This gives the Ground Morain a smaller surface area as compared
to Outwash plain region.
8.
a) Valley
b) The ice moved towards North West.
c) There are many water bodies including swamps and lakes towards the North West.
Exercise 3: Alpine Glaciation
1. Colouring areas covered by ice. The places covered by ice are shown by broken/dotted
contours.
2. Direction of ice movement
3. The glaciers are moving from high elevation regions to those regions with lower
elevations.
Glaciers are moving because of the force of gravity. They move towards valleys or
regions at low elevations.
4. Finding and labelling
5. Lowest elevation where glaciers occur is 5400 m
6. The elevations vary because of the differences in deposition. Some are closely packed
while others were widely dispersed during deposition.
7. Cross sectional profiles
8.
Exercise 4: Permafrost
⊘ This is a preview!⊘
Do you want full access?
Subscribe today to unlock all pages.

Trusted by 1+ million students worldwide
1.
0 10 20 30 40 50 60 70 80 90
-25
-20
-15
-10
-5
0
5
10
15
Summer Temperature Winter temperature
Depth
Temperature
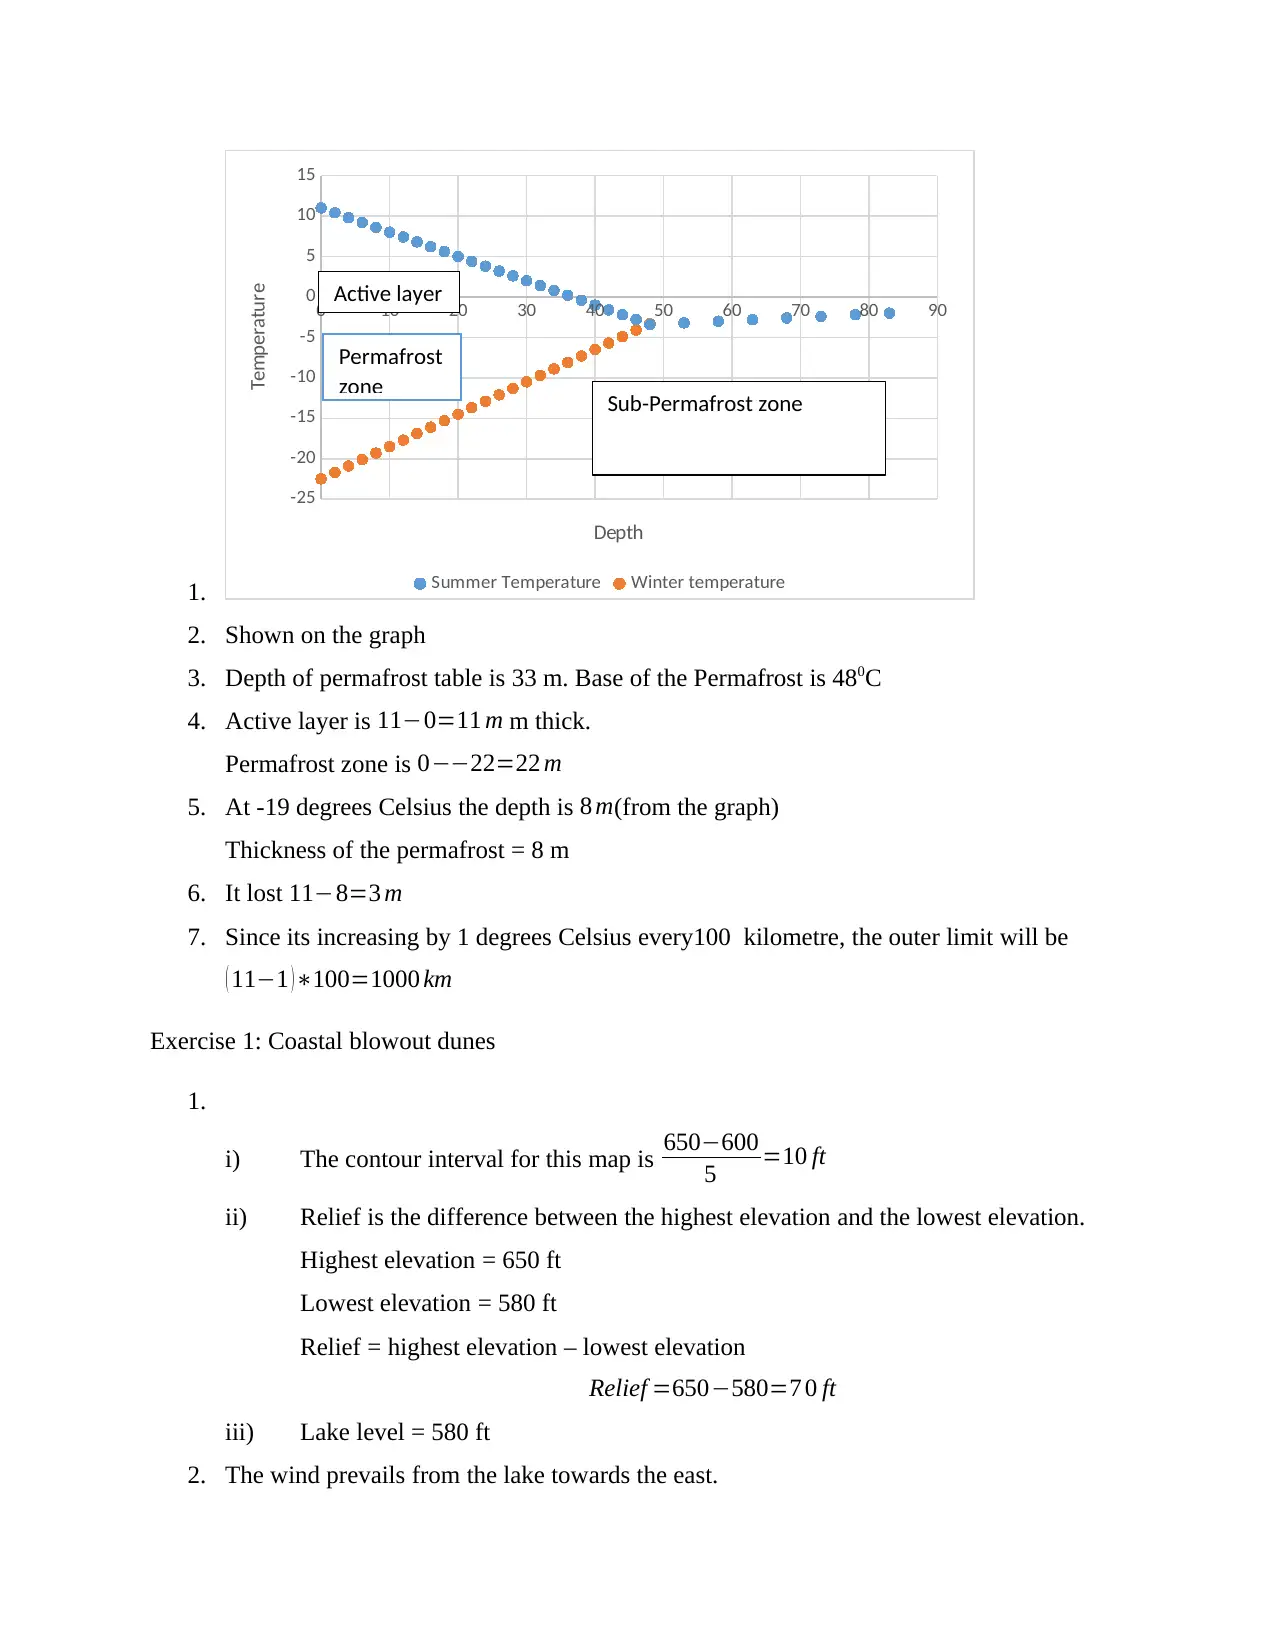
2. Shown on the graph
3. Depth of permafrost table is 33 m. Base of the Permafrost is 480C
4. Active layer is 11−0=11 m m thick.
Permafrost zone is 0−−22=22 m
5. At -19 degrees Celsius the depth is 8 m(from the graph)
Thickness of the permafrost = 8 m
6. It lost 11−8=3 m
7. Since its increasing by 1 degrees Celsius every100 kilometre, the outer limit will be
( 11−1 )∗100=1000 km
Exercise 1: Coastal blowout dunes
1.
i) The contour interval for this map is 650−600
5 =10 ft
ii) Relief is the difference between the highest elevation and the lowest elevation.
Highest elevation = 650 ft
Lowest elevation = 580 ft
Relief = highest elevation – lowest elevation
Relief =650−580=7 0 ft
iii) Lake level = 580 ft
2. The wind prevails from the lake towards the east.
Active layer
Sub-Permafrost zone
Permafrost
zone
Paraphrase This Document
Need a fresh take? Get an instant paraphrase of this document with our AI Paraphraser
3. Blowout dunes
4. The vegetation cover at this section is expected to be scanty and composed of plants with
tap roots able to withstand strong winds ant tides. The area is expected to have beach
grass which helps in keeping the sand dunes in place. Rushes and reeds are also found in
this region.
5. The region close to the lake can hold water for a long period of time. This condition
makes it possible for grasses and other herbaceous plants to grow. Marsh grasses and
herbaceous plants grow in marshy areas since the water deposits rich soil to this regions.
Exercise 2: Moberly River Delta
1. The river has meanders as it approach the lake. This reduces the velocity of the moving
water as it moves through the meanders coupled with the gentle slope at the river end. As
the water moves close to the lake, its velocity reduces. The reduced velocity gives time
for the sediments carried to be deposited (National Research Council, 2013).
2. The river exhibits estuarine delta (Robert, 2014). The sediments are deposited by the
river water close to the lake and the lake tends to remove the deposited sediments.
3. Magnification of the 1969 model from the map is X2.
Scale for the map is 1: 50,000
Scale for 1969 model will be 1
50000∗2=1 :25,000
4. Superimposing changes on 1989 photos on the 1969 photo.
5. The sediments deposited near the lake blocked the river channels advancing to the lake.
This led to the river forcing another route leading to formation of oxbows.
6. Mark all oxbows and meander scars
7. The river channel has changed drastically over period of time. Most of the meanders
which were present in 1969 have been turned to oxbows and the river channel
straightened with one meander.
8. The change measured by a ruler is 5 mm. The scale is 1:25,000. The actual change at the
location will be 25000∗5=125,000 mm=125 m

Distance changed = 125 m
Number of years = 20
Change per year ¿ 125 m
20 years =6.25 m/ year
9. The growth of the delta has been brought by continued deposition of materials at the lake
side by the water from the river channel. Accumulation of the materials leads an increase
in the size of the delta by occupying spaces previously occupied by water from the lake
(Timoney, 2013).
⊘ This is a preview!⊘
Do you want full access?
Subscribe today to unlock all pages.

Trusted by 1+ million students worldwide

References
National Research Council, D. o. E. a. L. S. W. S. a. T. B. C. o. S. R. f. I. W. R. M., 2013. Delta Waters:
Research to Support Integrated Water and Environmental Management in the Lower Mississippi River.
In: s.l.:National Academies Press, pp. 47-96.
Robert, A., 2014. RIVER PROCESSES: An introduction to fluvial dynamics. In: s.l.:Routledge, pp. 193-207.
Timoney, K. P., 2013. The Peace-Athabasca Delta: Portrait of a Dynamic Ecosystem. In: s.l.:University of
Alberta, pp. 143-178.
1 out of 7
Your All-in-One AI-Powered Toolkit for Academic Success.
+13062052269
info@desklib.com
Available 24*7 on WhatsApp / Email
![[object Object]](/_next/static/media/star-bottom.7253800d.svg)
Unlock your academic potential
Copyright © 2020–2025 A2Z Services. All Rights Reserved. Developed and managed by ZUCOL.