FIN80005 Corporate Financial Management: Tastegood Expansion Report
VerifiedAdded on 2023/06/03
|12
|2580
|413
Report
AI Summary
This report assesses Tastegood Limited's expansion proposal involving selling goods under Cheap & Good's private label. It evaluates the project's profitability using Net Present Value (NPV) analysis, considering factors like machinery costs, depreciation, revenue growth, variable costs, and tax implications. Sensitivity analysis is conducted to understand the impact of revenue fluctuations on the project's NPV. Furthermore, the report examines abnormal returns based on the semi-strong form of the market hypothesis, analyzing stock and market returns around the announcement date to determine market efficiency and potential mispricing opportunities. The analysis uses time series and regression to calculate Beta and Weighted Average Cost of Capital (WACC) to determine appropriate discounting factors. Appendices provide detailed calculations and supporting data for the analysis.
EXAPANSION OF BUSINESS & SALE OF GOODS UNDER PRIVATE
LABEL TO CHEAP & GOOD
1
LABEL TO CHEAP & GOOD
1
Paraphrase This Document
Need a fresh take? Get an instant paraphrase of this document with our AI Paraphraser

CORPORATE FINANCIAL ASSIGNMENT-INDIVIDUAL
EXECUTIVE SUMMARY
The report details out expansion proposal of Tastegood by selling under the private label of Cheap&
Goods. The report inks out the probable impact of such expansion on other business of the
company. The report further presses on sensitivity analysis form Year 6 and the probable impact of
such announcement on the market value of the shares of the company and any excess earning
earned by the company on account of same in a semi-strong Hypothesis market.
2
Table of Content
Contents
EXECUTIVE SUMMARY...........................................................................................................................2
Table of Content....................................................................................................................................3
Purpose of Report.................................................................................................................................4
Net Present Value..................................................................................................................................4
Assumptions involved under the computation..................................................................................4
NPV Analysis......................................................................................................................................4
Sensitivity Analysis.................................................................................................................................5
Assumption........................................................................................................................................5
Abnormal Returns: Semi Strong Form of Market Hypothesis................................................................5
Appendix-1............................................................................................................................................7
Appendix-2..........................................................................................................................................11
3
⊘ This is a preview!⊘
Do you want full access?
Subscribe today to unlock all pages.
Trusted by 1+ million students worldwide
Purpose of Report
Tastegood Limited, a public entity, listed on Australian Stock Exchange is contemplating to expand its
operations by selling finished good in a private label to Cheap & Good. Further, under the said terms
the supply shall be made for a period of 10 years. On the basis of above, the Chief Executive Officer
of the company wishes to understand the profitability of the said project. Further, the report deals
with sensitivity analysis of the said project deals with the abnormal returns earned by the company
on account of announcement of said project. The breakup of the content of the report:
(a) Computation of Net Present Value of the project;
(b) Sensitivity Analysis of the project;
(c) Abnormal Returns: Semi Strong Form of Market Hypothesis.
Net Present Value
Under the said tool of Capital Budgeting, the present value of the cash flows of the project by a
particular discount rate usually Weighted Average Cost of Capital of the company is reduced by the
initial outlay of the project. If the computation is positive, then the project is viable otherwise not.
Further, the higher the value, the more lucrative the project is.
Assumptions involved under the computation
(a) The cash flow assumed holds good;
(b) The cost incurred for installation and shipping of machinery has been considered a cost of the
asset in terms of AASB and accordingly the same has been depreciated using Written down
value method over the period of 10 years;
(c) Yield of debentures has not been considered for analysis as bond market value is not required
as debt to equity ratio has been stated in the question.
(d) The maturity period of bond has not been considered for analysis.
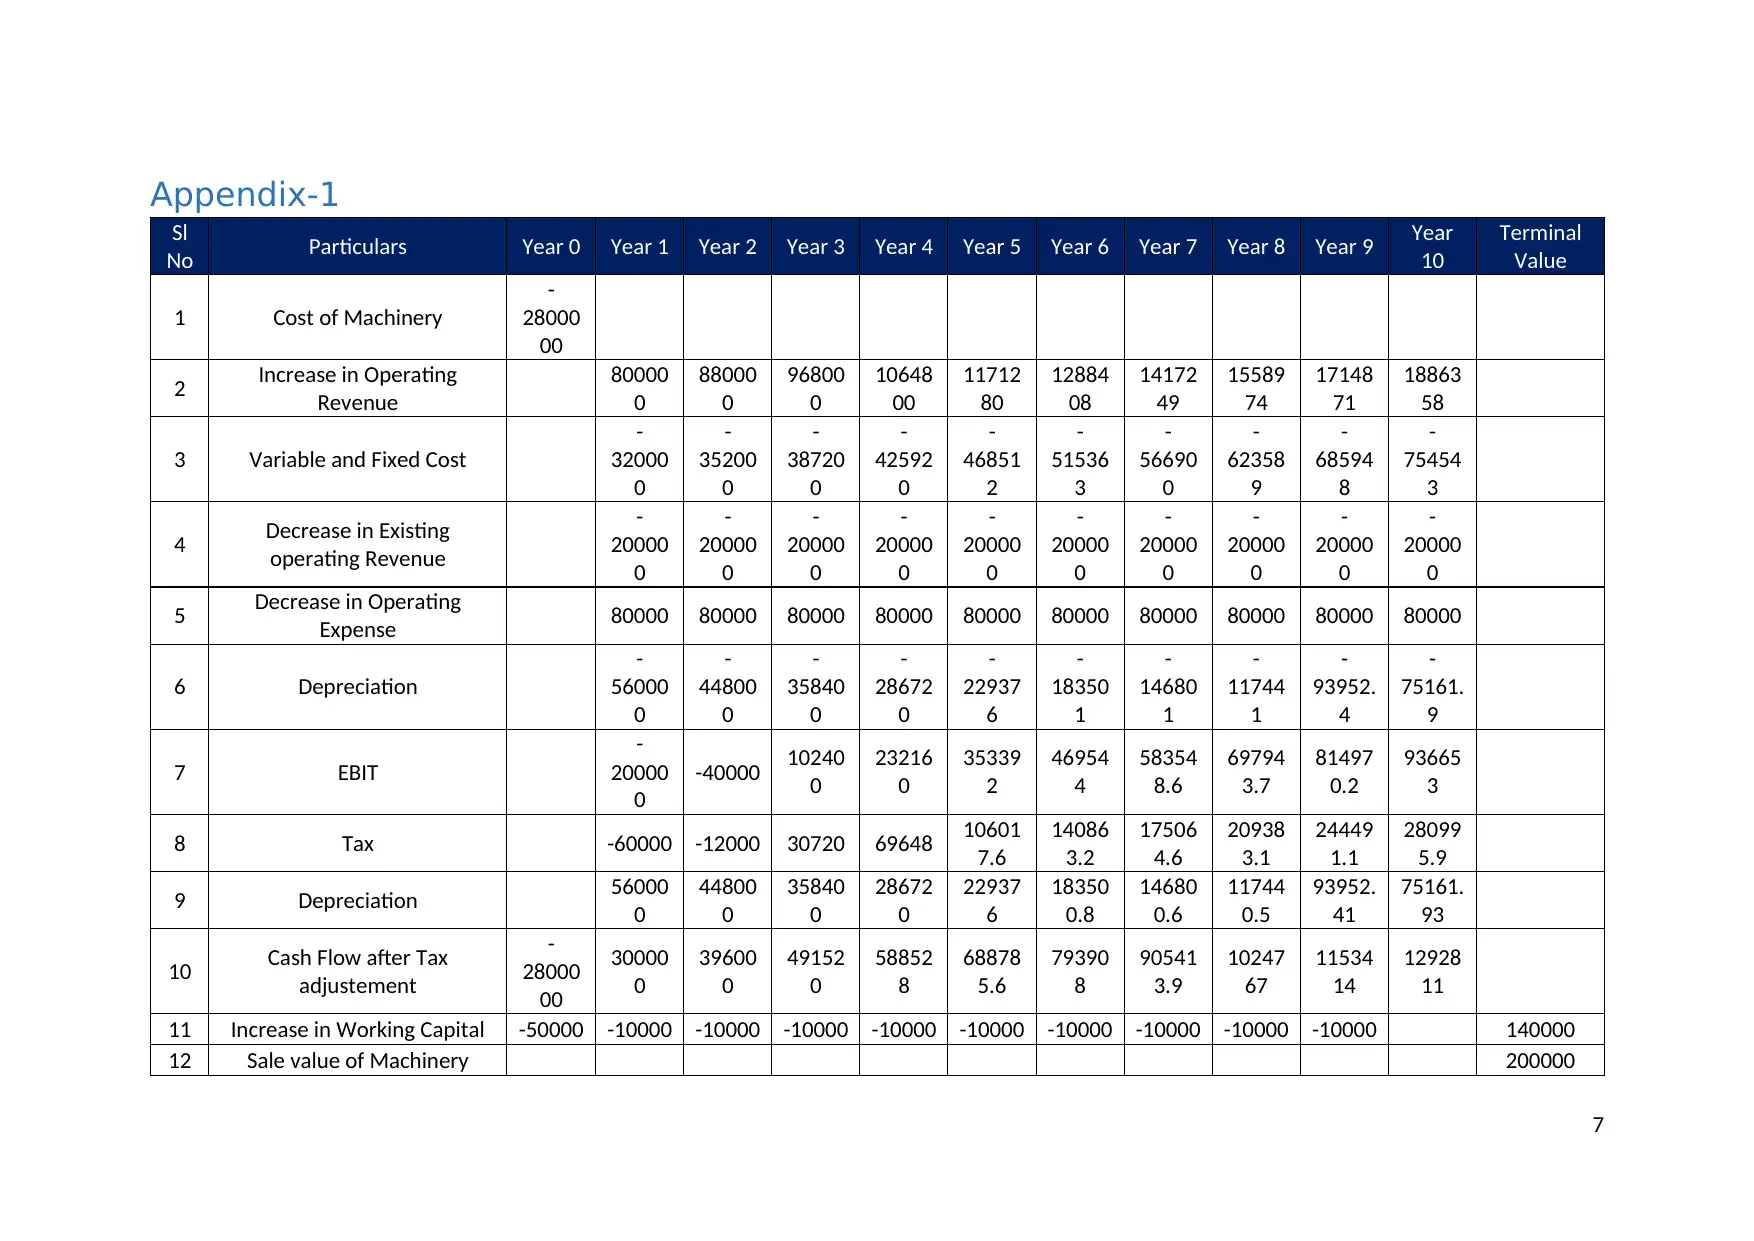
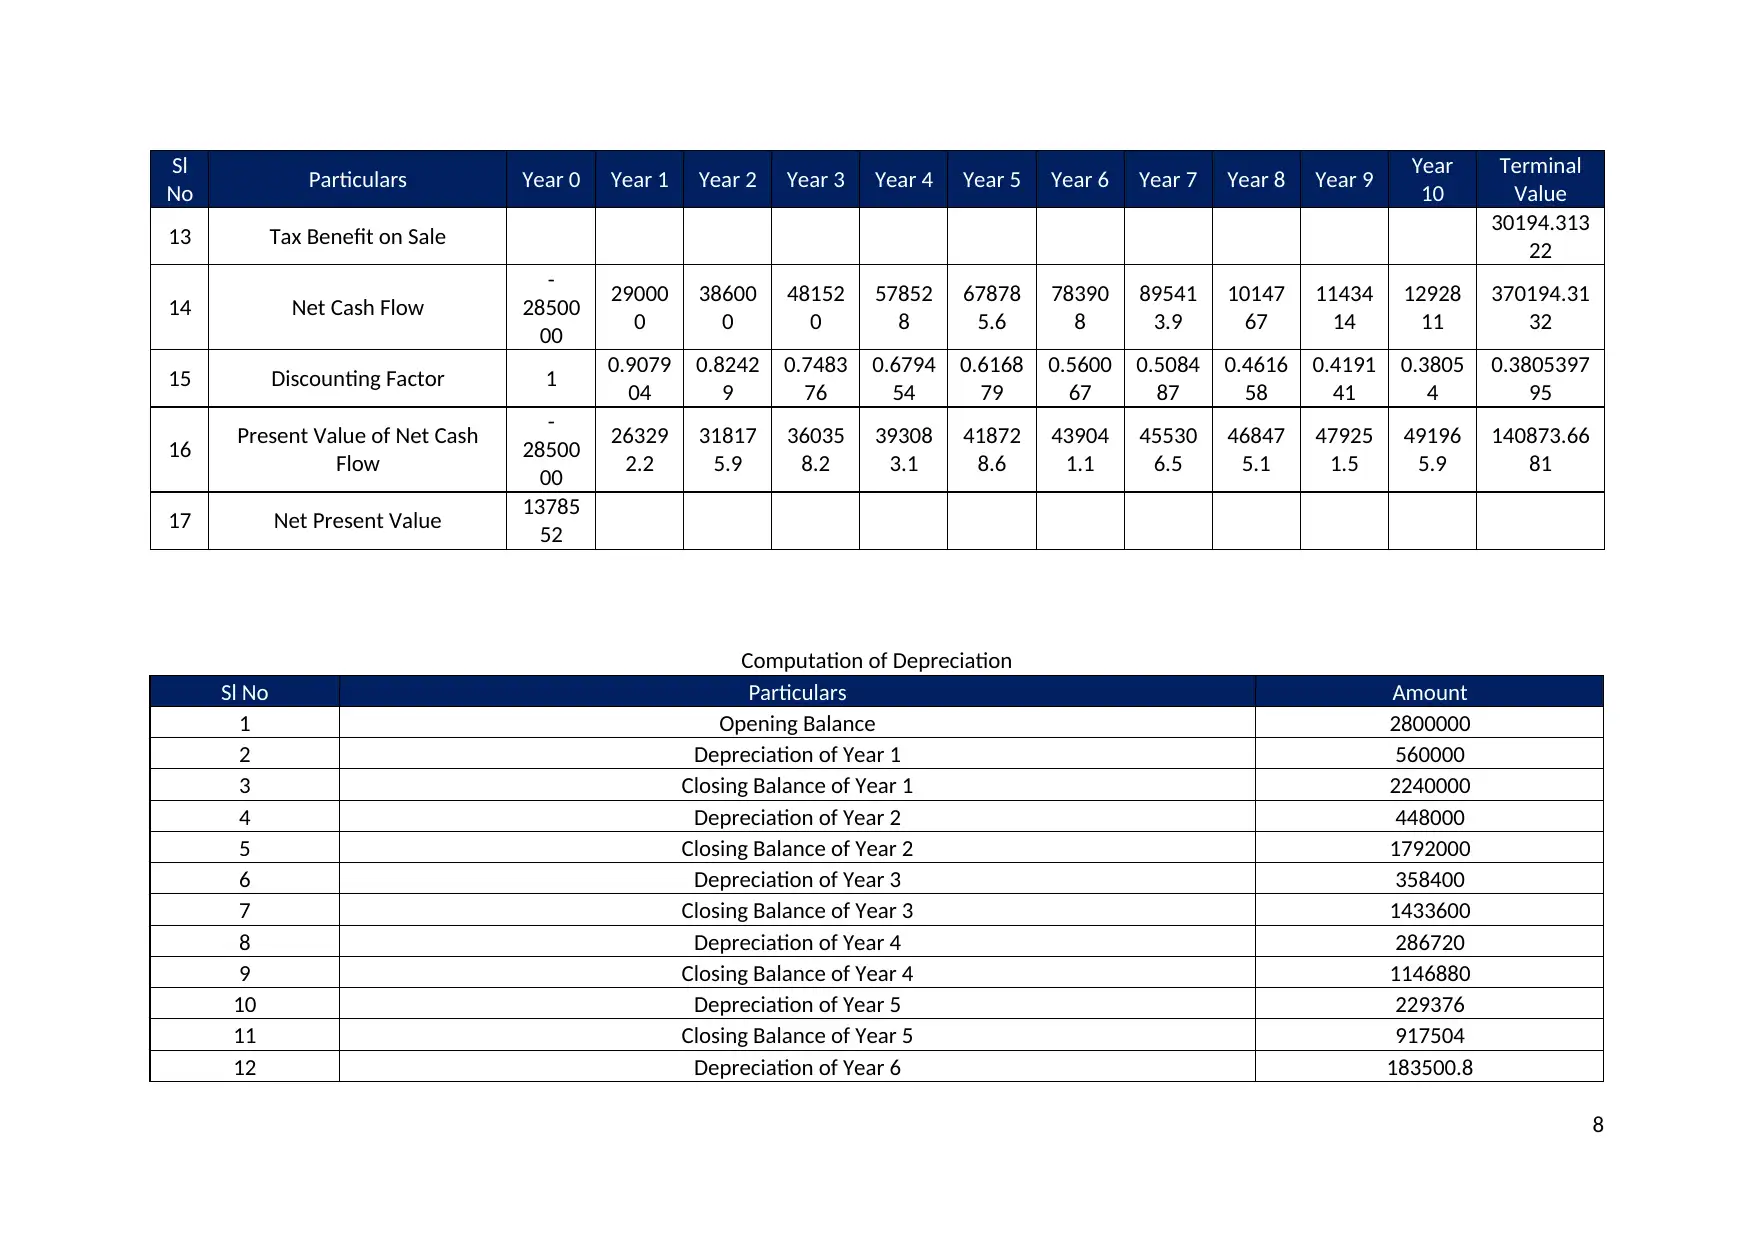
NPV Analysis
On perusal of the appendix 1, it shall be seen that the proposed project has a positive Net present
value which is significantly beneficial for the company and the company shall execute the same as t
it shall add value to the company. Further, it shall be pertinent to note that the said computation
has been derived in the following manner:
(a) Cost of Machinery has been considered by including shipping and installation cost;
(b) Machinery has been depreciated using declining balance method @20%;
(c) Revenue has been expected to increase @10%;
(d) Variable cost has been considered 40% of expenditure;
(e) Opportunity loss has been considered for computation of net present value;
(f) Tax has been deducted from Operating Cash flow @30%;
(g) There has been adjustment on account of changes in Working Capital on account of execution
of the proposed project ;
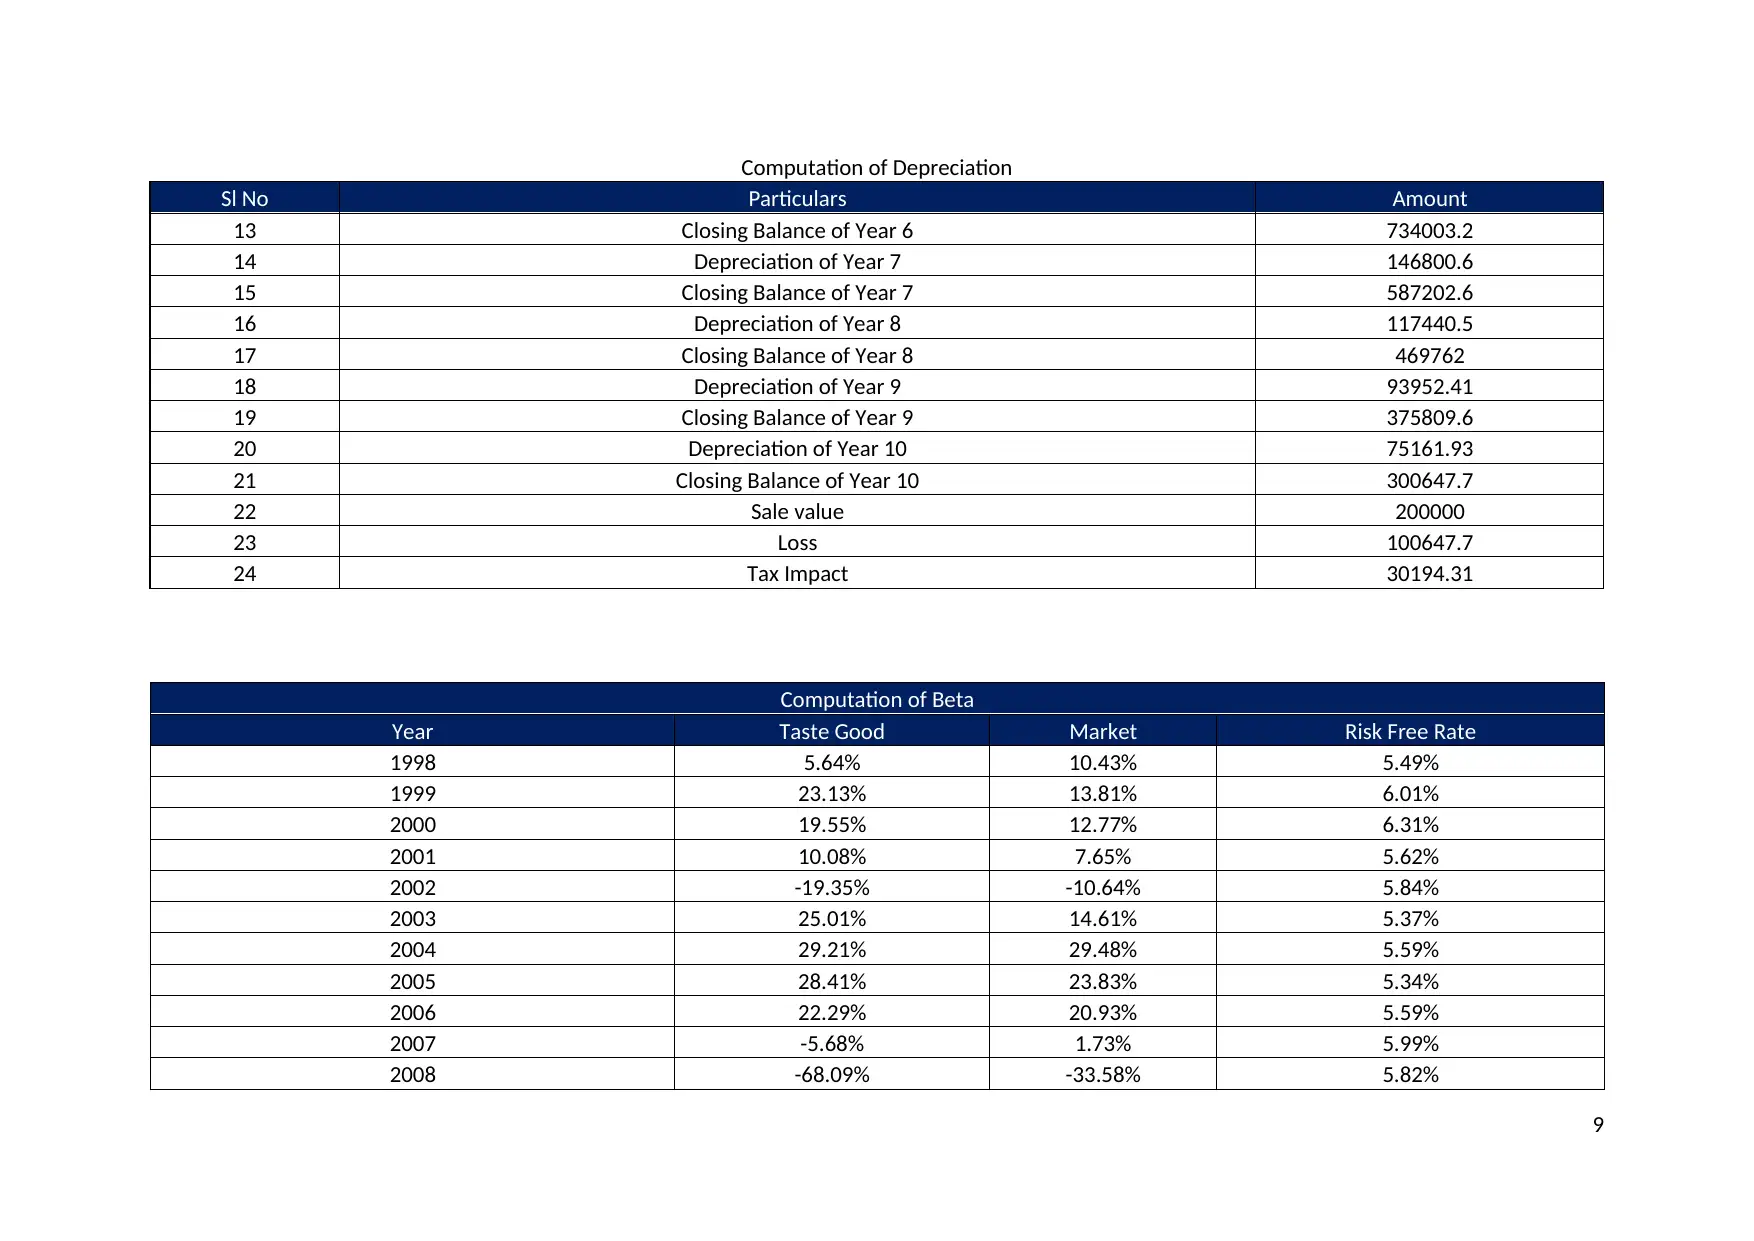
(h) Machine has been sold at the end of the period and tax impact on the same has been
considered. For detailed analysis refer Appendix 1;
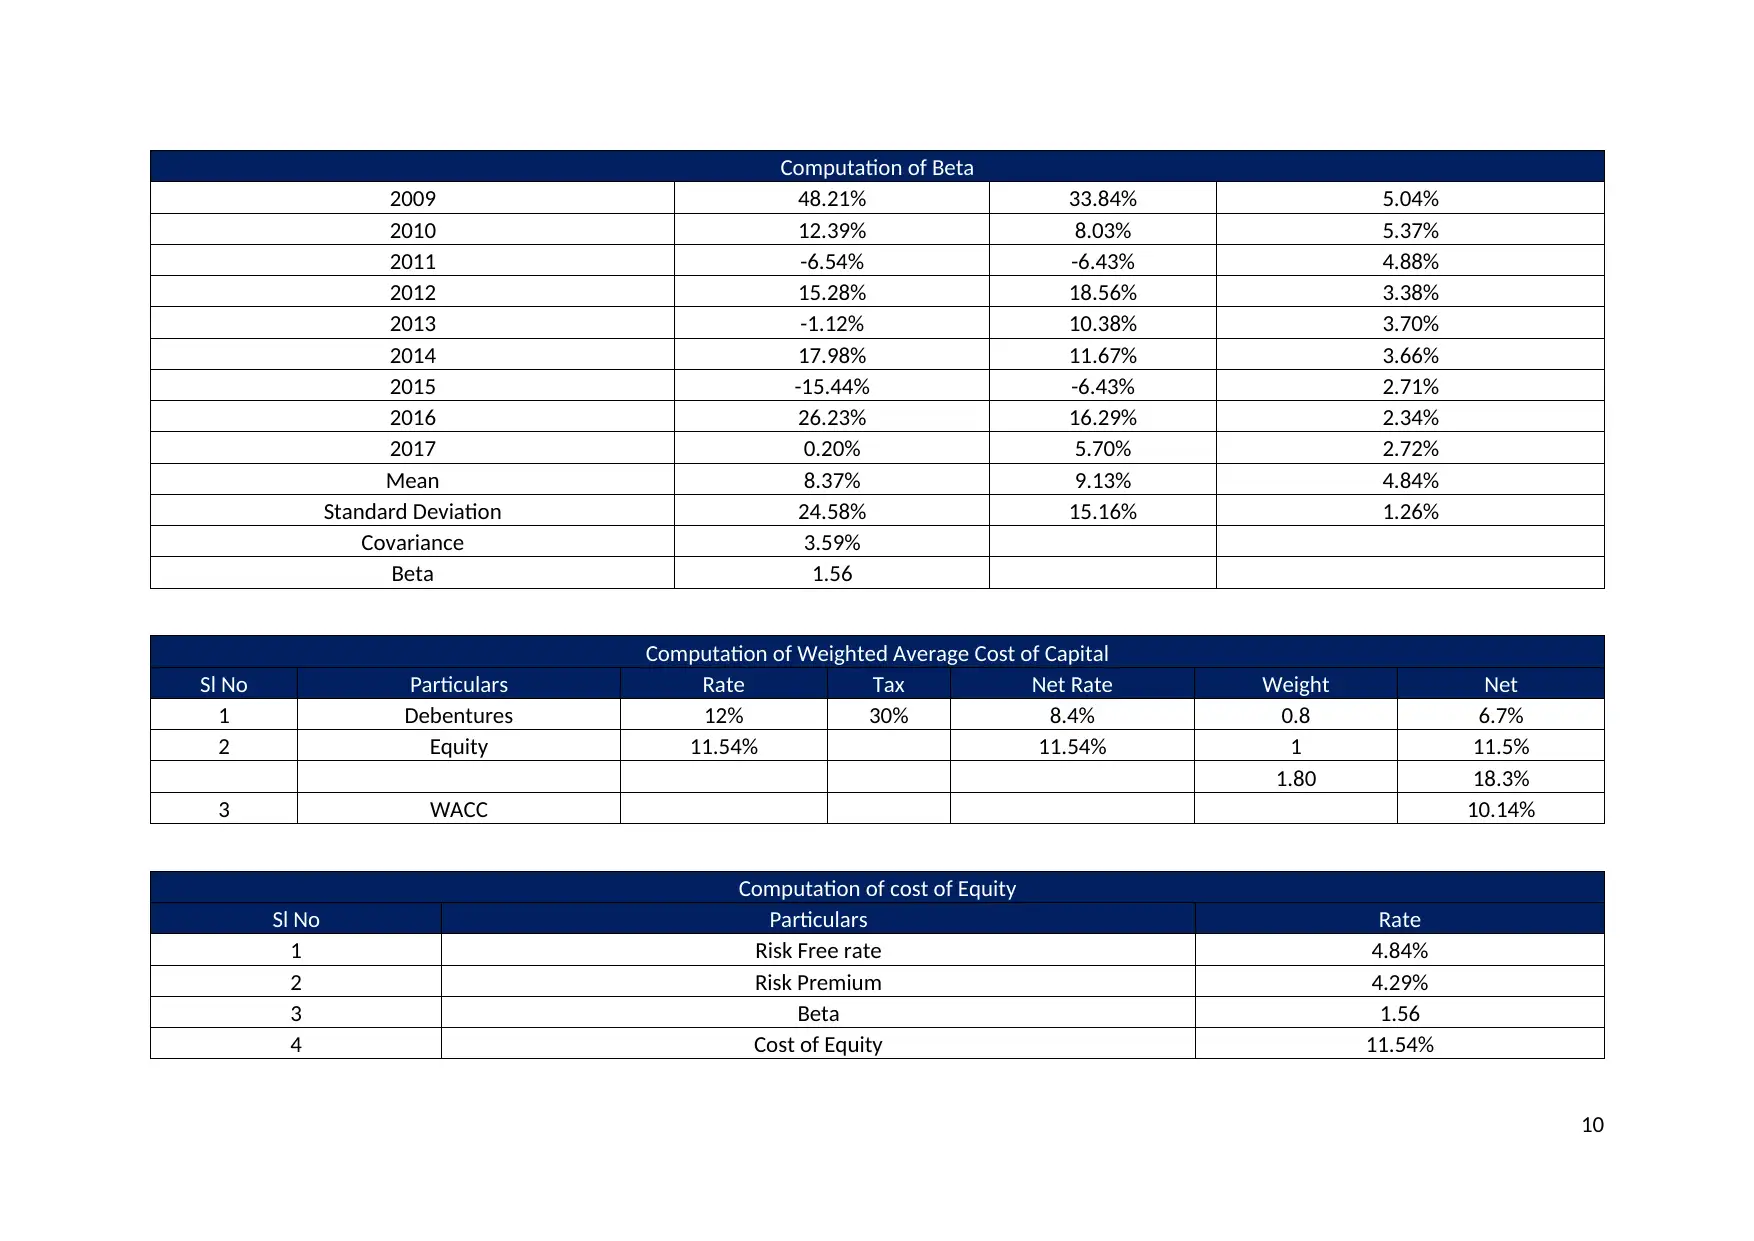
(i) Beta has been computed based on time series and regression analysis;
(j) The discounting factor has been taken at Weighted Average Cost of Capital of the company i.e.
11.54%.
4
Tastegood Limited, a public entity, listed on Australian Stock Exchange is contemplating to expand its
operations by selling finished good in a private label to Cheap & Good. Further, under the said terms
the supply shall be made for a period of 10 years. On the basis of above, the Chief Executive Officer
of the company wishes to understand the profitability of the said project. Further, the report deals
with sensitivity analysis of the said project deals with the abnormal returns earned by the company
on account of announcement of said project. The breakup of the content of the report:
(a) Computation of Net Present Value of the project;
(b) Sensitivity Analysis of the project;
(c) Abnormal Returns: Semi Strong Form of Market Hypothesis.
Net Present Value
Under the said tool of Capital Budgeting, the present value of the cash flows of the project by a
particular discount rate usually Weighted Average Cost of Capital of the company is reduced by the
initial outlay of the project. If the computation is positive, then the project is viable otherwise not.
Further, the higher the value, the more lucrative the project is.
Assumptions involved under the computation
(a) The cash flow assumed holds good;
(b) The cost incurred for installation and shipping of machinery has been considered a cost of the
asset in terms of AASB and accordingly the same has been depreciated using Written down
value method over the period of 10 years;
(c) Yield of debentures has not been considered for analysis as bond market value is not required
as debt to equity ratio has been stated in the question.
(d) The maturity period of bond has not been considered for analysis.
NPV Analysis
On perusal of the appendix 1, it shall be seen that the proposed project has a positive Net present
value which is significantly beneficial for the company and the company shall execute the same as t
it shall add value to the company. Further, it shall be pertinent to note that the said computation
has been derived in the following manner:
(a) Cost of Machinery has been considered by including shipping and installation cost;
(b) Machinery has been depreciated using declining balance method @20%;
(c) Revenue has been expected to increase @10%;
(d) Variable cost has been considered 40% of expenditure;
(e) Opportunity loss has been considered for computation of net present value;
(f) Tax has been deducted from Operating Cash flow @30%;
(g) There has been adjustment on account of changes in Working Capital on account of execution
of the proposed project ;
(h) Machine has been sold at the end of the period and tax impact on the same has been
considered. For detailed analysis refer Appendix 1;
(i) Beta has been computed based on time series and regression analysis;
(j) The discounting factor has been taken at Weighted Average Cost of Capital of the company i.e.
11.54%.
4
Paraphrase This Document
Need a fresh take? Get an instant paraphrase of this document with our AI Paraphraser
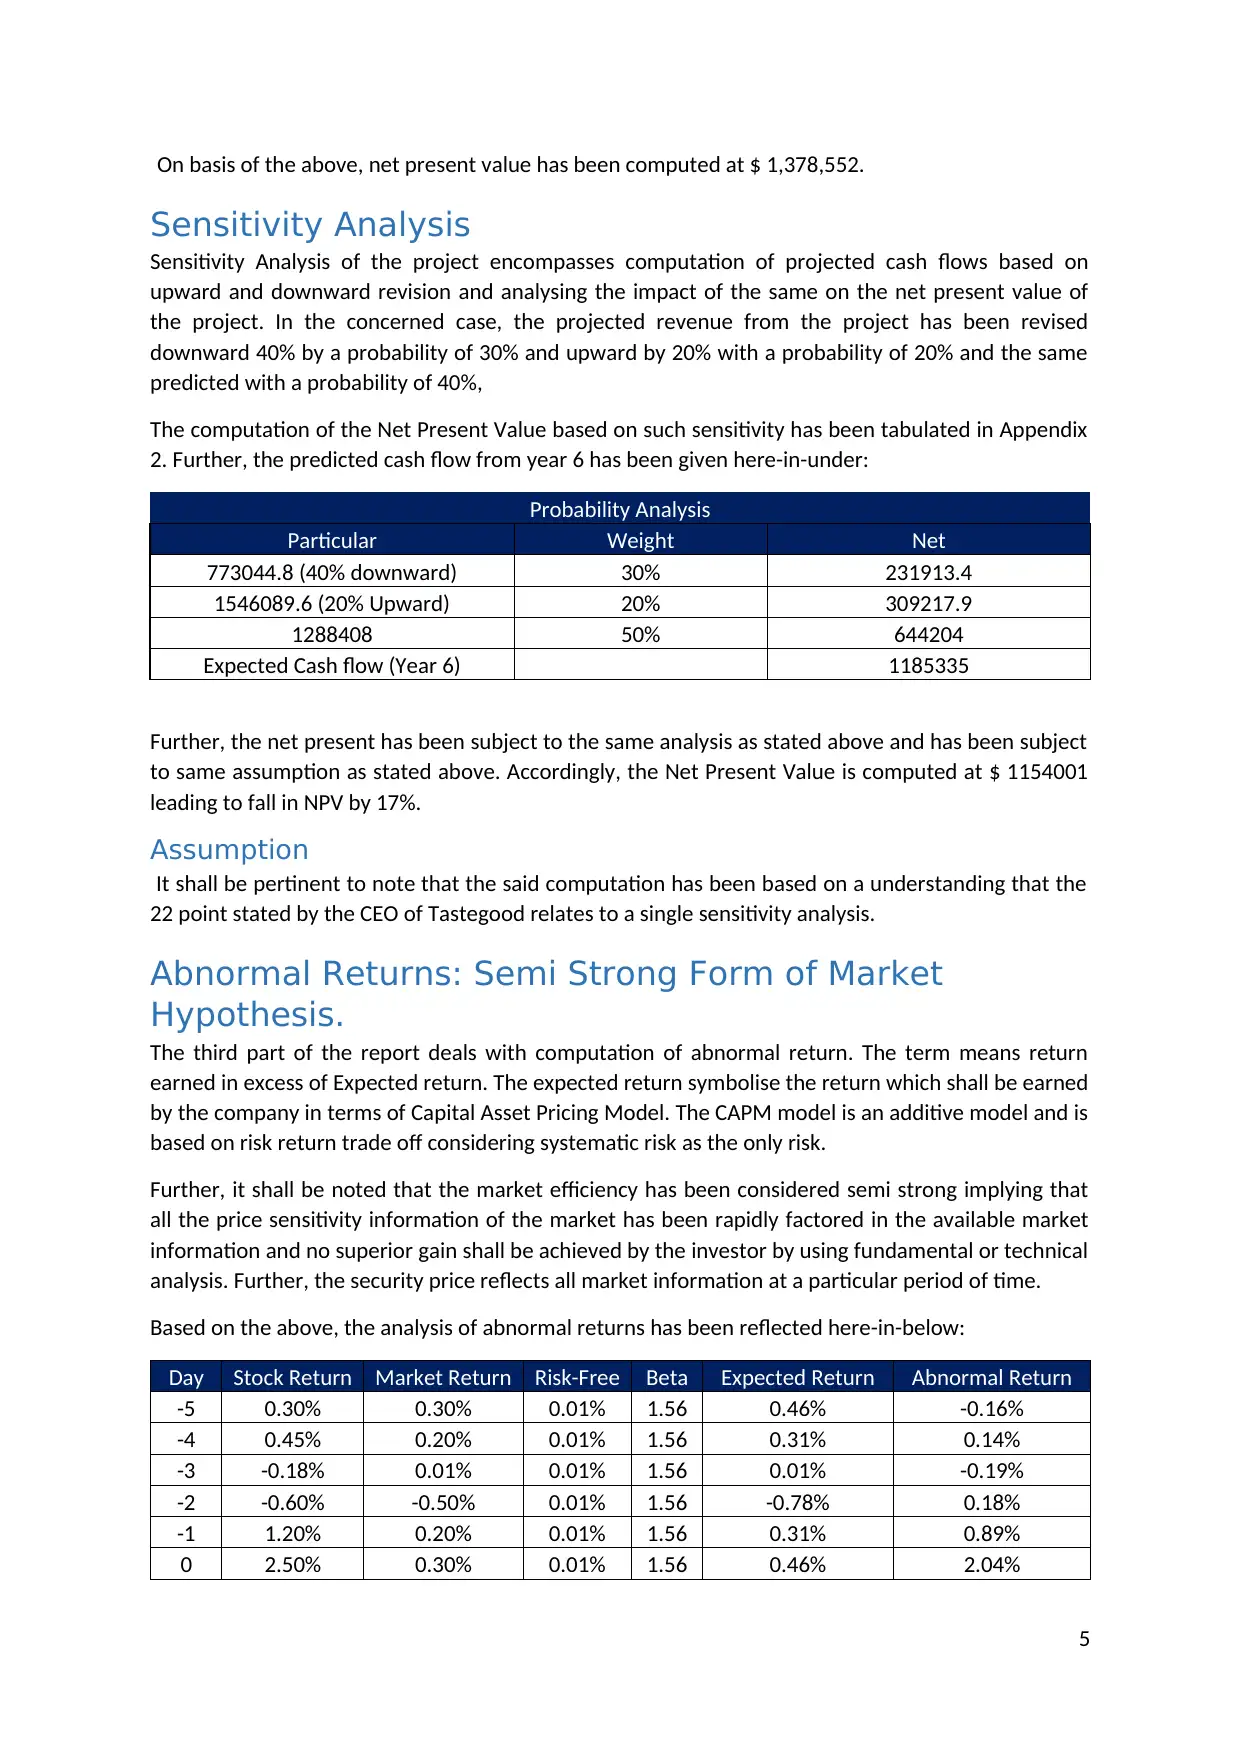
On basis of the above, net present value has been computed at $ 1,378,552.
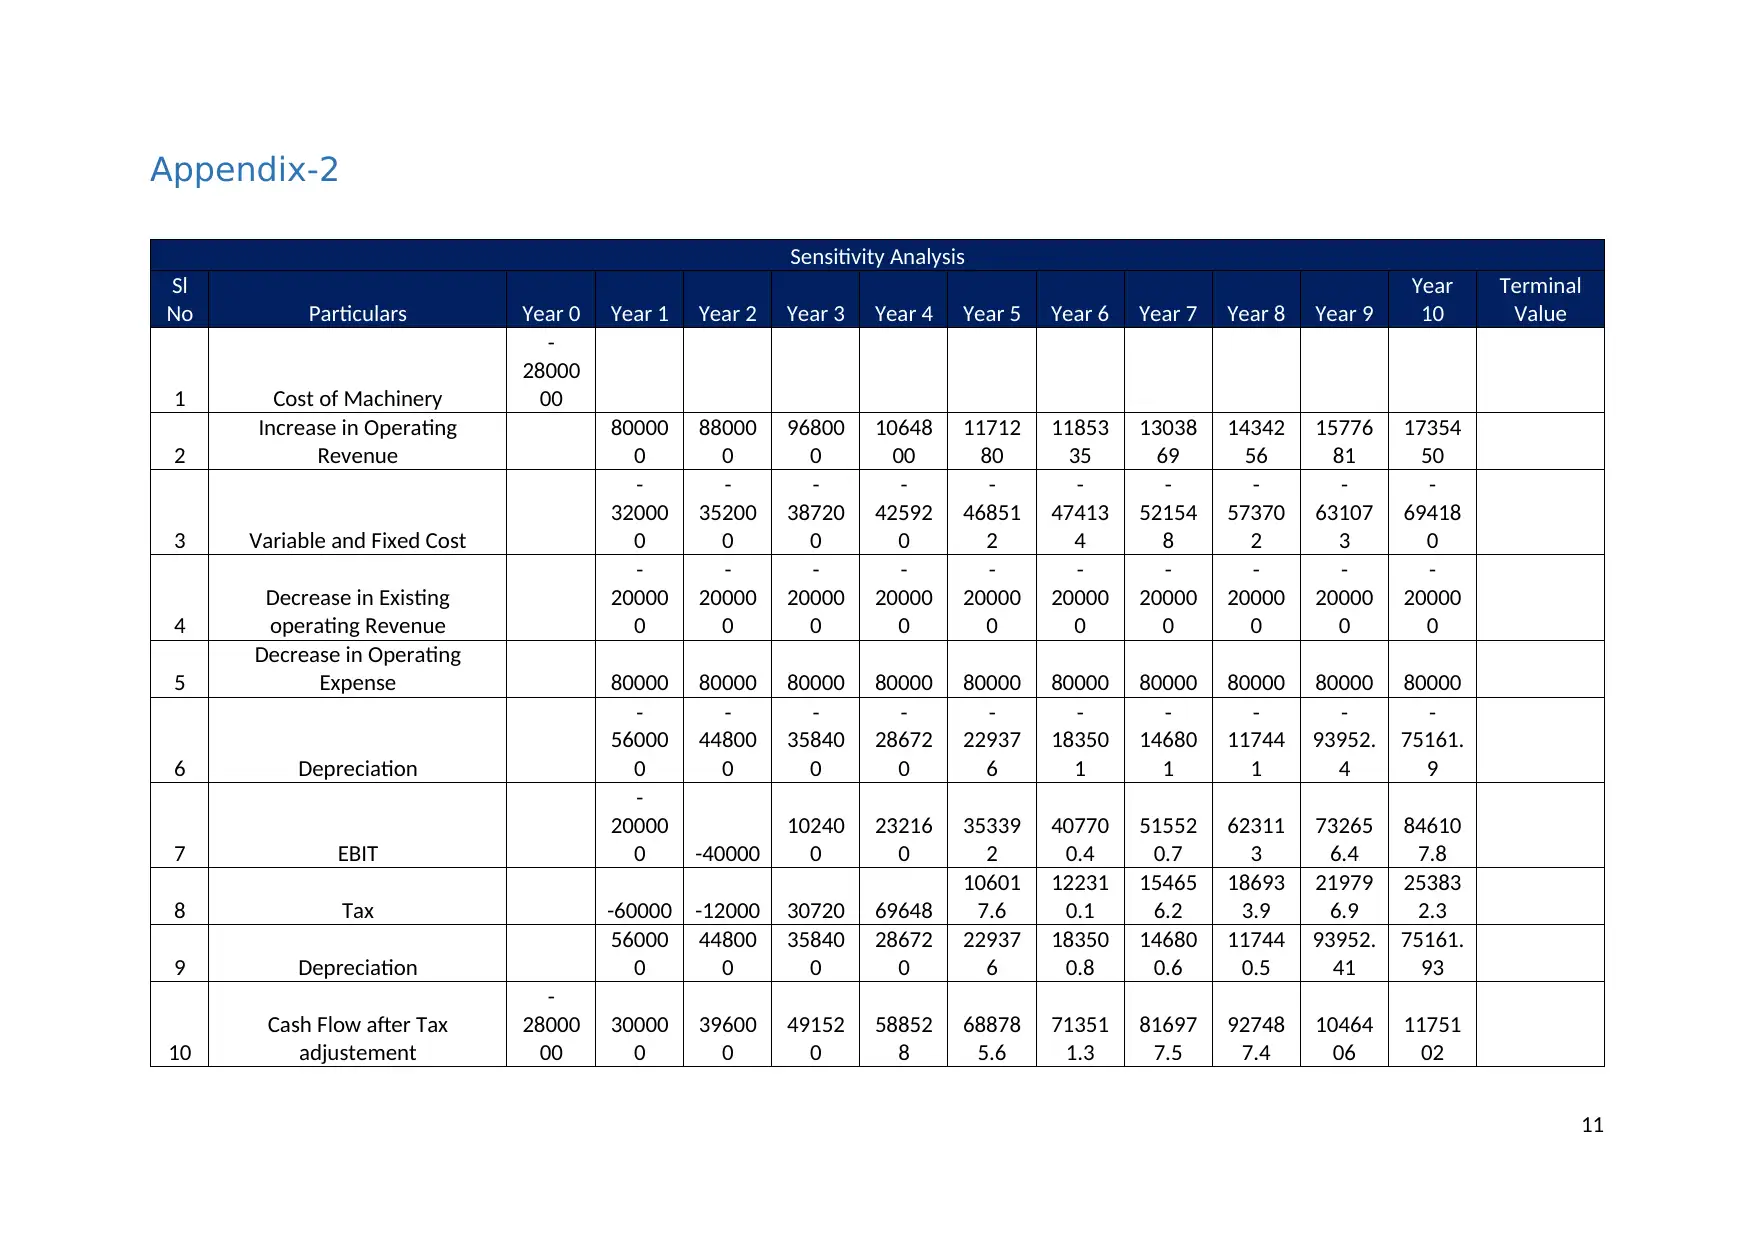
Sensitivity Analysis
Sensitivity Analysis of the project encompasses computation of projected cash flows based on
upward and downward revision and analysing the impact of the same on the net present value of
the project. In the concerned case, the projected revenue from the project has been revised
downward 40% by a probability of 30% and upward by 20% with a probability of 20% and the same
predicted with a probability of 40%,
The computation of the Net Present Value based on such sensitivity has been tabulated in Appendix
2. Further, the predicted cash flow from year 6 has been given here-in-under:
Probability Analysis
Particular Weight Net
773044.8 (40% downward) 30% 231913.4
1546089.6 (20% Upward) 20% 309217.9
1288408 50% 644204
Expected Cash flow (Year 6) 1185335
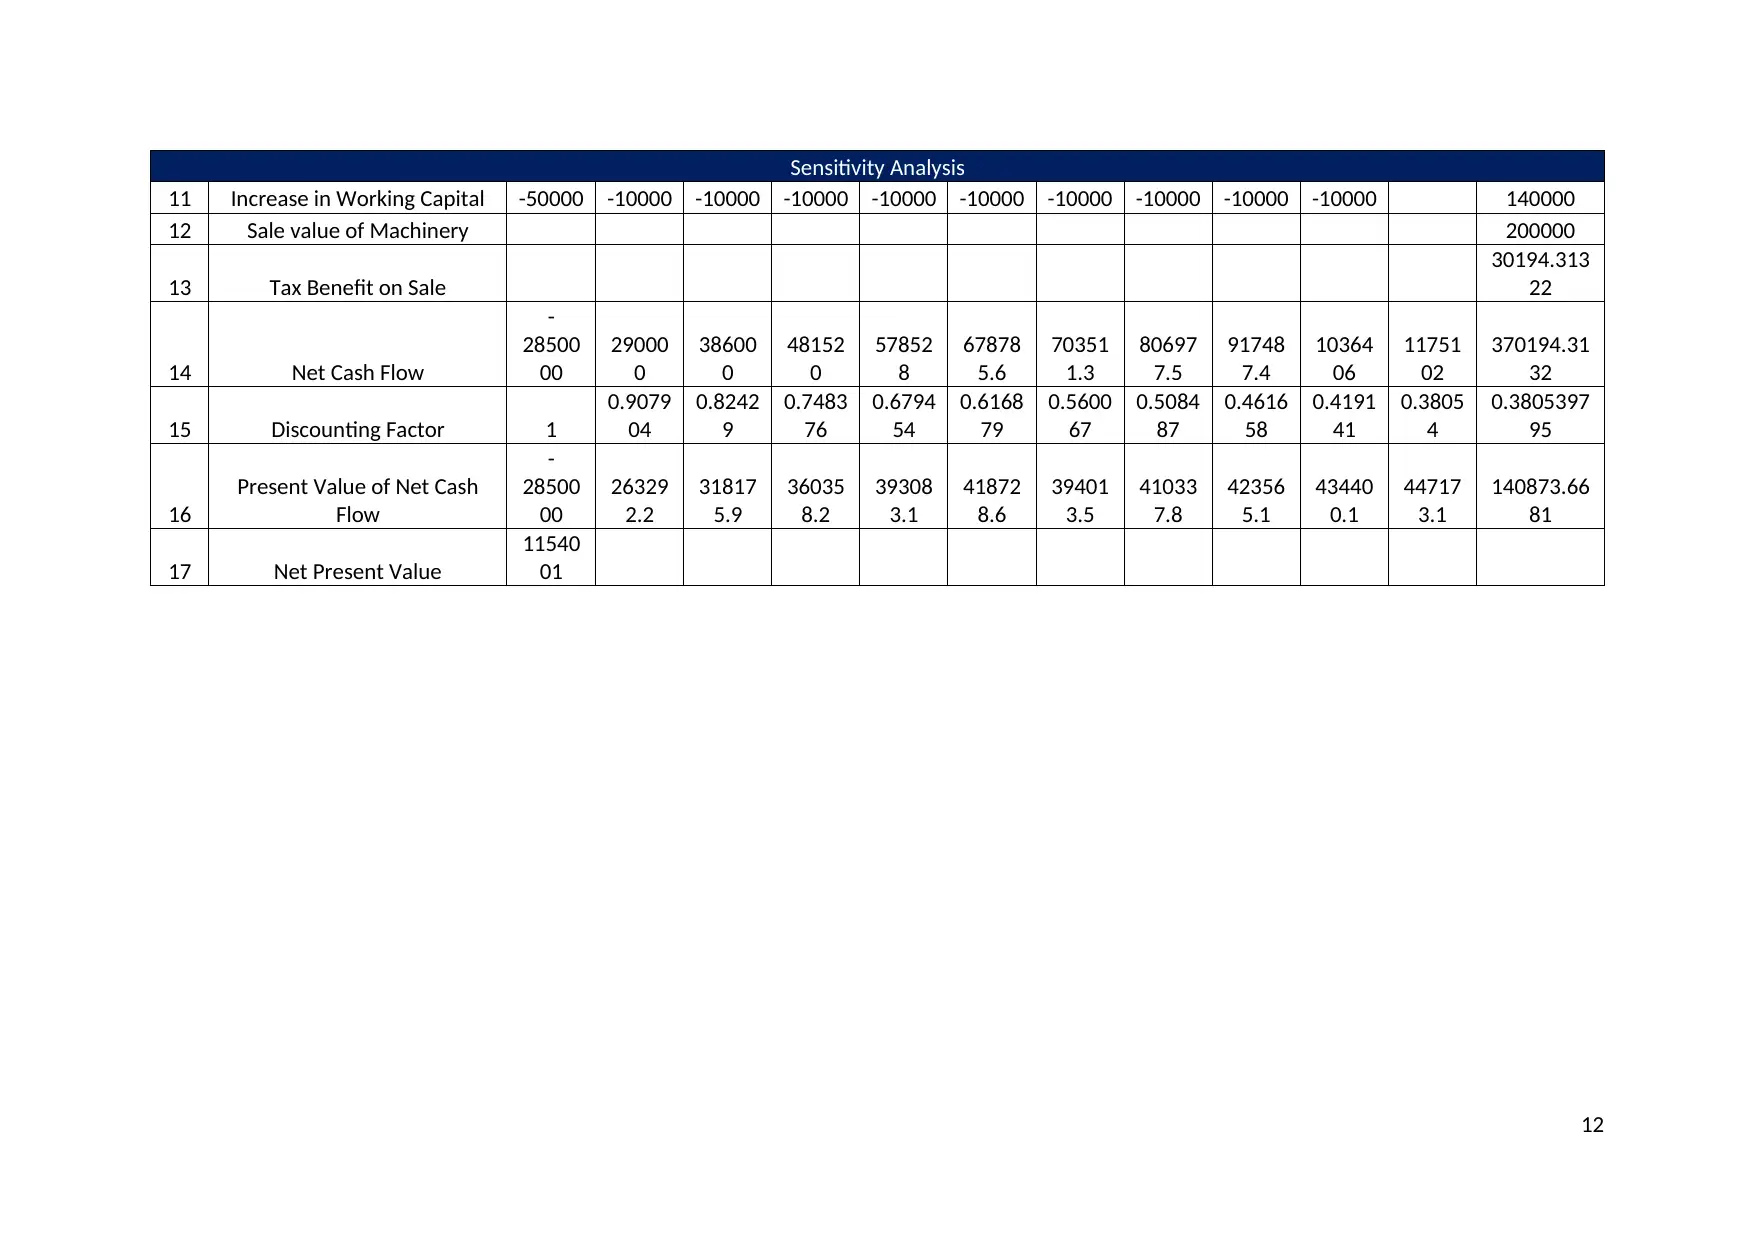
Further, the net present has been subject to the same analysis as stated above and has been subject
to same assumption as stated above. Accordingly, the Net Present Value is computed at $ 1154001
leading to fall in NPV by 17%.
Assumption
It shall be pertinent to note that the said computation has been based on a understanding that the
22 point stated by the CEO of Tastegood relates to a single sensitivity analysis.
Abnormal Returns: Semi Strong Form of Market
Hypothesis.
The third part of the report deals with computation of abnormal return. The term means return
earned in excess of Expected return. The expected return symbolise the return which shall be earned
by the company in terms of Capital Asset Pricing Model. The CAPM model is an additive model and is
based on risk return trade off considering systematic risk as the only risk.
Further, it shall be noted that the market efficiency has been considered semi strong implying that
all the price sensitivity information of the market has been rapidly factored in the available market
information and no superior gain shall be achieved by the investor by using fundamental or technical
analysis. Further, the security price reflects all market information at a particular period of time.
Based on the above, the analysis of abnormal returns has been reflected here-in-below:
Day Stock Return Market Return Risk-Free Beta Expected Return Abnormal Return
-5 0.30% 0.30% 0.01% 1.56 0.46% -0.16%
-4 0.45% 0.20% 0.01% 1.56 0.31% 0.14%
-3 -0.18% 0.01% 0.01% 1.56 0.01% -0.19%
-2 -0.60% -0.50% 0.01% 1.56 -0.78% 0.18%
-1 1.20% 0.20% 0.01% 1.56 0.31% 0.89%
0 2.50% 0.30% 0.01% 1.56 0.46% 2.04%
5
Sensitivity Analysis
Sensitivity Analysis of the project encompasses computation of projected cash flows based on
upward and downward revision and analysing the impact of the same on the net present value of
the project. In the concerned case, the projected revenue from the project has been revised
downward 40% by a probability of 30% and upward by 20% with a probability of 20% and the same
predicted with a probability of 40%,
The computation of the Net Present Value based on such sensitivity has been tabulated in Appendix
2. Further, the predicted cash flow from year 6 has been given here-in-under:
Probability Analysis
Particular Weight Net
773044.8 (40% downward) 30% 231913.4
1546089.6 (20% Upward) 20% 309217.9
1288408 50% 644204
Expected Cash flow (Year 6) 1185335
Further, the net present has been subject to the same analysis as stated above and has been subject
to same assumption as stated above. Accordingly, the Net Present Value is computed at $ 1154001
leading to fall in NPV by 17%.
Assumption
It shall be pertinent to note that the said computation has been based on a understanding that the
22 point stated by the CEO of Tastegood relates to a single sensitivity analysis.
Abnormal Returns: Semi Strong Form of Market
Hypothesis.
The third part of the report deals with computation of abnormal return. The term means return
earned in excess of Expected return. The expected return symbolise the return which shall be earned
by the company in terms of Capital Asset Pricing Model. The CAPM model is an additive model and is
based on risk return trade off considering systematic risk as the only risk.
Further, it shall be noted that the market efficiency has been considered semi strong implying that
all the price sensitivity information of the market has been rapidly factored in the available market
information and no superior gain shall be achieved by the investor by using fundamental or technical
analysis. Further, the security price reflects all market information at a particular period of time.
Based on the above, the analysis of abnormal returns has been reflected here-in-below:
Day Stock Return Market Return Risk-Free Beta Expected Return Abnormal Return
-5 0.30% 0.30% 0.01% 1.56 0.46% -0.16%
-4 0.45% 0.20% 0.01% 1.56 0.31% 0.14%
-3 -0.18% 0.01% 0.01% 1.56 0.01% -0.19%
-2 -0.60% -0.50% 0.01% 1.56 -0.78% 0.18%
-1 1.20% 0.20% 0.01% 1.56 0.31% 0.89%
0 2.50% 0.30% 0.01% 1.56 0.46% 2.04%
5
Day Stock Return Market Return Risk-Free Beta Expected Return Abnormal Return
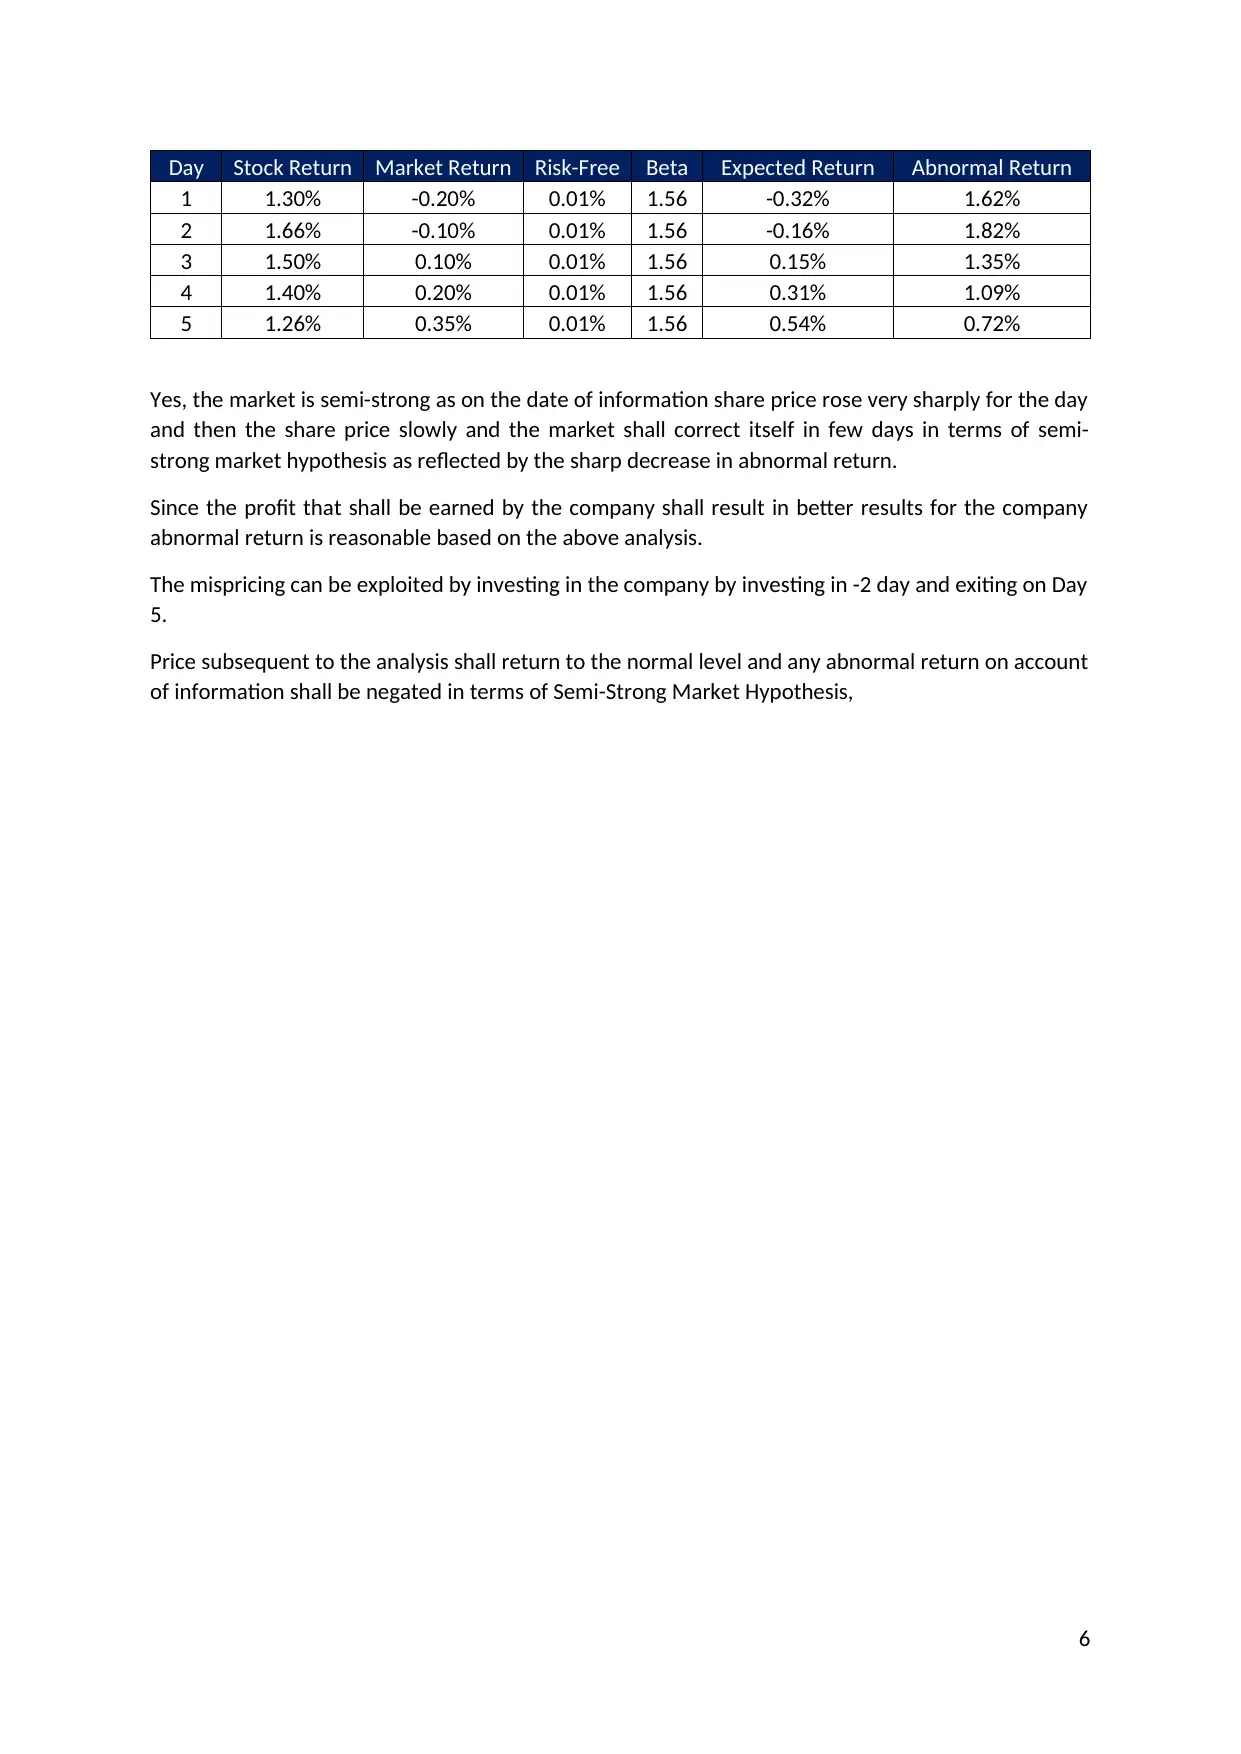
1 1.30% -0.20% 0.01% 1.56 -0.32% 1.62%
2 1.66% -0.10% 0.01% 1.56 -0.16% 1.82%
3 1.50% 0.10% 0.01% 1.56 0.15% 1.35%
4 1.40% 0.20% 0.01% 1.56 0.31% 1.09%
5 1.26% 0.35% 0.01% 1.56 0.54% 0.72%
Yes, the market is semi-strong as on the date of information share price rose very sharply for the day
and then the share price slowly and the market shall correct itself in few days in terms of semi-
strong market hypothesis as reflected by the sharp decrease in abnormal return.
Since the profit that shall be earned by the company shall result in better results for the company
abnormal return is reasonable based on the above analysis.
The mispricing can be exploited by investing in the company by investing in -2 day and exiting on Day
5.
Price subsequent to the analysis shall return to the normal level and any abnormal return on account
of information shall be negated in terms of Semi-Strong Market Hypothesis,
6
⊘ This is a preview!⊘
Do you want full access?
Subscribe today to unlock all pages.
Trusted by 1+ million students worldwide
Appendix-1
Sl
No Particulars Year 0 Year 1 Year 2 Year 3 Year 4 Year 5 Year 6 Year 7 Year 8 Year 9 Year
10
Terminal
Value
1 Cost of Machinery
-
28000
00
2 Increase in Operating
Revenue
80000
0
88000
0
96800
0
10648
00
11712
80
12884
08
14172
49
15589
74
17148
71
18863
58
3 Variable and Fixed Cost
-
32000
0
-
35200
0
-
38720
0
-
42592
0
-
46851
2
-
51536
3
-
56690
0
-
62358
9
-
68594
8
-
75454
3
4 Decrease in Existing
operating Revenue
-
20000
0
-
20000
0
-
20000
0
-
20000
0
-
20000
0
-
20000
0
-
20000
0
-
20000
0
-
20000
0
-
20000
0
5 Decrease in Operating
Expense 80000 80000 80000 80000 80000 80000 80000 80000 80000 80000
6 Depreciation
-
56000
0
-
44800
0
-
35840
0
-
28672
0
-
22937
6
-
18350
1
-
14680
1
-
11744
1
-
93952.
4
-
75161.
9
7 EBIT
-
20000
0
-40000 10240
0
23216
0
35339
2
46954
4
58354
8.6
69794
3.7
81497
0.2
93665
3
8 Tax -60000 -12000 30720 69648 10601
7.6
14086
3.2
17506
4.6
20938
3.1
24449
1.1
28099
5.9
9 Depreciation 56000
0
44800
0
35840
0
28672
0
22937
6
18350
0.8
14680
0.6
11744
0.5
93952.
41
75161.
93
10 Cash Flow after Tax
adjustement
-
28000
00
30000
0
39600
0
49152
0
58852
8
68878
5.6
79390
8
90541
3.9
10247
67
11534
14
12928
11
11 Increase in Working Capital -50000 -10000 -10000 -10000 -10000 -10000 -10000 -10000 -10000 -10000 140000
12 Sale value of Machinery 200000
7
Paraphrase This Document
Need a fresh take? Get an instant paraphrase of this document with our AI Paraphraser
Sl
No Particulars Year 0 Year 1 Year 2 Year 3 Year 4 Year 5 Year 6 Year 7 Year 8 Year 9 Year
10
Terminal
Value
13 Tax Benefit on Sale 30194.313
22
14 Net Cash Flow
-
28500
00
29000
0
38600
0
48152
0
57852
8
67878
5.6
78390
8
89541
3.9
10147
67
11434
14
12928
11
370194.31
32
15 Discounting Factor 1 0.9079
04
0.8242
9
0.7483
76
0.6794
54
0.6168
79
0.5600
67
0.5084
87
0.4616
58
0.4191
41
0.3805
4
0.3805397
95
16 Present Value of Net Cash
Flow
-
28500
00
26329
2.2
31817
5.9
36035
8.2
39308
3.1
41872
8.6
43904
1.1
45530
6.5
46847
5.1
47925
1.5
49196
5.9
140873.66
81
17 Net Present Value 13785
52
Computation of Depreciation
Sl No Particulars Amount
1 Opening Balance 2800000
2 Depreciation of Year 1 560000
3 Closing Balance of Year 1 2240000
4 Depreciation of Year 2 448000
5 Closing Balance of Year 2 1792000
6 Depreciation of Year 3 358400
7 Closing Balance of Year 3 1433600
8 Depreciation of Year 4 286720
9 Closing Balance of Year 4 1146880
10 Depreciation of Year 5 229376
11 Closing Balance of Year 5 917504
12 Depreciation of Year 6 183500.8
8
Computation of Depreciation
Sl No Particulars Amount
13 Closing Balance of Year 6 734003.2
14 Depreciation of Year 7 146800.6
15 Closing Balance of Year 7 587202.6
16 Depreciation of Year 8 117440.5
17 Closing Balance of Year 8 469762
18 Depreciation of Year 9 93952.41
19 Closing Balance of Year 9 375809.6
20 Depreciation of Year 10 75161.93
21 Closing Balance of Year 10 300647.7
22 Sale value 200000
23 Loss 100647.7
24 Tax Impact 30194.31
Computation of Beta
Year Taste Good Market Risk Free Rate
1998 5.64% 10.43% 5.49%
1999 23.13% 13.81% 6.01%
2000 19.55% 12.77% 6.31%
2001 10.08% 7.65% 5.62%
2002 -19.35% -10.64% 5.84%
2003 25.01% 14.61% 5.37%
2004 29.21% 29.48% 5.59%
2005 28.41% 23.83% 5.34%
2006 22.29% 20.93% 5.59%
2007 -5.68% 1.73% 5.99%
2008 -68.09% -33.58% 5.82%
9
⊘ This is a preview!⊘
Do you want full access?
Subscribe today to unlock all pages.
Trusted by 1+ million students worldwide
Computation of Beta
2009 48.21% 33.84% 5.04%
2010 12.39% 8.03% 5.37%
2011 -6.54% -6.43% 4.88%
2012 15.28% 18.56% 3.38%
2013 -1.12% 10.38% 3.70%
2014 17.98% 11.67% 3.66%
2015 -15.44% -6.43% 2.71%
2016 26.23% 16.29% 2.34%
2017 0.20% 5.70% 2.72%
Mean 8.37% 9.13% 4.84%
Standard Deviation 24.58% 15.16% 1.26%
Covariance 3.59%
Beta 1.56
Computation of Weighted Average Cost of Capital
Sl No Particulars Rate Tax Net Rate Weight Net
1 Debentures 12% 30% 8.4% 0.8 6.7%
2 Equity 11.54% 11.54% 1 11.5%
1.80 18.3%
3 WACC 10.14%
Computation of cost of Equity
Sl No Particulars Rate
1 Risk Free rate 4.84%
2 Risk Premium 4.29%
3 Beta 1.56
4 Cost of Equity 11.54%
10
Paraphrase This Document
Need a fresh take? Get an instant paraphrase of this document with our AI Paraphraser
Appendix-2
Sensitivity Analysis
Sl
No Particulars Year 0 Year 1 Year 2 Year 3 Year 4 Year 5 Year 6 Year 7 Year 8 Year 9
Year
10
Terminal
Value
1 Cost of Machinery
-
28000
00
2
Increase in Operating
Revenue
80000
0
88000
0
96800
0
10648
00
11712
80
11853
35
13038
69
14342
56
15776
81
17354
50
3 Variable and Fixed Cost
-
32000
0
-
35200
0
-
38720
0
-
42592
0
-
46851
2
-
47413
4
-
52154
8
-
57370
2
-
63107
3
-
69418
0
4
Decrease in Existing
operating Revenue
-
20000
0
-
20000
0
-
20000
0
-
20000
0
-
20000
0
-
20000
0
-
20000
0
-
20000
0
-
20000
0
-
20000
0
5
Decrease in Operating
Expense 80000 80000 80000 80000 80000 80000 80000 80000 80000 80000
6 Depreciation
-
56000
0
-
44800
0
-
35840
0
-
28672
0
-
22937
6
-
18350
1
-
14680
1
-
11744
1
-
93952.
4
-
75161.
9
7 EBIT
-
20000
0 -40000
10240
0
23216
0
35339
2
40770
0.4
51552
0.7
62311
3
73265
6.4
84610
7.8
8 Tax -60000 -12000 30720 69648
10601
7.6
12231
0.1
15465
6.2
18693
3.9
21979
6.9
25383
2.3
9 Depreciation
56000
0
44800
0
35840
0
28672
0
22937
6
18350
0.8
14680
0.6
11744
0.5
93952.
41
75161.
93
10
Cash Flow after Tax
adjustement
-
28000
00
30000
0
39600
0
49152
0
58852
8
68878
5.6
71351
1.3
81697
7.5
92748
7.4
10464
06
11751
02
11
Sensitivity Analysis
11 Increase in Working Capital -50000 -10000 -10000 -10000 -10000 -10000 -10000 -10000 -10000 -10000 140000
12 Sale value of Machinery 200000
13 Tax Benefit on Sale
30194.313
22
14 Net Cash Flow
-
28500
00
29000
0
38600
0
48152
0
57852
8
67878
5.6
70351
1.3
80697
7.5
91748
7.4
10364
06
11751
02
370194.31
32
15 Discounting Factor 1
0.9079
04
0.8242
9
0.7483
76
0.6794
54
0.6168
79
0.5600
67
0.5084
87
0.4616
58
0.4191
41
0.3805
4
0.3805397
95
16
Present Value of Net Cash
Flow
-
28500
00
26329
2.2
31817
5.9
36035
8.2
39308
3.1
41872
8.6
39401
3.5
41033
7.8
42356
5.1
43440
0.1
44717
3.1
140873.66
81
17 Net Present Value
11540
01
12
⊘ This is a preview!⊘
Do you want full access?
Subscribe today to unlock all pages.
Trusted by 1+ million students worldwide
1 out of 12
Related Documents


Your All-in-One AI-Powered Toolkit for Academic Success.
+13062052269
info@desklib.com
Available 24*7 on WhatsApp / Email
![[object Object]](/_next/static/media/star-bottom.7253800d.svg)
Unlock your academic potential
Copyright © 2020–2026 A2Z Services. All Rights Reserved. Developed and managed by ZUCOL.