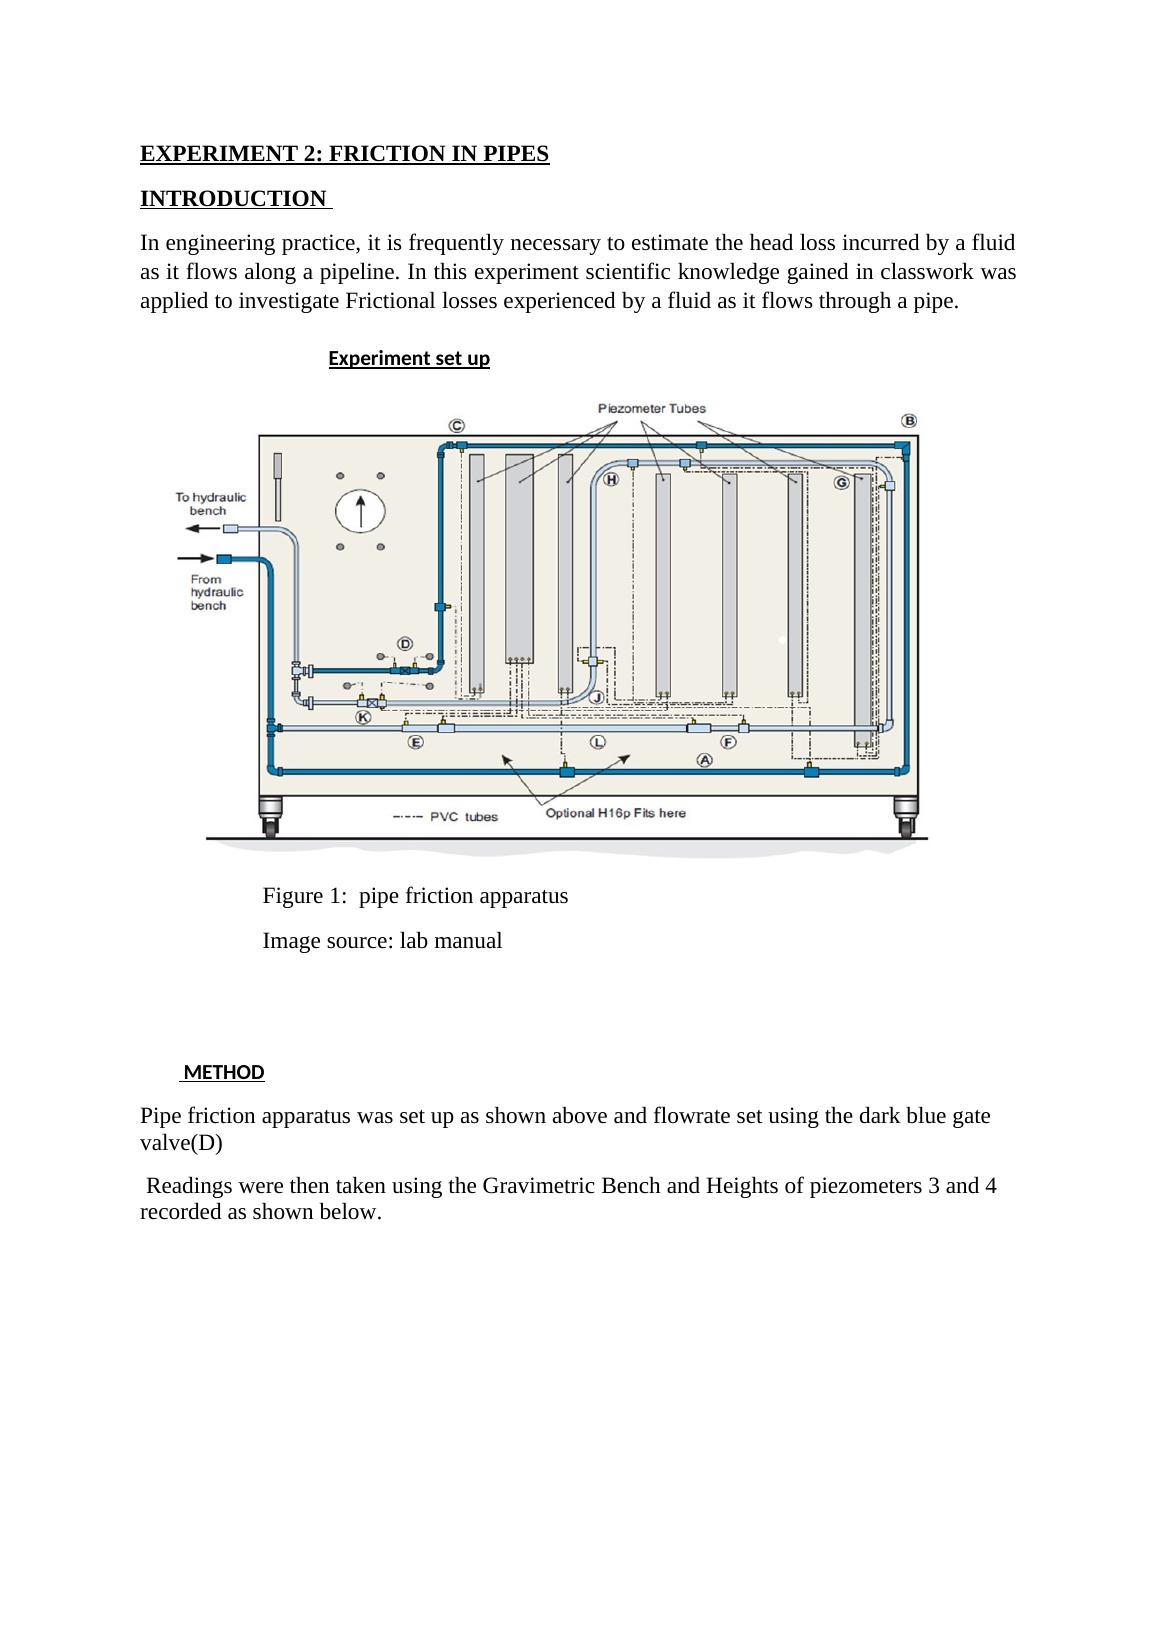
Experiment : Friction in Pipes
This document provides experimental results for the resit coursework in Mechanical Science at Coventry University.
20 Pages1764 Words43 Views
Added on 2022-08-24
Experiment : Friction in Pipes
This document provides experimental results for the resit coursework in Mechanical Science at Coventry University.
Added on 2022-08-24
ShareRelated Documents
End of preview
Want to access all the pages? Upload your documents or become a member.
Thermodynamics and Fluid Mechanics: Solutions and Calculations
|8
|775
|298