Experimental Design and Analysis pdf
23 Pages3117 Words186 Views
Added on 2020-12-09
Experimental Design and Analysis pdf
Added on 2020-12-09
ShareRelated Documents
Experiment Design & Result Analysis

Table of ContentsINTRODUCTION...........................................................................................................................3TASKS.............................................................................................................................................31. Collecting the data for experiment..........................................................................................32. Design and Implement ion of data .........................................................................................53. Experiment designing and implementation.............................................................................84. Implementation and design...................................................................................................10CONCLUSION..............................................................................................................................18REFERENCES..............................................................................................................................19
List of FiguresIllustration 1: Data pre- processing stages ......................................................................................7Illustration 2: level for creating Questionnaire................................................................................9Illustration 3: Pie charts of Age Limits..........................................................................................13Illustration 4: Pie charts of sex.......................................................................................................13Illustration 5: Pie chart of Background..........................................................................................14Illustration 6: Pie Chart of body part affected...............................................................................15Illustration 7: Pie chart of Health issue..........................................................................................16Illustration 8: Graphical representation of responses.....................................................................17Illustration 9: Pie charts of responses in Percentage (%)...............................................................18
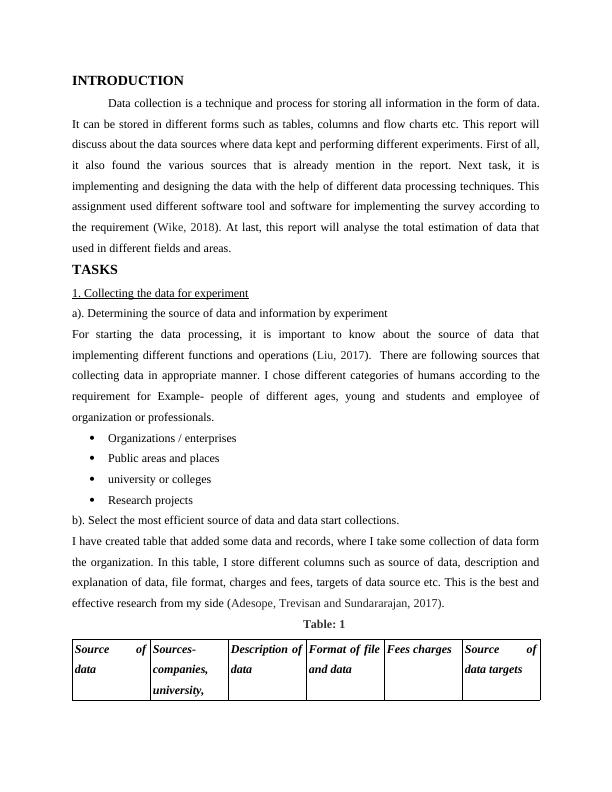
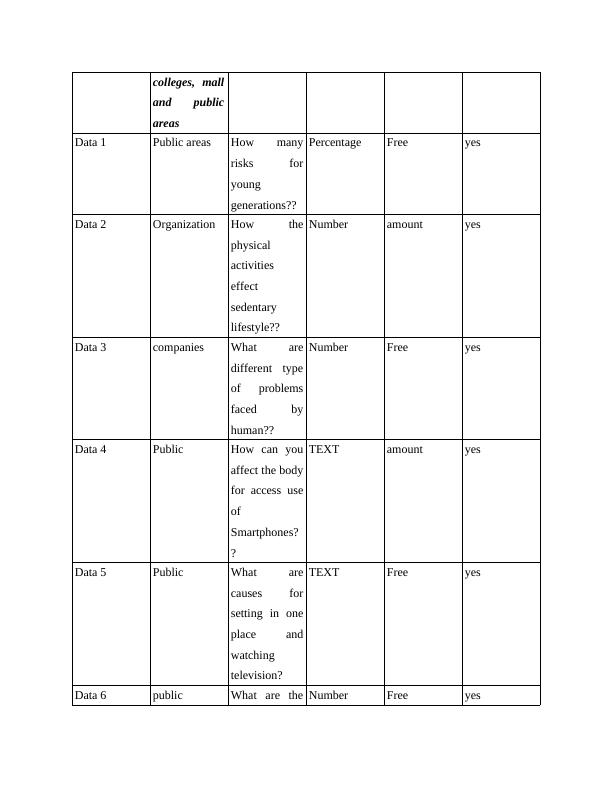
INTRODUCTIONData collection is a technique and process for storing all information in the form of data.It can be stored in different forms such as tables, columns and flow charts etc. This report willdiscuss about the data sources where data kept and performing different experiments. First of all,it also found the various sources that is already mention in the report. Next task, it isimplementing and designing the data with the help of different data processing techniques. Thisassignment used different software tool and software for implementing the survey according tothe requirement (Wike, 2018). At last, this report will analyse the total estimation of data thatused in different fields and areas. TASKS1. Collecting the data for experimenta). Determining the source of data and information by experimentFor starting the data processing, it is important to know about the source of data thatimplementing different functions and operations (Liu, 2017). There are following sources thatcollecting data in appropriate manner. I chose different categories of humans according to therequirement for Example- people of different ages, young and students and employee oforganization or professionals.Organizations / enterprisesPublic areas and placesuniversity or collegesResearch projectsb). Select the most efficient source of data and data start collections.I have created table that added some data and records, where I take some collection of data formthe organization. In this table, I store different columns such as source of data, description andexplanation of data, file format, charges and fees, targets of data source etc. This is the best andeffective research from my side (Adesope, Trevisan and Sundararajan, 2017). Table: 1Source ofdataSources-companies,university,Description ofdataFormat of fileand dataFees chargesSource ofdata targets
colleges, malland publicareasData 1Public areasHow manyrisks foryounggenerations??PercentageFreeyesData 2OrganizationHow thephysicalactivitieseffectsedentarylifestyle??NumberamountyesData 3companiesWhat aredifferent typeof problemsfaced byhuman??NumberFreeyesData 4PublicHow can youaffect the bodyfor access useofSmartphones??TEXTamountyesData 5PublicWhat arecauses forsetting in oneplace andwatchingtelevision?TEXTFreeyesData 6publicWhat are theNumberFreeyes
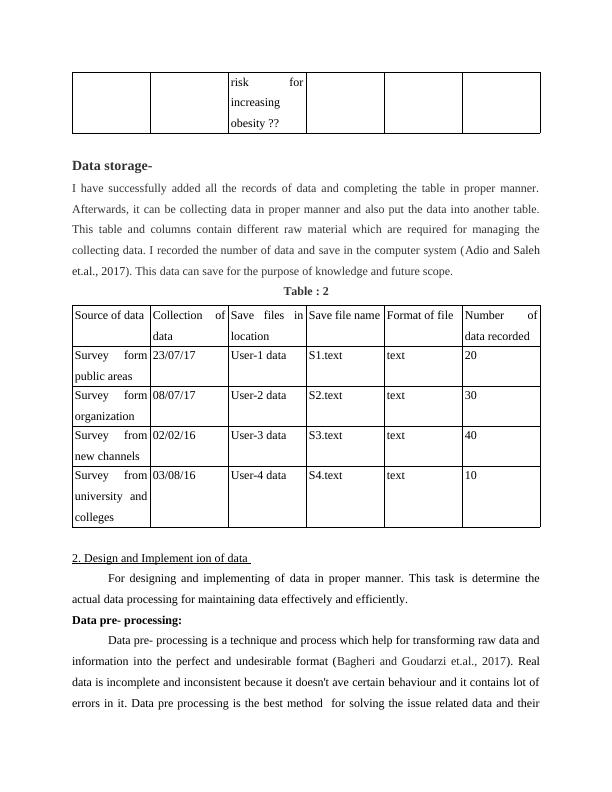
risk forincreasingobesity ??Data storage- I have successfully added all the records of data and completing the table in proper manner.Afterwards, it can be collecting data in proper manner and also put the data into another table.This table and columns contain different raw material which are required for managing thecollecting data. I recorded the number of data and save in the computer system (Adio and Salehet.al., 2017). This data can save for the purpose of knowledge and future scope. Table : 2Source of dataCollection ofdataSave files inlocationSave file nameFormat of fileNumber ofdata recordedSurvey formpublic areas23/07/17User-1 dataS1.texttext20Survey formorganization08/07/17User-2 dataS2.texttext30Survey fromnew channels02/02/16User-3 dataS3.texttext40Survey fromuniversity andcolleges03/08/16User-4 dataS4.texttext102. Design and Implement ion of data For designing and implementing of data in proper manner. This task is determine theactual data processing for maintaining data effectively and efficiently. Data pre- processing:Data pre- processing is a technique and process which help for transforming raw data andinformation into the perfect and undesirable format (Bagheri and Goudarzi et.al., 2017). Realdata is incomplete and inconsistent because it doesn't ave certain behaviour and it contains lot oferrors in it. Data pre processing is the best method for solving the issue related data and their
End of preview
Want to access all the pages? Upload your documents or become a member.
Related Documents
NIT6130 Introduction to Research Assignmentlg...
|22
|2345
|37
How the Quality of Sleep Affects the Stress Level of IT Employees in USAlg...
|13
|2198
|400
Introduction to Research: Collection, Design, and Implementation of Experimentlg...
|24
|3049
|393
IOT in Business Organization: Data Collection, Storage, Design and Implementationlg...
|16
|2172
|159
Bio-inspired Communications and IoT: Data Collection, Storage, Design and Implementationlg...
|16
|1975
|236
Introduction to Research Assignment 4 - Experimental Design & ReSULT AnalySIS by Rachid Hamadi Student ID: 30099999lg...
|13
|2999
|404