Physics Experiment Report: Determining Absolute Zero and Ideal Gas Law
VerifiedAdded on 2020/04/15
|12
|2591
|208
Report
AI Summary
This experiment report details an investigation into absolute zero and the ideal gas law. The experiment involved measuring the relationship between the volume and temperature of a gas. Two tests were conducted, one examining the change in length of trapped air with temperature, and the other measuring pressure changes. The results were analyzed to determine the experimental value of absolute zero and compare it with the accepted value. The report includes data analysis, error analysis, and a discussion of the ideal gas law principles, Boyle's and Charles's laws. It also calculates the number of moles of gas and percentage differences, offering insights into experimental errors and their impact on the accuracy of the results. The report concludes by summarizing the findings and highlighting the importance of careful experimental procedures.

EXPERIMENT REPORT 1
Name
Instructor
Name of the class
Institution
City and state
Date
Name
Instructor
Name of the class
Institution
City and state
Date
Paraphrase This Document
Need a fresh take? Get an instant paraphrase of this document with our AI Paraphraser
EXPERIMENT REPORT 2
Finding Absolute Zero
Abstract/Aim
The rationale of this report is to investigate the effect the volume of gas has on temperature and
pressure. The data obtained from the experiment will be used to compare the margin of error
between the accepted absolute zero and the one obtained from the experiment.
Introduction
Absolute zero is defined as the lowest possible temperature in which no substance can be colder
as well as no heat energy remains in that substance (Aad et al. 2014). Scientifically, this is the
point where the particles of nature have less motion during vibration, thus keeping the quantum
mechanical at zero point energy induced particle movement. Temperature wise, absolute zero is
273.15 kelvins which is equivalent to 0 0C. Using the Ideal gas law (Boyles and Charles) one can
find the absolute zero as well as the universal gas constant. The ideal gas law is given by the
expression
RV=n RT where;
P= pressure
V= volume
N= No. of moles
R= the universal gas constant
T= temperature expressed in kelvins
The universal gas constant is 8.31 J/mol.K but the values changes with regard to the units beings
used for either pressure or volume (Ariafar et al. 2016).
Specifically, this experiment will employ two parameters from the above expression, i.e.
temperature and volume. According to Boyle’s law, volume is pressure is inversely proportional
to volume (Pα 1/V), therefore when comparing say different gases and their volume, the
following expression can be used P1 V1=P2 V2 where;
P1 and V1 is the initial pressure and volume
P2 V2 is the final pressure and volume.
EXPERIMENT REPORT 3
On the other hand, that is according to the Charles law, the volume of a given mass of gas is
directly proportional to its absolute temperature. This is given by the following expression
Vα T
Vα K/T
Where K= V/T
Using or comparing two different volumes and temperature of gases the expression would be
V1/T1=V2/T2
Where V1T1 would denote the initial volume and temperature while V2T2 the final volume and
temperature. Therefore, combining the two gas laws would give the ideal gas equation that will
be used throughout in this experiment. However, the first part of the experiment involves use of
length and temperature to find or calculate the absolute which is then compared with the real or
the accepted absolute value. The second part is similar to the first, the only difference is that it
compares pressure with volume. This experiment is used to compare the actual absolute zero
from the calculated value as well as the gradient of the line and to calculate the number of moles
from the gradient obtained from the curve or the line of best fit. This report incorporates the ideal
gas law and absolute zero to help investigate how the volume of a gas occupies relates with
temperature as well as to further understanding of air as an ideal gas.
Hypothesis
What is the value of absolute zero in the first and second tests and how do they compare with the
accepted real values?
Method
Materials used in the experiment include;
1 30cm ruler
1 gas simple gas thermometer
6 glass beakers
Ice cubes
1 kettle
1 calibrated thermometer
⊘ This is a preview!⊘
Do you want full access?
Subscribe today to unlock all pages.
Trusted by 1+ million students worldwide
EXPERIMENT REPORT 4
Procedure
1. The room temperature was measured
2. The capillary tube, thermometer and ice were put in a beaker
3. The temperature plus the length of the air trapped inside the beaker were recorded
4. The values of length for different temperature as the ice water reaches room temperature
were also recorded
5. The beaker was emptied, kettle boiled where the beaker was filled again and the capillary
tube and the capillary tube and the thermometer put inside the beaker
6. Values of length for different temperature as water approaches room temperature were
recorded
7. The above experiment was repeated two times and the values recorded as shown in the table
below.
Part 1
Results
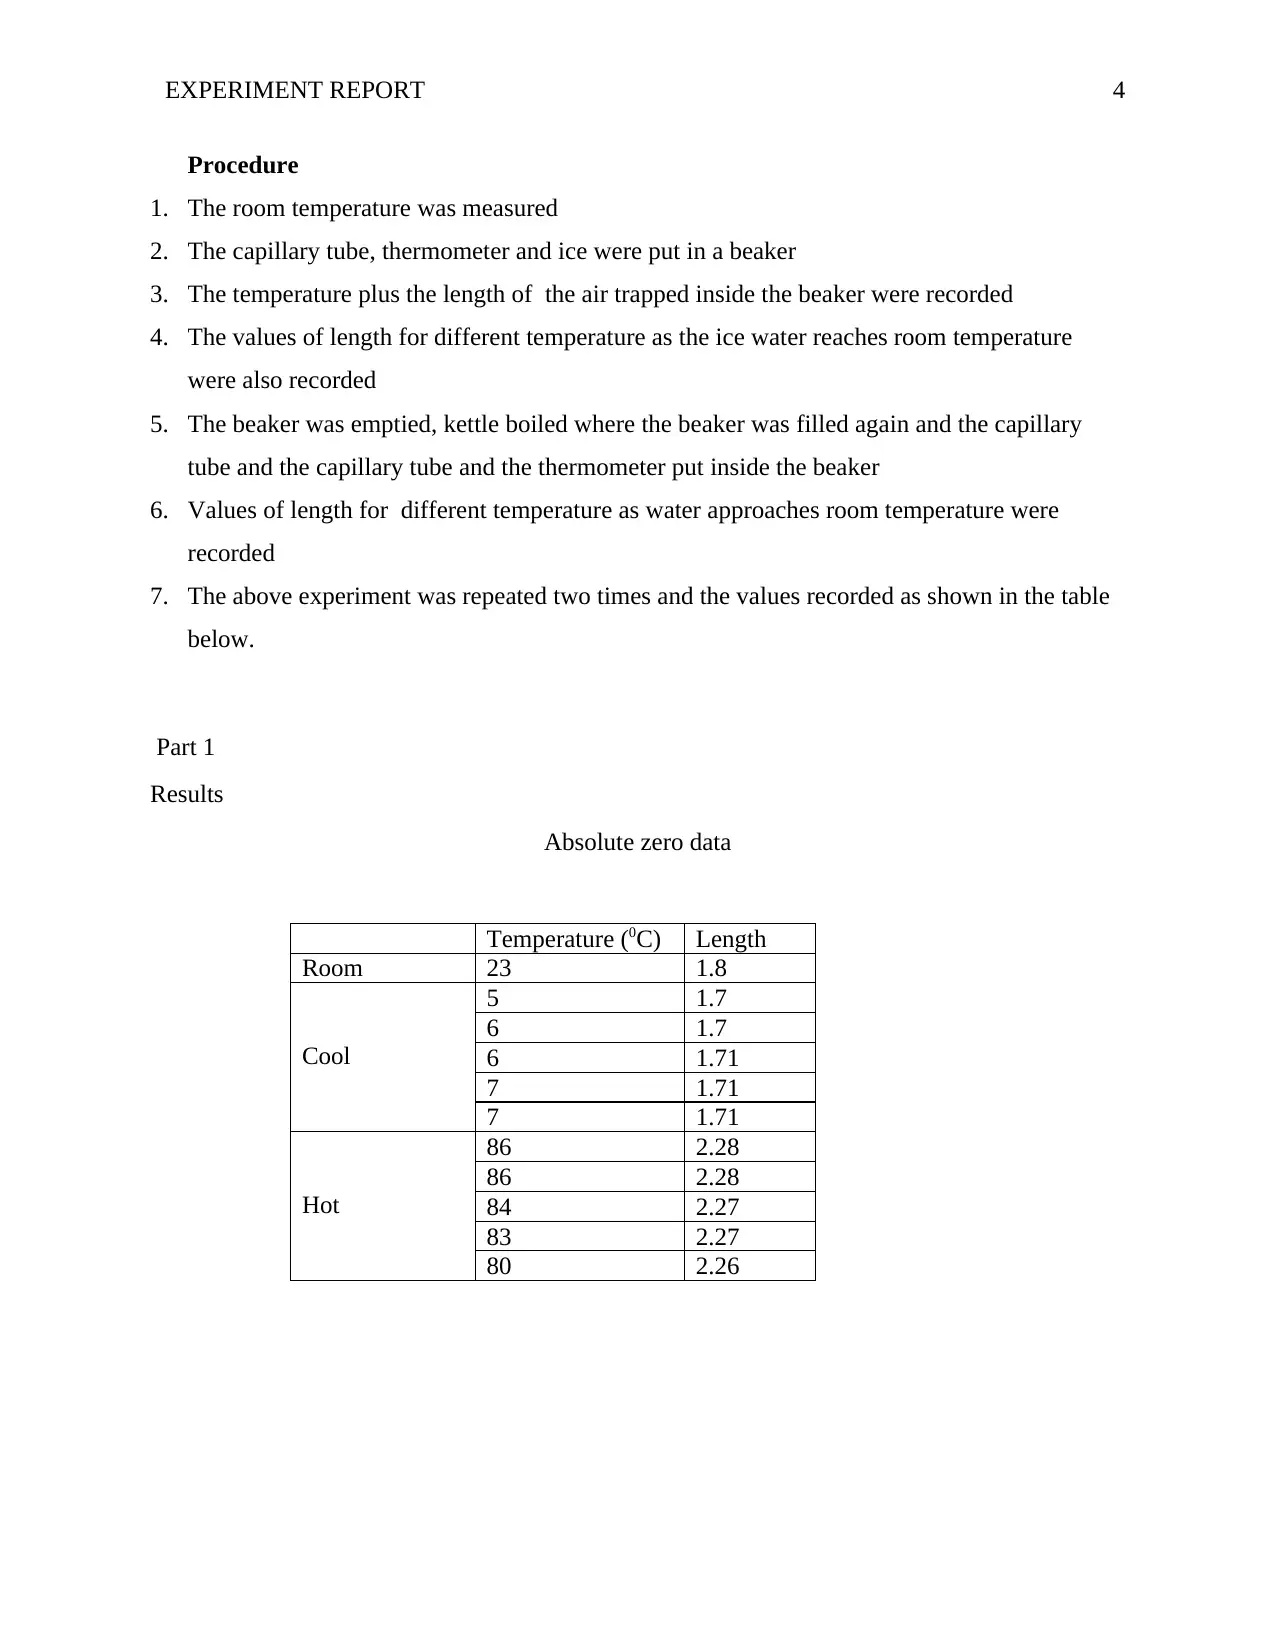
Absolute zero data
Temperature (0C) Length
Room 23 1.8
Cool
5 1.7
6 1.7
6 1.71
7 1.71
7 1.71
Hot
86 2.28
86 2.28
84 2.27
83 2.27
80 2.26
Procedure
1. The room temperature was measured
2. The capillary tube, thermometer and ice were put in a beaker
3. The temperature plus the length of the air trapped inside the beaker were recorded
4. The values of length for different temperature as the ice water reaches room temperature
were also recorded
5. The beaker was emptied, kettle boiled where the beaker was filled again and the capillary
tube and the capillary tube and the thermometer put inside the beaker
6. Values of length for different temperature as water approaches room temperature were
recorded
7. The above experiment was repeated two times and the values recorded as shown in the table
below.
Part 1
Results
Absolute zero data
Temperature (0C) Length
Room 23 1.8
Cool
5 1.7
6 1.7
6 1.71
7 1.71
7 1.71
Hot
86 2.28
86 2.28
84 2.27
83 2.27
80 2.26
Paraphrase This Document
Need a fresh take? Get an instant paraphrase of this document with our AI Paraphraser
EXPERIMENT REPORT 5
0 10 20 30 40 50 60 70 80 90 100
0
0.5
1
1.5
2
2.5
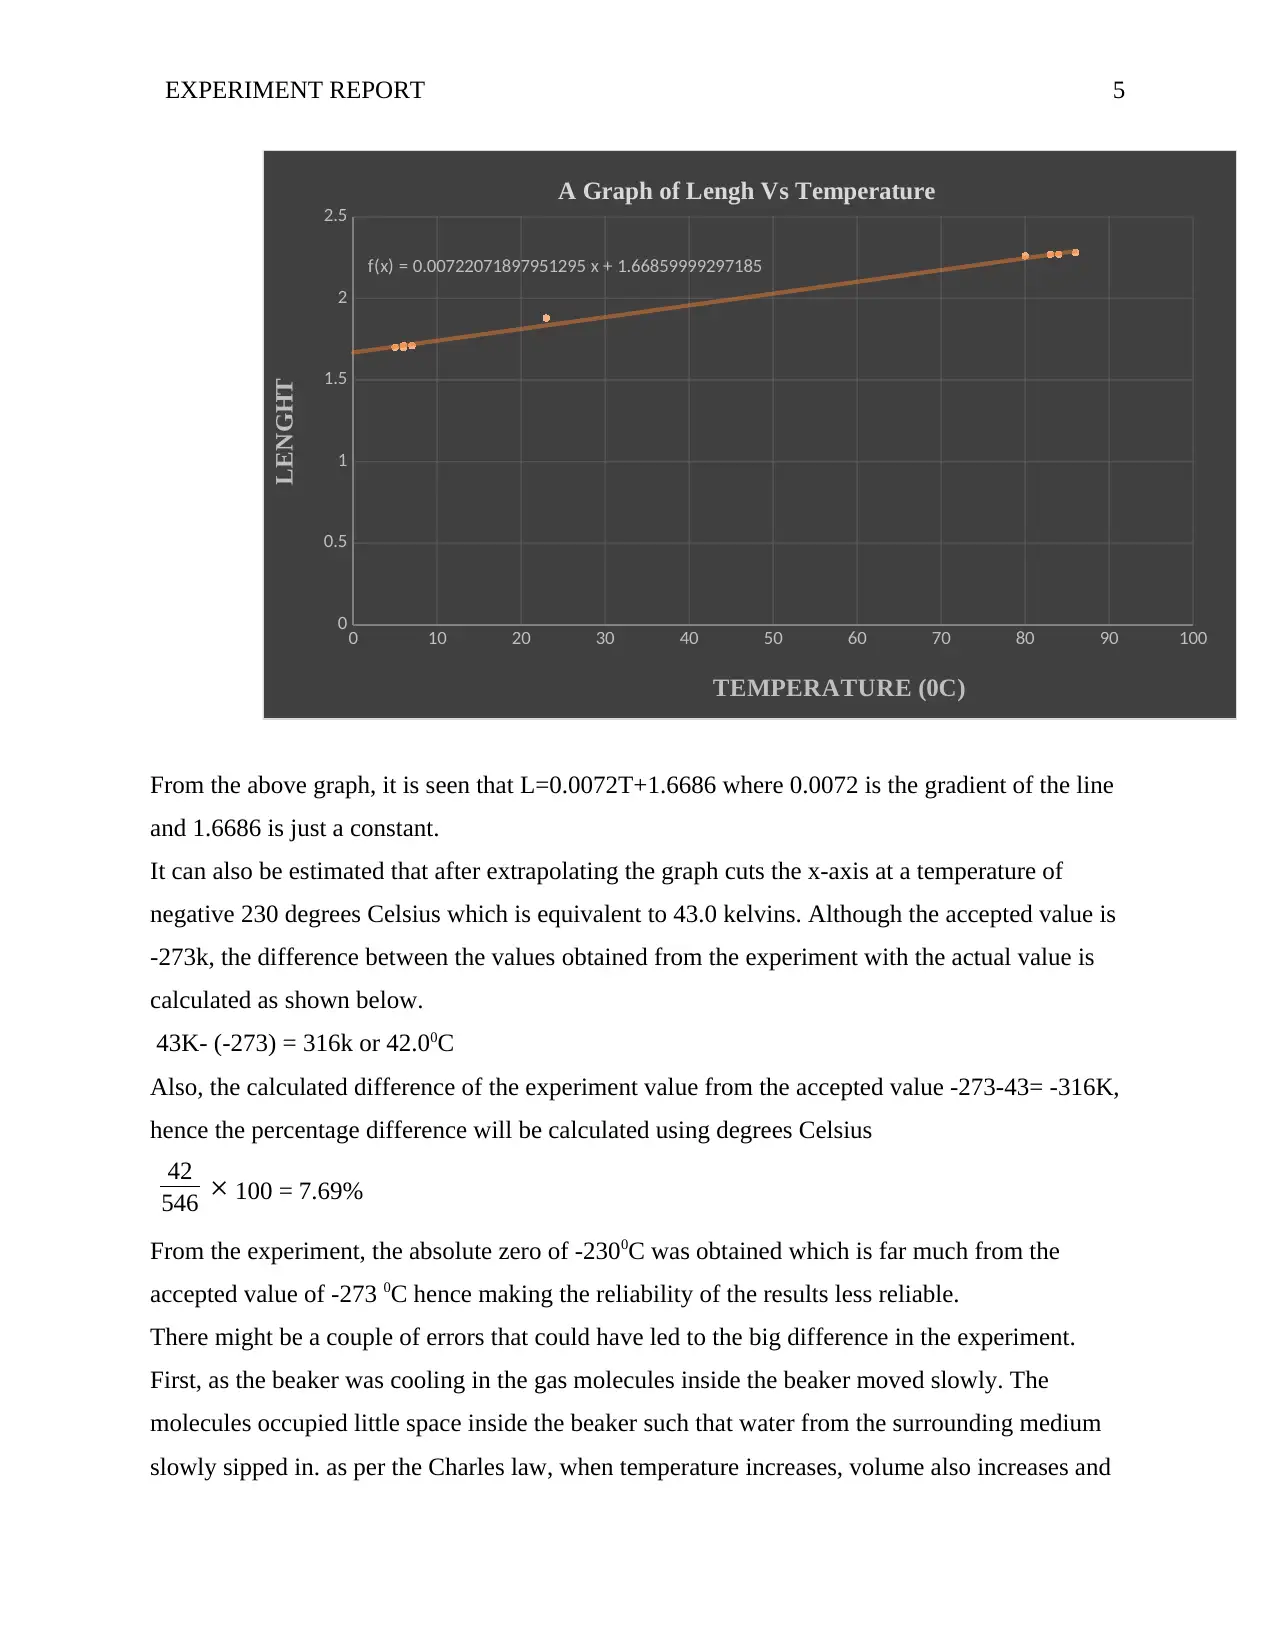
f(x) = 0.00722071897951295 x + 1.66859999297185
A Graph of Lengh Vs Temperature
TEMPERATURE (0C)
LENGHT
From the above graph, it is seen that L=0.0072T+1.6686 where 0.0072 is the gradient of the line
and 1.6686 is just a constant.
It can also be estimated that after extrapolating the graph cuts the x-axis at a temperature of
negative 230 degrees Celsius which is equivalent to 43.0 kelvins. Although the accepted value is
-273k, the difference between the values obtained from the experiment with the actual value is
calculated as shown below.
43K- (-273) = 316k or 42.00C
Also, the calculated difference of the experiment value from the accepted value -273-43= -316K,
hence the percentage difference will be calculated using degrees Celsius
42
546 × 100 = 7.69%
From the experiment, the absolute zero of -2300C was obtained which is far much from the
accepted value of -273 0C hence making the reliability of the results less reliable.
There might be a couple of errors that could have led to the big difference in the experiment.
First, as the beaker was cooling in the gas molecules inside the beaker moved slowly. The
molecules occupied little space inside the beaker such that water from the surrounding medium
slowly sipped in. as per the Charles law, when temperature increases, volume also increases and
0 10 20 30 40 50 60 70 80 90 100
0
0.5
1
1.5
2
2.5
f(x) = 0.00722071897951295 x + 1.66859999297185
A Graph of Lengh Vs Temperature
TEMPERATURE (0C)
LENGHT
From the above graph, it is seen that L=0.0072T+1.6686 where 0.0072 is the gradient of the line
and 1.6686 is just a constant.
It can also be estimated that after extrapolating the graph cuts the x-axis at a temperature of
negative 230 degrees Celsius which is equivalent to 43.0 kelvins. Although the accepted value is
-273k, the difference between the values obtained from the experiment with the actual value is
calculated as shown below.
43K- (-273) = 316k or 42.00C
Also, the calculated difference of the experiment value from the accepted value -273-43= -316K,
hence the percentage difference will be calculated using degrees Celsius
42
546 × 100 = 7.69%
From the experiment, the absolute zero of -2300C was obtained which is far much from the
accepted value of -273 0C hence making the reliability of the results less reliable.
There might be a couple of errors that could have led to the big difference in the experiment.
First, as the beaker was cooling in the gas molecules inside the beaker moved slowly. The
molecules occupied little space inside the beaker such that water from the surrounding medium
slowly sipped in. as per the Charles law, when temperature increases, volume also increases and
EXPERIMENT REPORT 6
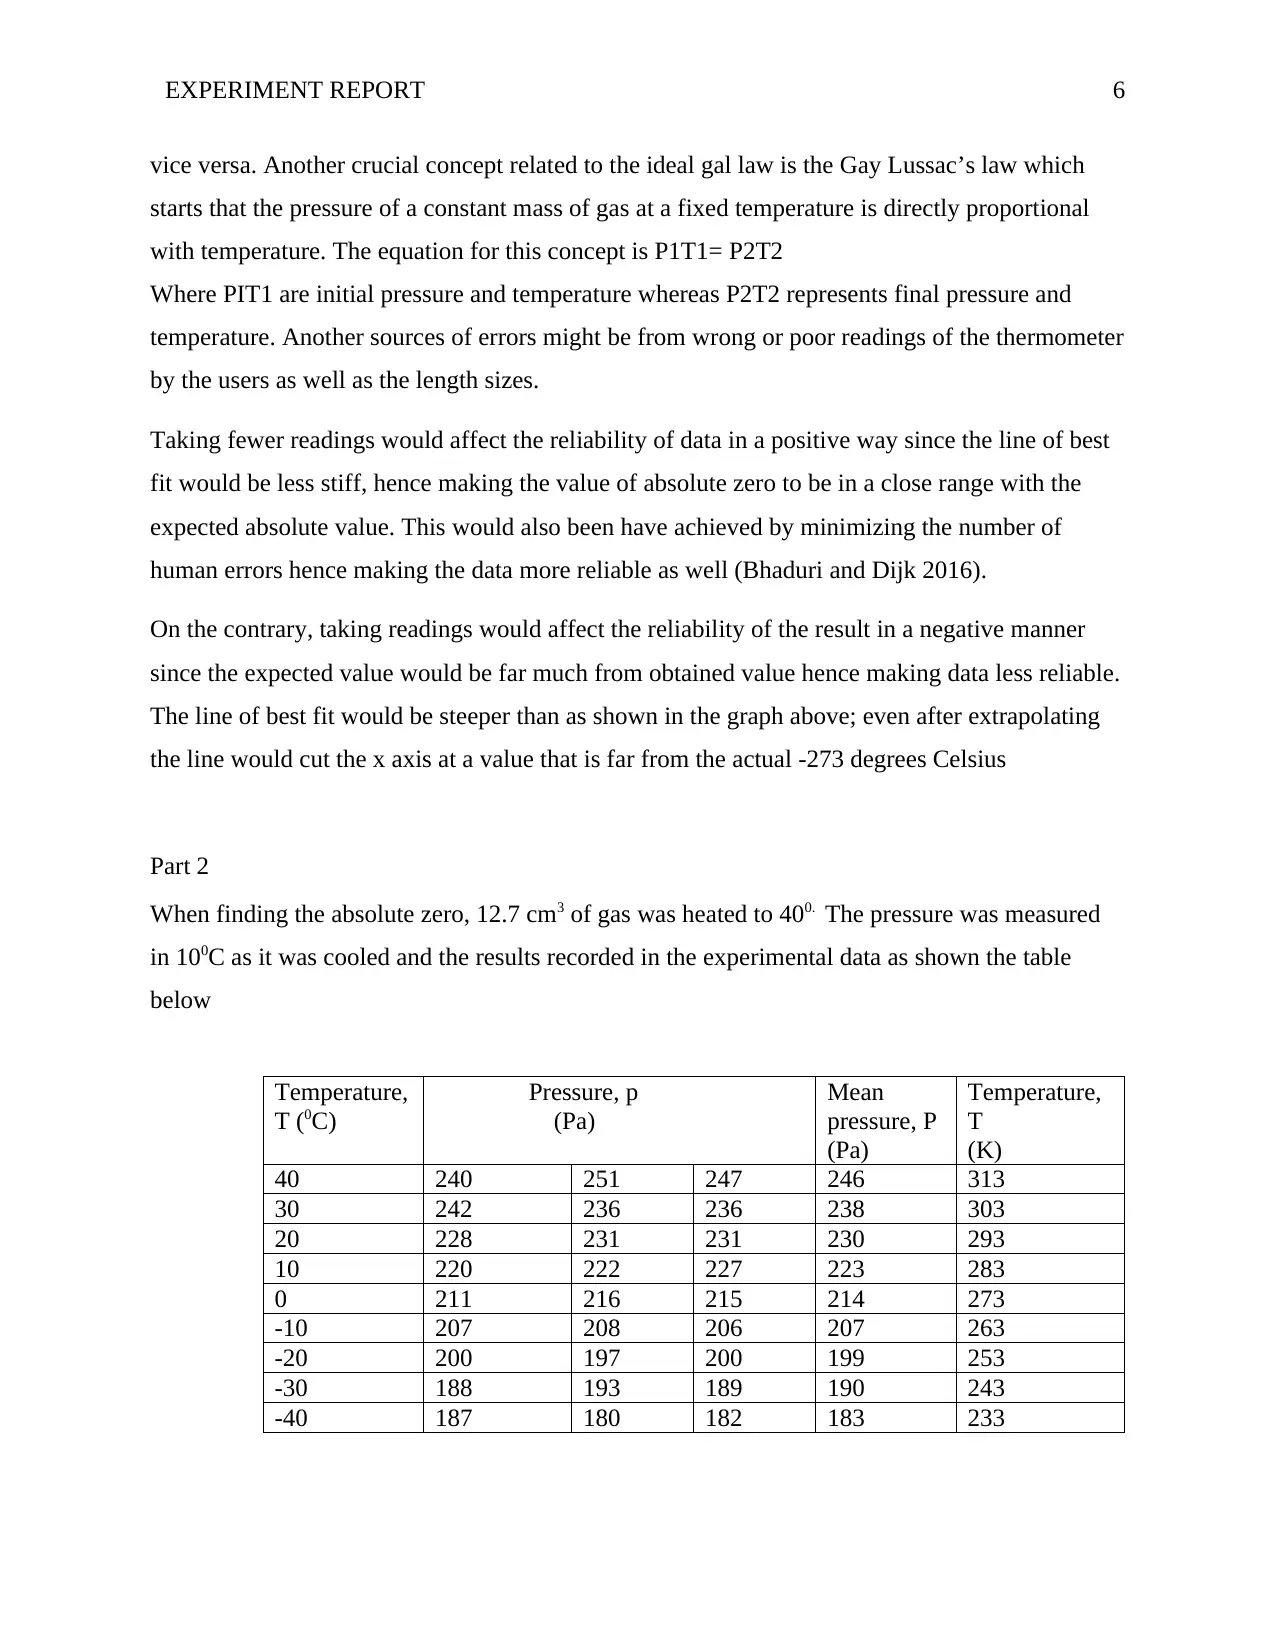
vice versa. Another crucial concept related to the ideal gal law is the Gay Lussac’s law which
starts that the pressure of a constant mass of gas at a fixed temperature is directly proportional
with temperature. The equation for this concept is P1T1= P2T2
Where PIT1 are initial pressure and temperature whereas P2T2 represents final pressure and
temperature. Another sources of errors might be from wrong or poor readings of the thermometer
by the users as well as the length sizes.
Taking fewer readings would affect the reliability of data in a positive way since the line of best
fit would be less stiff, hence making the value of absolute zero to be in a close range with the
expected absolute value. This would also been have achieved by minimizing the number of
human errors hence making the data more reliable as well (Bhaduri and Dijk 2016).
On the contrary, taking readings would affect the reliability of the result in a negative manner
since the expected value would be far much from obtained value hence making data less reliable.
The line of best fit would be steeper than as shown in the graph above; even after extrapolating
the line would cut the x axis at a value that is far from the actual -273 degrees Celsius
Part 2
When finding the absolute zero, 12.7 cm3 of gas was heated to 400. The pressure was measured
in 100C as it was cooled and the results recorded in the experimental data as shown the table
below
Temperature,
T (0C)
Pressure, p
(Pa)
Mean
pressure, P
(Pa)
Temperature,
T
(K)
40 240 251 247 246 313
30 242 236 236 238 303
20 228 231 231 230 293
10 220 222 227 223 283
0 211 216 215 214 273
-10 207 208 206 207 263
-20 200 197 200 199 253
-30 188 193 189 190 243
-40 187 180 182 183 233
⊘ This is a preview!⊘
Do you want full access?
Subscribe today to unlock all pages.
Trusted by 1+ million students worldwide
EXPERIMENT REPORT 7
220 230 240 250 260 270 280 290 300 310 320
0
50
100
150
200
250
300
f(x) = 0.79 x − 1.22555555555556
A Graph Of Pressure Vs Temperature
TEMP (K)
P
R
E
S
S
U
R
E
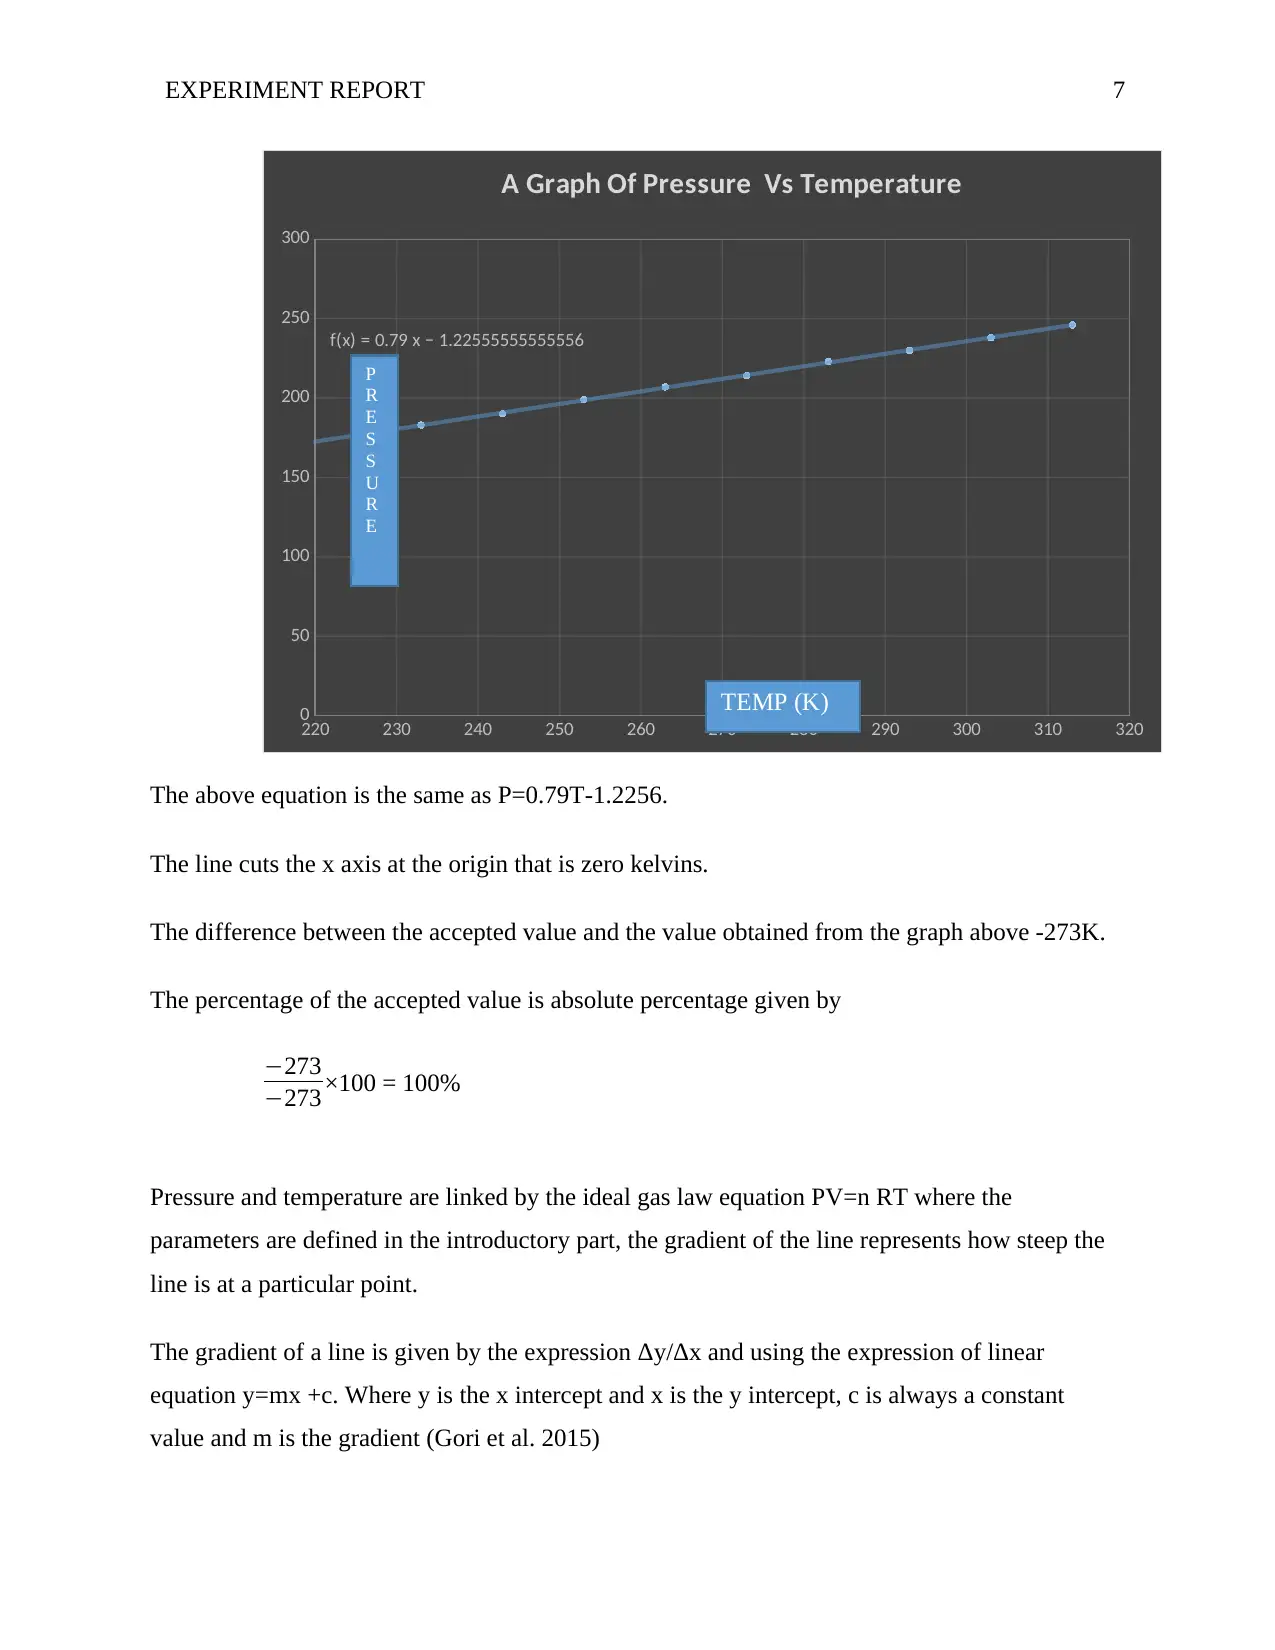
The above equation is the same as P=0.79T-1.2256.
The line cuts the x axis at the origin that is zero kelvins.
The difference between the accepted value and the value obtained from the graph above -273K.
The percentage of the accepted value is absolute percentage given by
−273
−273 ×100 = 100%
Pressure and temperature are linked by the ideal gas law equation PV=n RT where the
parameters are defined in the introductory part, the gradient of the line represents how steep the
line is at a particular point.
The gradient of a line is given by the expression Δy/Δx and using the expression of linear
equation y=mx +c. Where y is the x intercept and x is the y intercept, c is always a constant
value and m is the gradient (Gori et al. 2015)
220 230 240 250 260 270 280 290 300 310 320
0
50
100
150
200
250
300
f(x) = 0.79 x − 1.22555555555556
A Graph Of Pressure Vs Temperature
TEMP (K)
P
R
E
S
S
U
R
E
The above equation is the same as P=0.79T-1.2256.
The line cuts the x axis at the origin that is zero kelvins.
The difference between the accepted value and the value obtained from the graph above -273K.
The percentage of the accepted value is absolute percentage given by
−273
−273 ×100 = 100%
Pressure and temperature are linked by the ideal gas law equation PV=n RT where the
parameters are defined in the introductory part, the gradient of the line represents how steep the
line is at a particular point.
The gradient of a line is given by the expression Δy/Δx and using the expression of linear
equation y=mx +c. Where y is the x intercept and x is the y intercept, c is always a constant
value and m is the gradient (Gori et al. 2015)
Paraphrase This Document
Need a fresh take? Get an instant paraphrase of this document with our AI Paraphraser
EXPERIMENT REPORT 8
Therefore, using the above equation y= 0.79x 1.2256, it can be seen that the gradient of the line
which is m = 0.79
Calculating the number of moles of gas in the container would require the following equation
PV =nRT
Where P= 246pa
V=12.7m3
n =?
R= 8.3145j/mol.K which is the ideal gas constant
T=313K
Therefore, 246× 12.7 =n 8.3125×313
3124.2= n 2601.8125
n= 3124.2/2601.8125
The number of moles is 1.21
Since the accepted number of moles is 1.2 and the calculated number of moles from the gradient
is 1.21the difference between the two values is 0.01 moles. This value is obtained by subtracting
the two number of moles. Calculating the percentage of the difference of the accepted value
would be given by the following expression (Privat et al. 2016).
n 1−n 2
n 1 ×100
Where n1 is the initial number of moles, and n2 ids the final number of moles
0.01
1.21×100 =0.8%
EXPERIMENT REPORT 9
Discussion
The two experiment’s revolved around the ideal gas laws. Part 1 of the experiment was asking to
measure the length of air trapped inside the beaker against the temperature changes as the
temperature increased with increase in length of the air travelled. Therefore, in this part, it was
easy to prove that pressure is inversely proportion to volume. It was also predicted that the
pressure would be using such correlation where the actual results of the absolute zero were
compared with the experiment values. It was noticed that the length of air travelled and the
temperature started to change at some point hence. This was as a result of the experimental errors
that occurred while conducting the experiment. Although the sources of error could be many,
assuming that ΔT was zero could be one of the main source of error. Assuming that the number
of moles did not change in the experiment could have been another great source of error
(Malanchuk et al. 2017). Some of the gases that were being used could have escaped in the air
during compression therefore changing the value of n as well as making the pressure volume
relation invalid since n was no more a constant value. It can also be pointed out that the largest
source of error was from disregarding the extra volume of air inside the apparatus that were
being used in the experiment. Therefore neglecting the remaining volumes of air as minute, the
volume and pressure values could not have been accurate hence the reason for the bigger margin
between the accepted value and the experimental value. However, the overall objectives of the
second test was to investigate the ideal gas law and for it to be valid the graph should have
appeared like the plot of y=1/x (). Therefore, this experiment has hold to the fact that air is an
ideal gas. (Niazmand et al. 2017).
Conclusion
In part one of the experiment, it was observed that changing temperature affected the length of
air in the beaker. It was also noticed that as the volume of air in the beaker went down, the
percentage of the estimated value went up. It is in the lower volumes where the points began to
separate. Therefore, the first graph did agree with the ideal gas laws. The curve was similar to the
one of 1/x curve since in the experiment was comparing temperature with length. In the second
experiment it was found that the value for the real absolute zero has an absolute difference to the
theoretical value. The data could have not been accurate for a couple of reasons thus implying
⊘ This is a preview!⊘
Do you want full access?
Subscribe today to unlock all pages.
Trusted by 1+ million students worldwide
EXPERIMENT REPORT 10
that there could have been errors in the experiment. Experimentally, it has been observed that the
absolute zero can be achieved when some factors are put into consideration when doing an
experiment. The sources of errors that have been witnessed in the above experiments are due to
human errors, say poor readings or calibration of the apparatus and lack of consistency though
out the experiment. Hence, when these factors among other many are held into consideration the
possibility of errors may be minimized hence providing a value which is similar to the expected
absolute zero. Therefore, it should be noted that the bigger the sources or error the larger the
difference between the actual and the expected value.
Paraphrase This Document
Need a fresh take? Get an instant paraphrase of this document with our AI Paraphraser
EXPERIMENT REPORT 11
List of References
Aad, G., Abbott, B., Abdallah, J., Khalek, S.A., Abdinov, O., Aben, R., Abi, B., Abidi, S.H.,
Abolins, M., AbouZeid, O.S. and Abramowicz, H., 2014. Measurement of the Higgs boson mass
from the H→ γ γ and H→ Z Z*→ 4 ℓ channels in p p collisions at center-of-mass energies of 7
and 8 TeV with the ATLAS detector. Physical Review D, 90(5), p.052004.
Ariafar, K., Buttsworth, D., Al-Doori, G. and Sharifi, N., 2016. Mixing layer effects on the
entrainment ratio in steam ejectors through ideal gas computational simulations. Energy, 95,
pp.380-392.
Bhaduri, R.K. and van Dijk, W., 2016. Semiclassical and quantum description of an ideal Bose
gas in a uniform gravitational field. Physics Letters A, 380(33), pp.2480-2484.
Gori, G., Guardone, A., Vitale, S., Head, A., Pini, M. and Colonna, P., 2015. Non-ideal
compressible-fluid dynamics simulation with su2: Numerical assessment of nozzle and blade
flows for organic rankine cycle applications. In 3rd International Seminar on ORC Power
Systems. Brussels, Belgium.
Malanchuk, N., Slobodyan, B. and Martynyak, R., 2017. Frictional contact of two solids with a
periodically grooved surface in the presence of an ideal gas in interface gaps. Journal of
Theoretical and Applied Mechanics, 55(4), pp.1181-1192.
Niazmand, A., Farzaneh-Gord, M. and Deymi-Dashtebayaz, M., 2017. Exergy analysis and
entropy generation of a reciprocating compressor applied in CNG stations carried out on the
basis models of ideal and real gas. Applied Thermal Engineering, 124, pp.1279-1291.
EXPERIMENT REPORT 12
Privat, R., Jaubert, J.N. and Moine, E., 2016. Improving Students’ Understanding of the
Connections between the Concepts of Real-Gas Mixtures, Gas Ideal-Solutions, and Perfect-Gas
Mixtures. Journal of Chemical Education, 93(12), pp.2040-2045.
Privat, R., Jaubert, J.N. and Moine, E., 2016. Improving Students’ Understanding of the
Connections between the Concepts of Real-Gas Mixtures, Gas Ideal-Solutions, and Perfect-Gas
Mixtures. Journal of Chemical Education, 93(12), pp.2040-2045.
⊘ This is a preview!⊘
Do you want full access?
Subscribe today to unlock all pages.
Trusted by 1+ million students worldwide
1 out of 12
Related Documents


Your All-in-One AI-Powered Toolkit for Academic Success.
+13062052269
info@desklib.com
Available 24*7 on WhatsApp / Email
![[object Object]](/_next/static/media/star-bottom.7253800d.svg)
Unlock your academic potential
Copyright © 2020–2026 A2Z Services. All Rights Reserved. Developed and managed by ZUCOL.