Comprehensive Financial Analysis Project: Exxon Mobil 2013
VerifiedAdded on 2023/06/16
|7
|1467
|391
Project
AI Summary
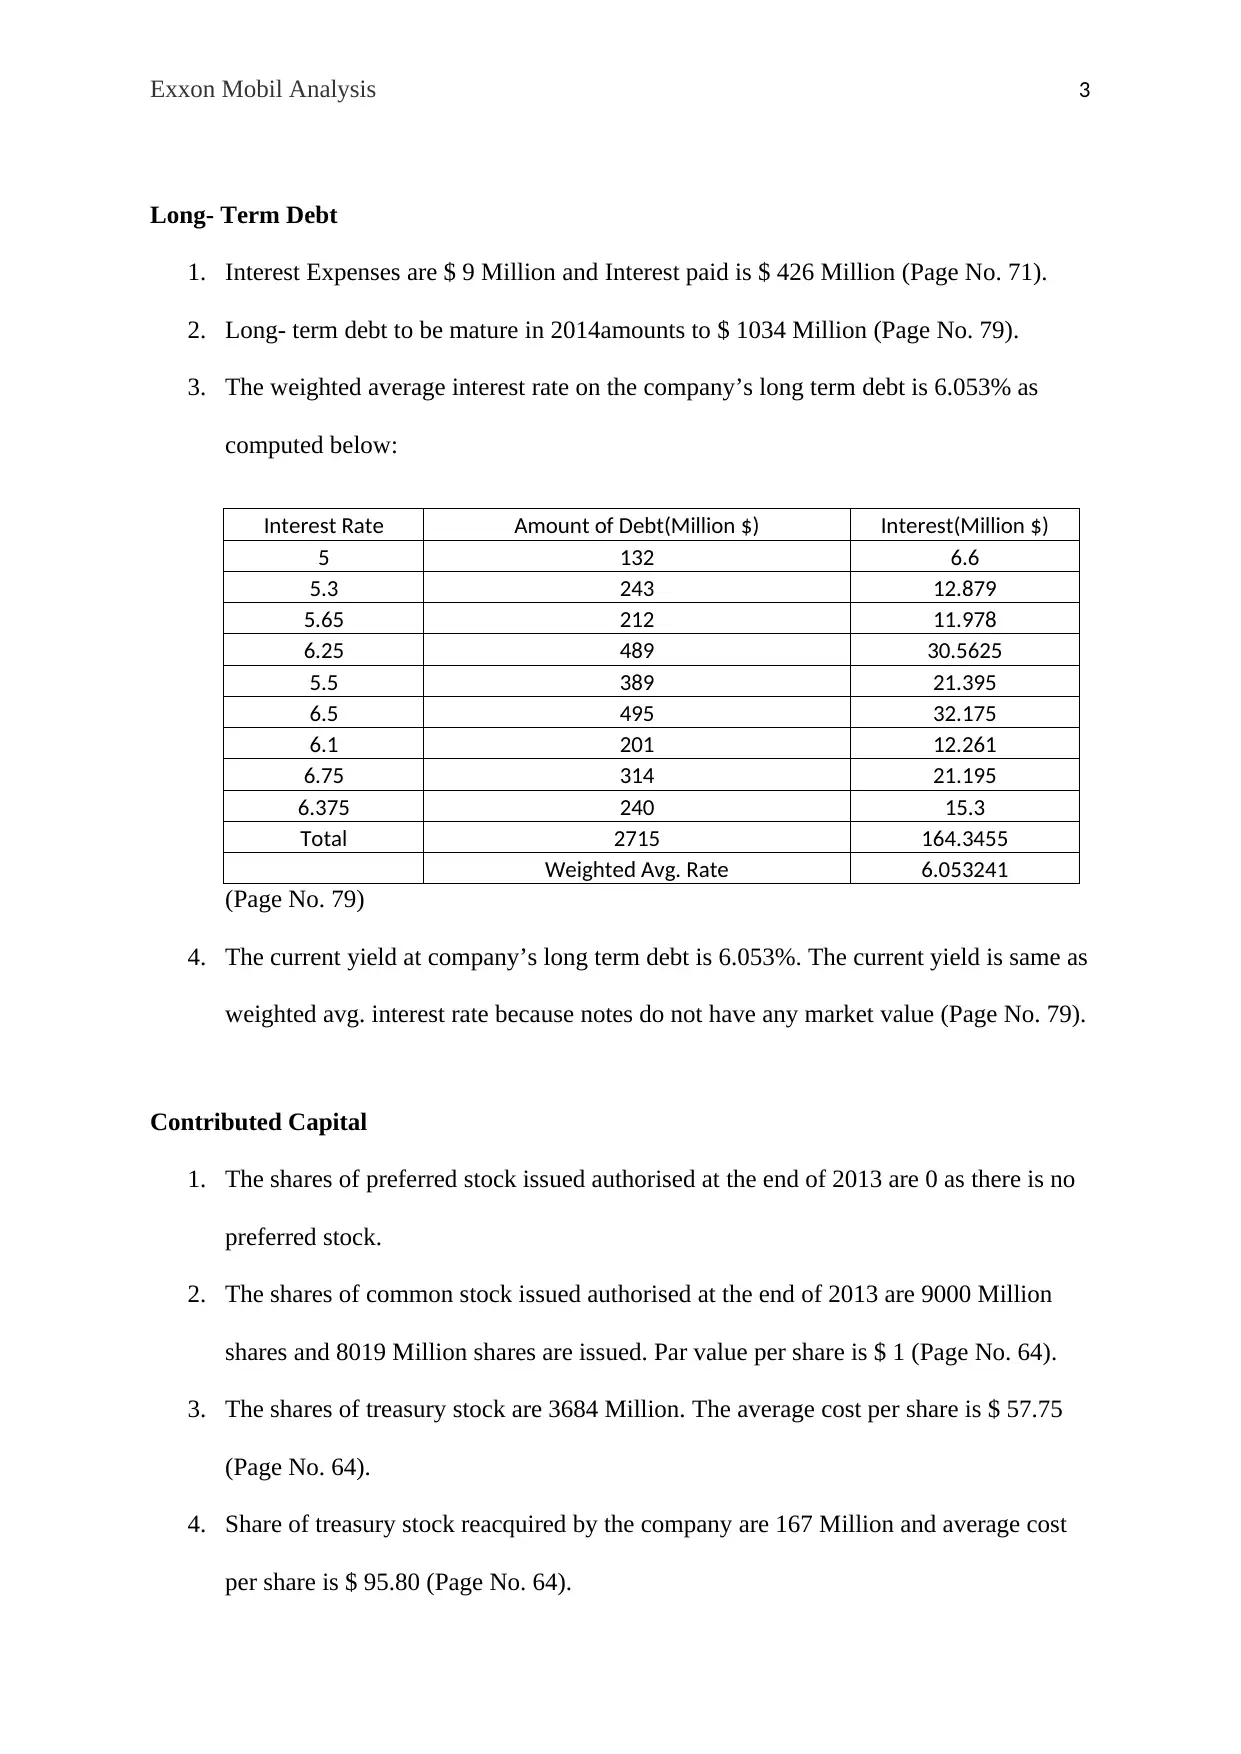
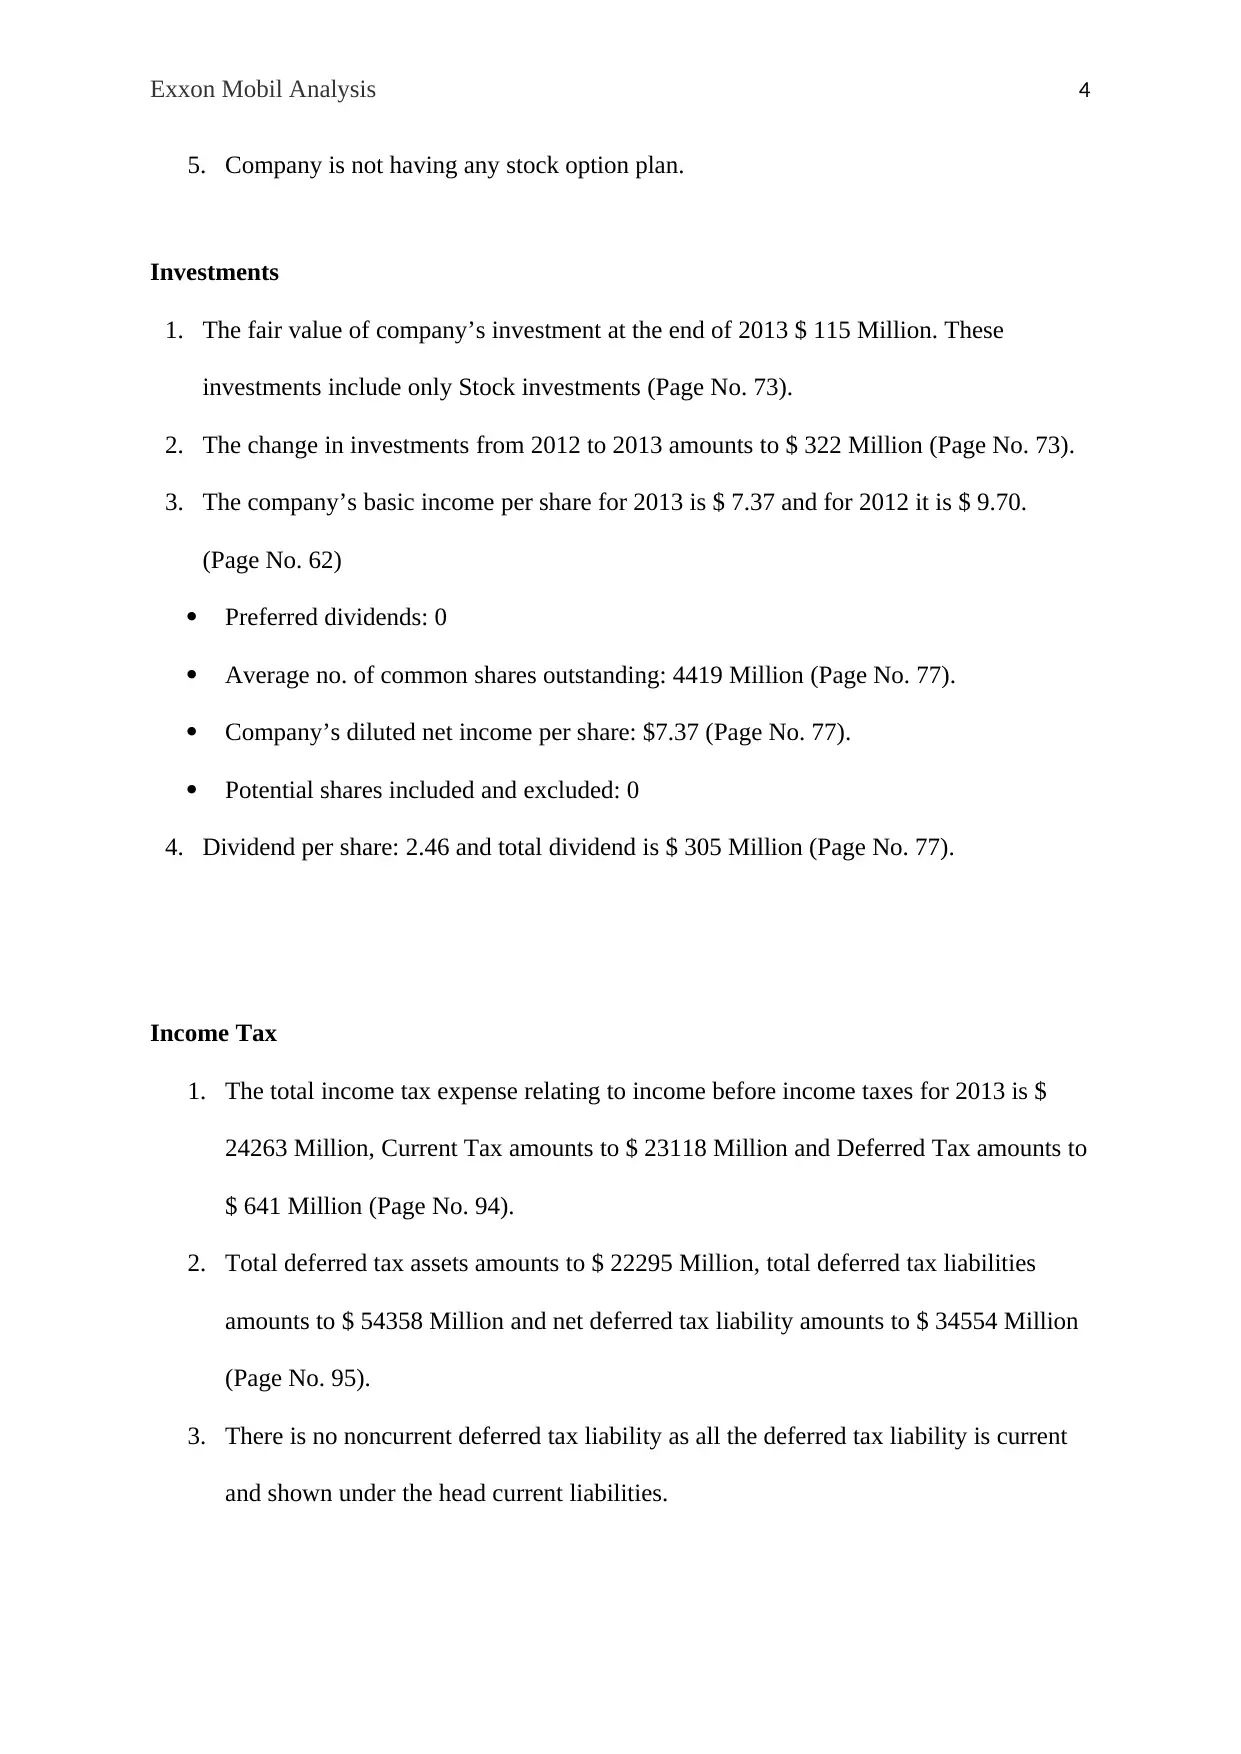
This project provides a detailed financial analysis of Exxon Mobil Corporation based on its 2013 annual report (10-K filing). It covers key aspects such as long-term debt, including interest expenses, debt maturity, and weighted average interest rate; contributed capital, detailing preferred and common stock, treasury shares, and stock option plans; investments, including fair value and changes in investments; income tax, analyzing income tax expenses, deferred tax assets and liabilities; pension and other post-employment benefits; leasing obligations; and cash flow, examining operating, investing, and financing activities. The analysis also assesses the company's financial disclosures, including auditor's report, accounting method changes, and subsequent events, along with segment performance and sales trends. References to the annual report and other relevant sources are included to support the analysis.

Running Head: Exxon Mobil Analysis 1
Analysis of Exxon Mobil
Paraphrase This Document
Need a fresh take? Get an instant paraphrase of this document with our AI Paraphraser

Exxon Mobil Analysis 2
Contents
Long- Term Debt...................................................................................................................................3
Contributed Capital...............................................................................................................................3
Investments............................................................................................................................................4
Income Tax............................................................................................................................................4
Pension and Other Post-Employment Benefits......................................................................................5
Leasing..................................................................................................................................................5
Cash Flow..............................................................................................................................................5
Financial Disclosure..............................................................................................................................6
References.............................................................................................................................................7

Exxon Mobil Analysis 3
Long- Term Debt
1. Interest Expenses are $ 9 Million and Interest paid is $ 426 Million (Page No. 71).
2. Long- term debt to be mature in 2014amounts to $ 1034 Million (Page No. 79).
3. The weighted average interest rate on the company’s long term debt is 6.053% as
computed below:
Interest Rate Amount of Debt(Million $) Interest(Million $)
5 132 6.6
5.3 243 12.879
5.65 212 11.978
6.25 489 30.5625
5.5 389 21.395
6.5 495 32.175
6.1 201 12.261
6.75 314 21.195
6.375 240 15.3
Total 2715 164.3455
Weighted Avg. Rate 6.053241
(Page No. 79)
4. The current yield at company’s long term debt is 6.053%. The current yield is same as
weighted avg. interest rate because notes do not have any market value (Page No. 79).
Contributed Capital
1. The shares of preferred stock issued authorised at the end of 2013 are 0 as there is no
preferred stock.
2. The shares of common stock issued authorised at the end of 2013 are 9000 Million
shares and 8019 Million shares are issued. Par value per share is $ 1 (Page No. 64).
3. The shares of treasury stock are 3684 Million. The average cost per share is $ 57.75
(Page No. 64).
4. Share of treasury stock reacquired by the company are 167 Million and average cost
per share is $ 95.80 (Page No. 64).
⊘ This is a preview!⊘
Do you want full access?
Subscribe today to unlock all pages.

Trusted by 1+ million students worldwide

Exxon Mobil Analysis 4
5. Company is not having any stock option plan.
Investments
1. The fair value of company’s investment at the end of 2013 $ 115 Million. These
investments include only Stock investments (Page No. 73).
2. The change in investments from 2012 to 2013 amounts to $ 322 Million (Page No. 73).
3. The company’s basic income per share for 2013 is $ 7.37 and for 2012 it is $ 9.70.
(Page No. 62)
Preferred dividends: 0
Average no. of common shares outstanding: 4419 Million (Page No. 77).
Company’s diluted net income per share: $7.37 (Page No. 77).
Potential shares included and excluded: 0
4. Dividend per share: 2.46 and total dividend is $ 305 Million (Page No. 77).
Income Tax
1. The total income tax expense relating to income before income taxes for 2013 is $
24263 Million, Current Tax amounts to $ 23118 Million and Deferred Tax amounts to
$ 641 Million (Page No. 94).
2. Total deferred tax assets amounts to $ 22295 Million, total deferred tax liabilities
amounts to $ 54358 Million and net deferred tax liability amounts to $ 34554 Million
(Page No. 95).
3. There is no noncurrent deferred tax liability as all the deferred tax liability is current
and shown under the head current liabilities.
Paraphrase This Document
Need a fresh take? Get an instant paraphrase of this document with our AI Paraphraser

Exxon Mobil Analysis 5
Pension and Other Post-Employment Benefits
1. Company is following defined benefit pension plan.
2. Company’s pension amounts to $ 3323 Million and other post-employment benefit
expenses amounts to $ 528 Million (Page No. 83).
3. Actual return on plan assets is $ 2285 Million and expected return on plan assets is $
2004 Million (Page No. 83 & 85).
4. Benefit obligation in 2013 amounts to $ 44661 Million (Page No. 83).
Leasing
1. Company have non-cancellable operating leases. The company uses this type of leases
because this shown on undiscounted basis (Page No. 77).
2. Obligation reported is of $ 7438 Million (Page No. 77).
Cash Flow
1. Net cash provided by operating activities for 2013: $ 44914 Million, method used:
Indirect method and the largest positive adjustment to net income: Depreciation and
depletion (Page No. 65).
2. Net cash used in investing activities for 2013: $ 34201 Million, the largest investing
cash outflow: Investment in property plant and equipment amounts to $ 33669
Million and investing cash inflow: Proceeds associated with sales of subsidiaries,
property, plant and equipment, and sales and returns of investments amounts to $
2707 Million (Page No. 65).
3. Net cash used in financing activities: $ 15476 Million, the largest financing cash
inflow: additions in debt amounts to $ 12012 Million and financing cash outflow:
common stock acquired amounts to $ 15998 Million (Page No. 65).
4. Interest paid: 426 and Income tax paid: 25066 (Page No. 71).

Exxon Mobil Analysis 6
5. Cash flow from operations to sales ratio of 2013: 11.51:1 and of 2012: 13.40:1 (Page
No. 65 & 62).
6. Profit margin for 2013: 8.349% and cash flow from operation to sales ratio is 11.51%
(Page No. 62).
Financial Disclosure
1. Yes, company’s auditor provided a clean report on the financial statements.
2. Yes, the company made changes in their accounting methods or estimates it uses.
The Company did not adopt authoritative guidance in 2013 that had a material impact
on the Corporation’s financial statements (Page No. 69).
3. No, the company did not make any accounting errors correction.
4. No, there have not been any subsequent events, errors and irregularities, illegal acts,
or related-party transactions that have a material effect on the company’s financial
position.
5. The company is following the trend of reinvesting its earnings in common stock and
treasury stock that they will follow in future as well. The company is assessing its
assets on a continual basis, this analysis assist the company whether the carrying
amount of any of its assets may not be recoverable (Page No. 57).
6. Yes, company is engaged in more than one significant line of business. Its operating
segments are upstream, downstream, chemical and corporate and financing. Sales
volume from each segment
Upstream: $ 39061 Million
Downstream: $ 342706 Million
Chemical: $ 39048 Million
⊘ This is a preview!⊘
Do you want full access?
Subscribe today to unlock all pages.

Trusted by 1+ million students worldwide

Exxon Mobil Analysis 7
Corporate and financing: $ 21 Million
The sales trend in last two years says that sales are decreasing year by year.
The upstream segment comprises the major profit part, the downstream segment with
the lowest profit and corporate and financing segment facing loss (Page No. 92).
References
1. Boobyer, C 2003, Leasing and Asset Finance: The Compherensive Guide for
Practitioners, Euromoney Books, London.
2. Exxon Mobile Corporation 2013, Annual Report, available on
<http://cdn.exxonmobil.com/~/media/Global/Files/Summary-Annual-Report/
2013_ExxonMobil_Summary_Annual_Report.pdf>.
3. Fischer, P, Tayler, W & Cheng, R 2007, Fundamentals of Advanced Accounting,
Cengage Learning.
4. Gauthier, S. J. 2005, An Elected Official’s Guide to Employer’s Accounting for
Pensions and Other Post-employment Benefits (OPEB), Government Finance Officers
Association.
5. Greuning, H. V. 2009, International Financial Reporting Standards: A Practical
Guide, World Bank Publications.
6. Jury, T 2012, Cash Flow Analysis and Forecasting: The Definitive Guide to
Understanding and Using Published Cash Flow Data, John Wiley & Sons.
7. Kanodia, C 2007, Accounting Disclosures and Real Effects, Now Publishers Inc,
USA.
8. Needles, E. N., Powers, M & Susan, V. C. 2010, Principles of Accounting, Cengage
Learning.
1 out of 7
Related Documents
Your All-in-One AI-Powered Toolkit for Academic Success.
+13062052269
info@desklib.com
Available 24*7 on WhatsApp / Email
Unlock your academic potential
Copyright © 2020–2026 A2Z Services. All Rights Reserved. Developed and managed by ZUCOL.


