Detailed Report: Facebook Business Performance Analysis with MS Excel
VerifiedAdded on 2023/06/11
|9
|1674
|446
Report
AI Summary
This report provides an analysis of Facebook's business performance from 2017 to 2021 using MS Excel. It covers key metrics such as market capitalization, revenue, and number of employees, calculating percentages and applying statistical techniques like SUM, MEAN, and MEDIAN. The report includes chart representations to visualize the data and elaborates on the findings, discussing the implications of the statistical analysis. It concludes with insights into the company's growth rate and expected future performance, highlighting the usefulness of these functions for understanding business trends. The analysis shows consistent growth in market capitalization and revenue, indicating effective resource utilization and market dominance.
MS Excel
Paraphrase This Document
Need a fresh take? Get an instant paraphrase of this document with our AI Paraphraser
Contents
INTRODUCTION...........................................................................................................................3
MAIN BODY..................................................................................................................................3
1. Choose the research topic........................................................................................................3
2. Collect the Relevant Raw Rata of Facebook...........................................................................3
3. (i) Calculate the percentage of the data:..................................................................................3
3. (ii) Apply some of the Statistical Techniques:........................................................................4
3. (iii) Apply Auto Sum excel functions:.....................................................................................4
3. (iv) Chart Representation:........................................................................................................5
4. Elaborate the findings and analysis.........................................................................................6
CONCLUSION................................................................................................................................7
REFERENCES................................................................................................................................8
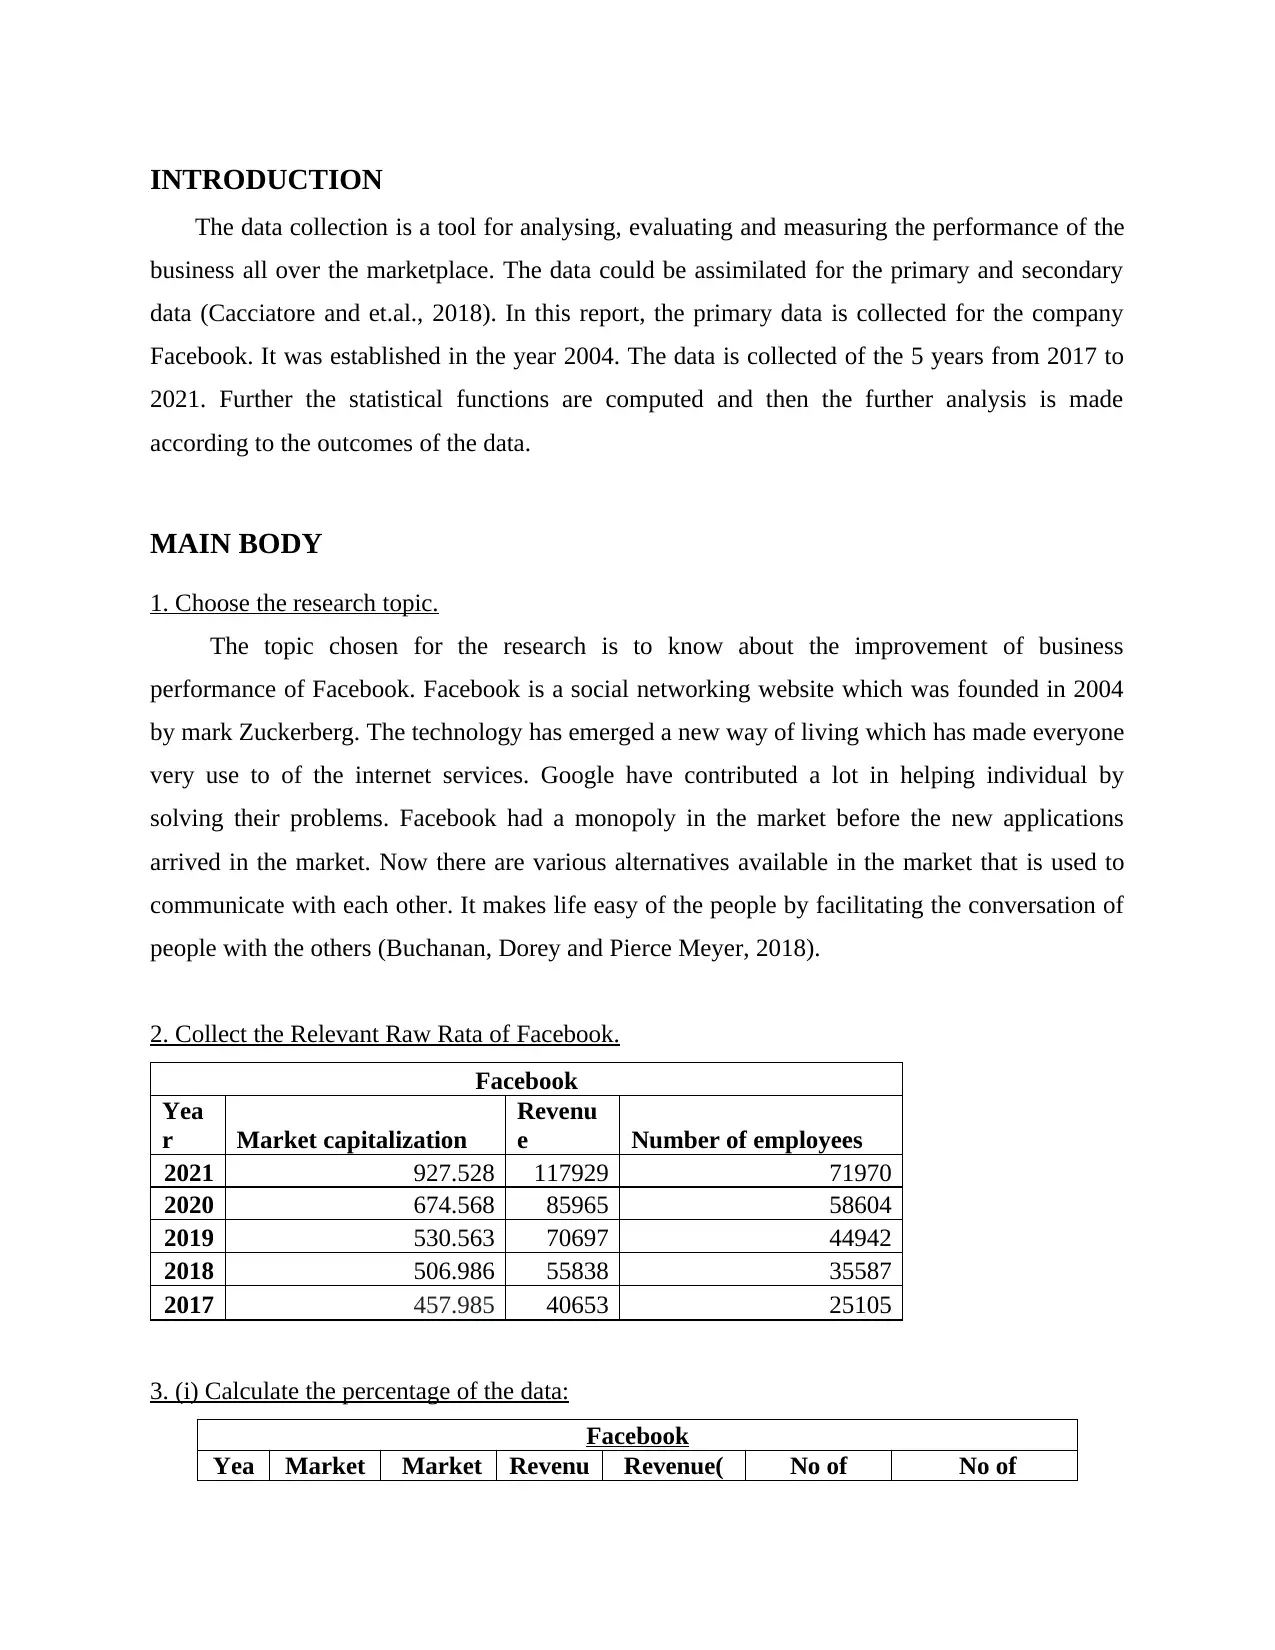
INTRODUCTION
The data collection is a tool for analysing, evaluating and measuring the performance of the
business all over the marketplace. The data could be assimilated for the primary and secondary
data (Cacciatore and et.al., 2018). In this report, the primary data is collected for the company
Facebook. It was established in the year 2004. The data is collected of the 5 years from 2017 to
2021. Further the statistical functions are computed and then the further analysis is made
according to the outcomes of the data.
MAIN BODY
1. Choose the research topic.
The topic chosen for the research is to know about the improvement of business
performance of Facebook. Facebook is a social networking website which was founded in 2004
by mark Zuckerberg. The technology has emerged a new way of living which has made everyone
very use to of the internet services. Google have contributed a lot in helping individual by
solving their problems. Facebook had a monopoly in the market before the new applications
arrived in the market. Now there are various alternatives available in the market that is used to
communicate with each other. It makes life easy of the people by facilitating the conversation of
people with the others (Buchanan, Dorey and Pierce Meyer, 2018).
2. Collect the Relevant Raw Rata of Facebook.
Facebook
Yea
r Market capitalization
Revenu
e Number of employees
2021 927.528 117929 71970
2020 674.568 85965 58604
2019 530.563 70697 44942
2018 506.986 55838 35587
2017 457.985 40653 25105
3. (i) Calculate the percentage of the data:
Facebook
Yea Market Market Revenu Revenue( No of No of
The data collection is a tool for analysing, evaluating and measuring the performance of the
business all over the marketplace. The data could be assimilated for the primary and secondary
data (Cacciatore and et.al., 2018). In this report, the primary data is collected for the company
Facebook. It was established in the year 2004. The data is collected of the 5 years from 2017 to
2021. Further the statistical functions are computed and then the further analysis is made
according to the outcomes of the data.
MAIN BODY
1. Choose the research topic.
The topic chosen for the research is to know about the improvement of business
performance of Facebook. Facebook is a social networking website which was founded in 2004
by mark Zuckerberg. The technology has emerged a new way of living which has made everyone
very use to of the internet services. Google have contributed a lot in helping individual by
solving their problems. Facebook had a monopoly in the market before the new applications
arrived in the market. Now there are various alternatives available in the market that is used to
communicate with each other. It makes life easy of the people by facilitating the conversation of
people with the others (Buchanan, Dorey and Pierce Meyer, 2018).
2. Collect the Relevant Raw Rata of Facebook.
Yea
r Market capitalization
Revenu
e Number of employees
2021 927.528 117929 71970
2020 674.568 85965 58604
2019 530.563 70697 44942
2018 506.986 55838 35587
2017 457.985 40653 25105
3. (i) Calculate the percentage of the data:
Yea Market Market Revenu Revenue( No of No of
⊘ This is a preview!⊘
Do you want full access?
Subscribe today to unlock all pages.
Trusted by 1+ million students worldwide
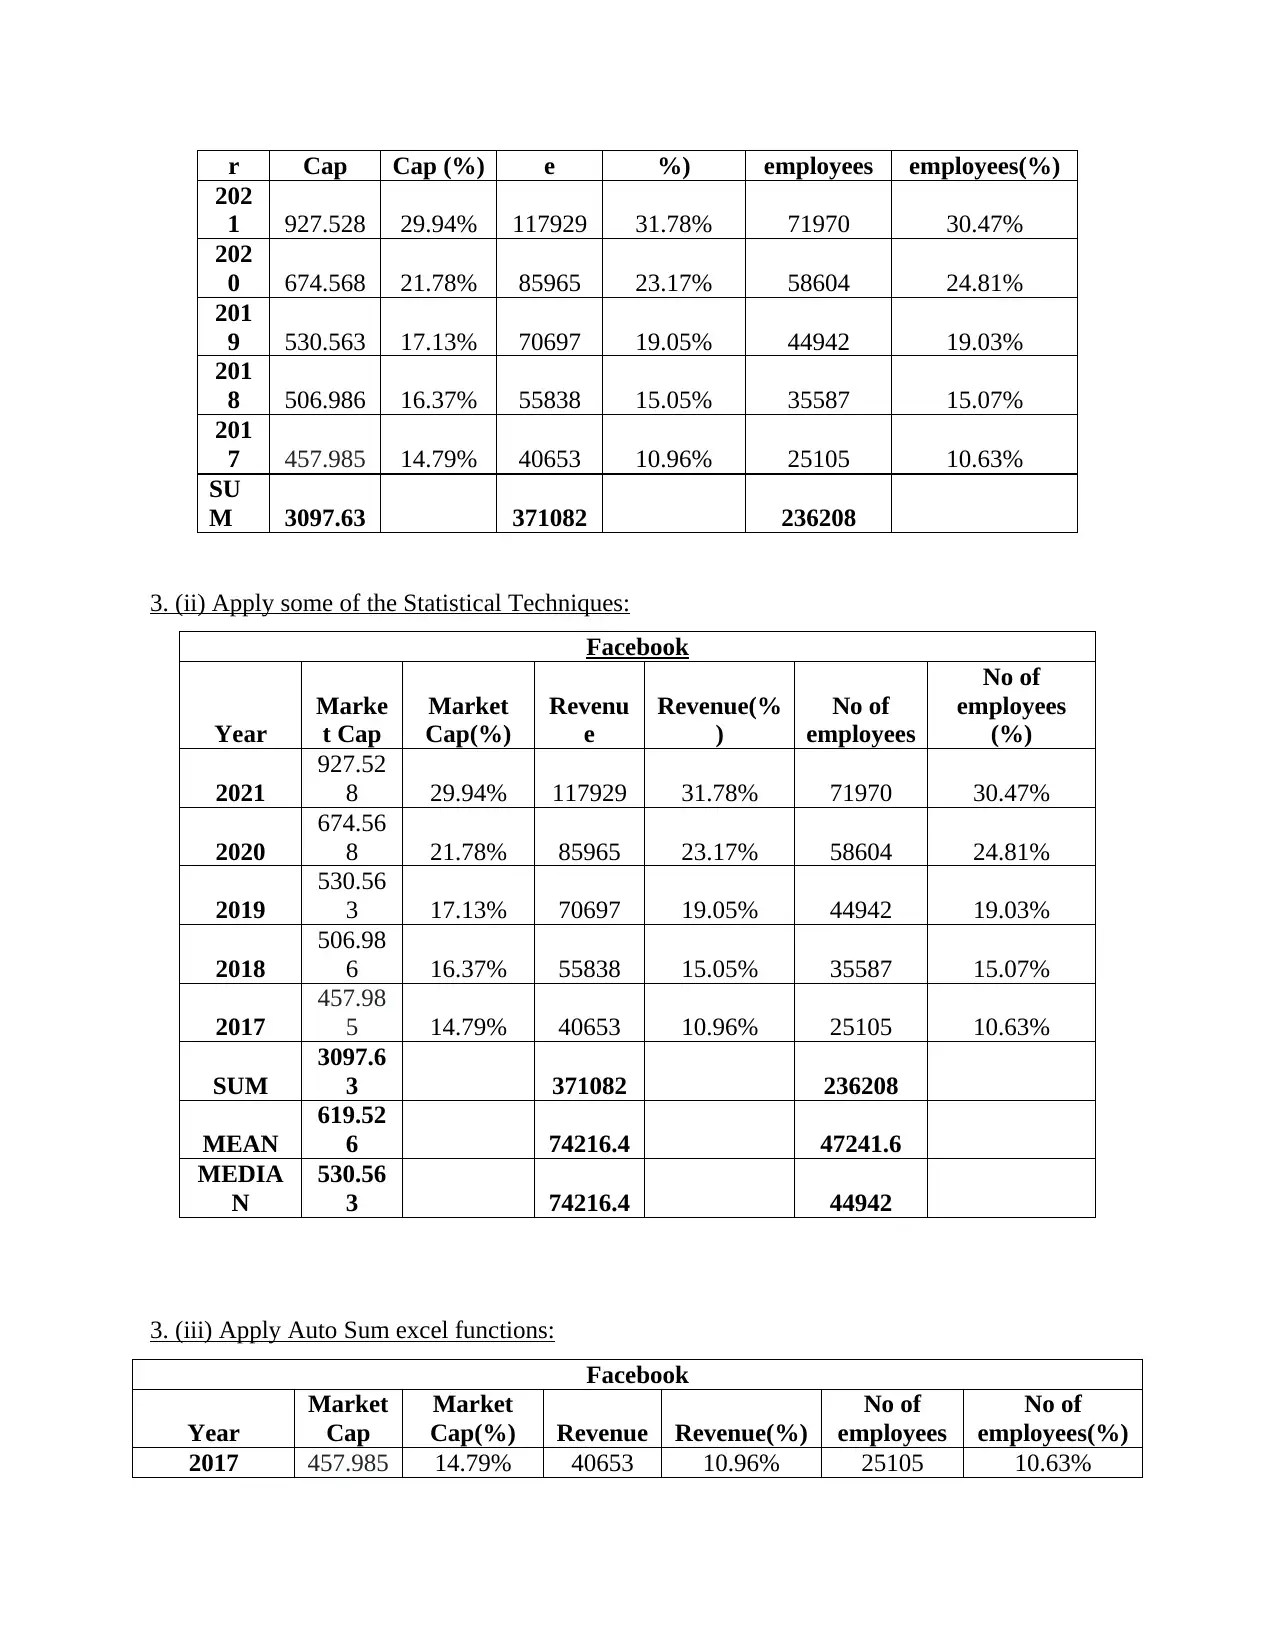
r Cap Cap (%) e %) employees employees(%)
202
1 927.528 29.94% 117929 31.78% 71970 30.47%
202
0 674.568 21.78% 85965 23.17% 58604 24.81%
201
9 530.563 17.13% 70697 19.05% 44942 19.03%
201
8 506.986 16.37% 55838 15.05% 35587 15.07%
201
7 457.985 14.79% 40653 10.96% 25105 10.63%
SU
M 3097.63 371082 236208
3. (ii) Apply some of the Statistical Techniques:
Facebook
Year
Marke
t Cap
Market
Cap(%)
Revenu
e
Revenue(%
)
No of
employees
No of
employees
(%)
2021
927.52
8 29.94% 117929 31.78% 71970 30.47%
2020
674.56
8 21.78% 85965 23.17% 58604 24.81%
2019
530.56
3 17.13% 70697 19.05% 44942 19.03%
2018
506.98
6 16.37% 55838 15.05% 35587 15.07%
2017
457.98
5 14.79% 40653 10.96% 25105 10.63%
SUM
3097.6
3 371082 236208
MEAN
619.52
6 74216.4 47241.6
MEDIA
N
530.56
3 74216.4 44942
3. (iii) Apply Auto Sum excel functions:
Facebook
Year
Market
Cap
Market
Cap(%) Revenue Revenue(%)
No of
employees
No of
employees(%)
2017 457.985 14.79% 40653 10.96% 25105 10.63%
202
1 927.528 29.94% 117929 31.78% 71970 30.47%
202
0 674.568 21.78% 85965 23.17% 58604 24.81%
201
9 530.563 17.13% 70697 19.05% 44942 19.03%
201
8 506.986 16.37% 55838 15.05% 35587 15.07%
201
7 457.985 14.79% 40653 10.96% 25105 10.63%
SU
M 3097.63 371082 236208
3. (ii) Apply some of the Statistical Techniques:
Year
Marke
t Cap
Market
Cap(%)
Revenu
e
Revenue(%
)
No of
employees
No of
employees
(%)
2021
927.52
8 29.94% 117929 31.78% 71970 30.47%
2020
674.56
8 21.78% 85965 23.17% 58604 24.81%
2019
530.56
3 17.13% 70697 19.05% 44942 19.03%
2018
506.98
6 16.37% 55838 15.05% 35587 15.07%
2017
457.98
5 14.79% 40653 10.96% 25105 10.63%
SUM
3097.6
3 371082 236208
MEAN
619.52
6 74216.4 47241.6
MEDIA
N
530.56
3 74216.4 44942
3. (iii) Apply Auto Sum excel functions:
Year
Market
Cap
Market
Cap(%) Revenue Revenue(%)
No of
employees
No of
employees(%)
2017 457.985 14.79% 40653 10.96% 25105 10.63%
Paraphrase This Document
Need a fresh take? Get an instant paraphrase of this document with our AI Paraphraser
2018 506.986 16.37% 55838 15.05% 35587 15.07%
2019 530.563 17.13% 70697 19.05% 44942 19.03%
2020 674.568 21.78% 85965 23.17% 58604 24.81%
2021 927.528 29.94% 117929 31.78% 71970 30.47%
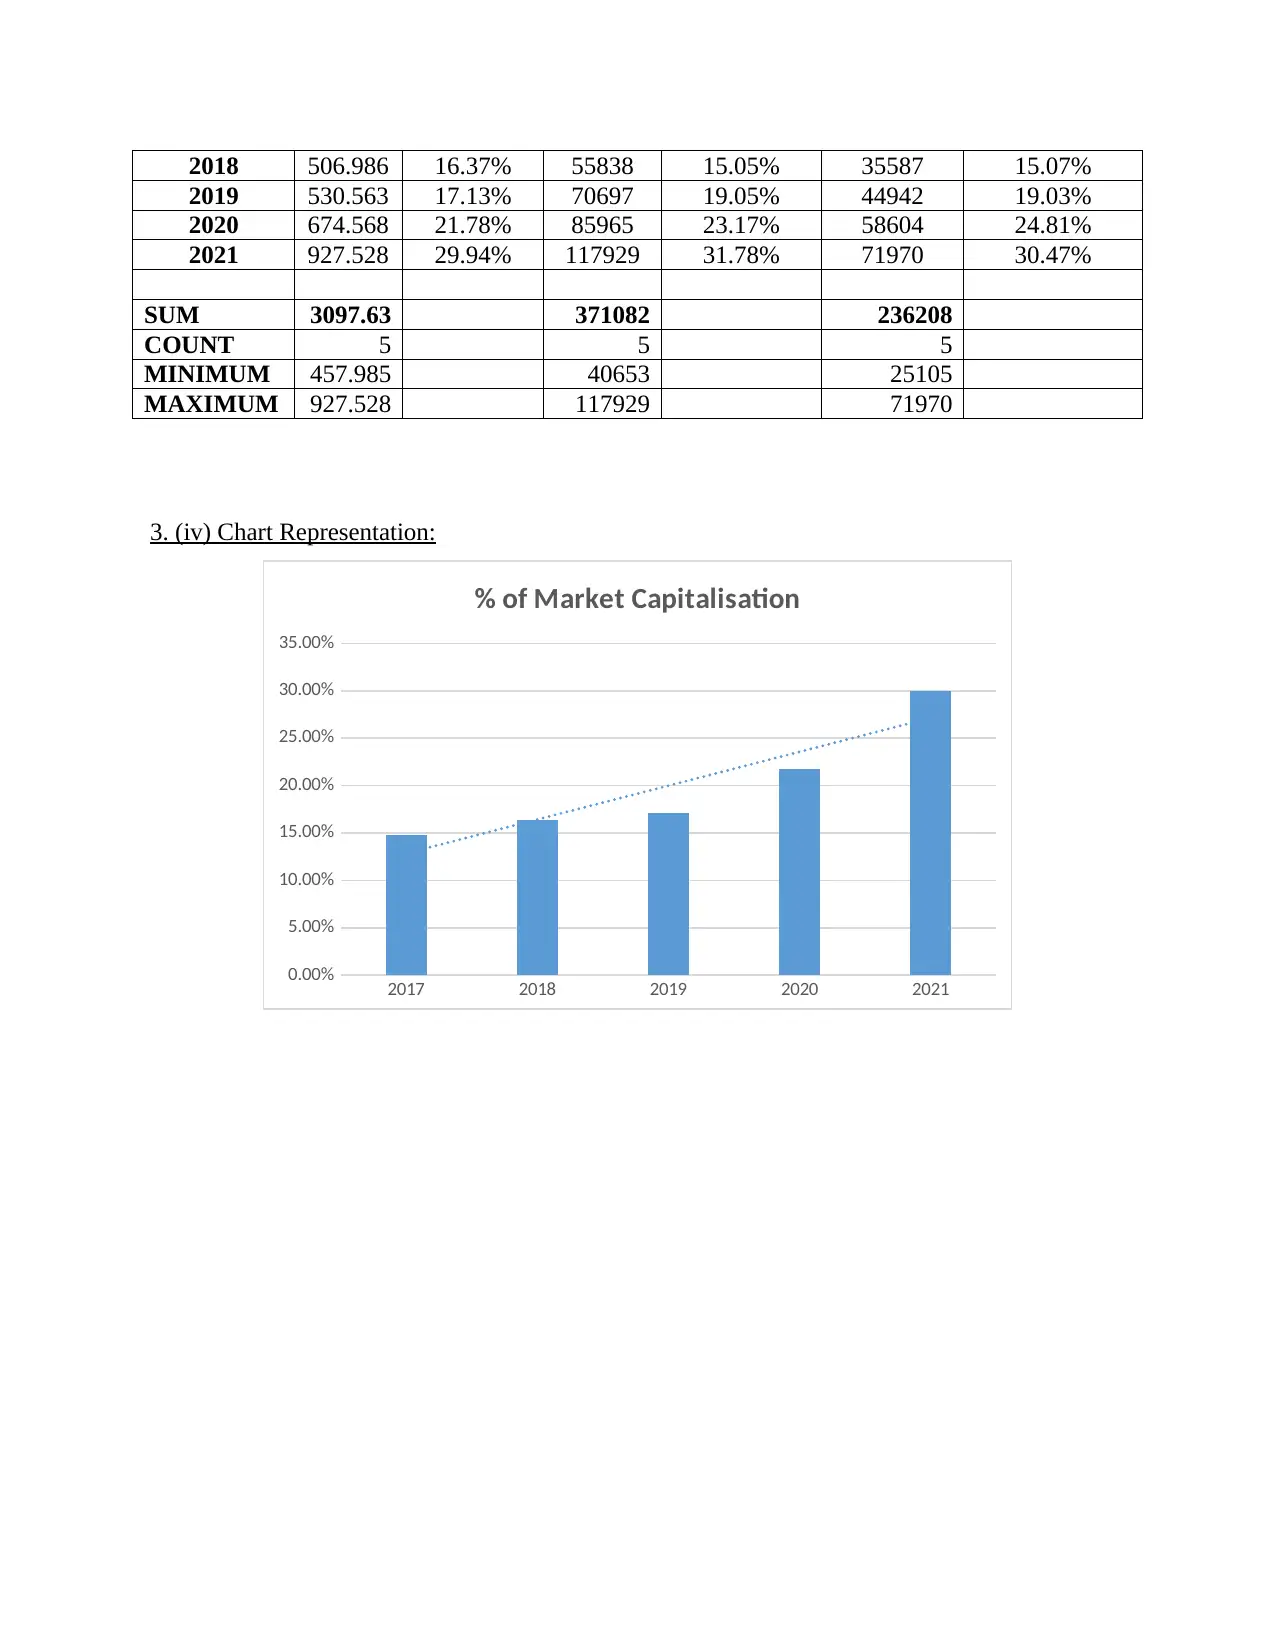
SUM 3097.63 371082 236208
COUNT 5 5 5
MINIMUM 457.985 40653 25105
MAXIMUM 927.528 117929 71970
3. (iv) Chart Representation:
2017 2018 2019 2020 2021
0.00%
5.00%
10.00%
15.00%
20.00%
25.00%
30.00%
35.00%
% of Market Capitalisation
2019 530.563 17.13% 70697 19.05% 44942 19.03%
2020 674.568 21.78% 85965 23.17% 58604 24.81%
2021 927.528 29.94% 117929 31.78% 71970 30.47%
SUM 3097.63 371082 236208
COUNT 5 5 5
MINIMUM 457.985 40653 25105
MAXIMUM 927.528 117929 71970
3. (iv) Chart Representation:
2017 2018 2019 2020 2021
0.00%
5.00%
10.00%
15.00%
20.00%
25.00%
30.00%
35.00%
% of Market Capitalisation
10.96%
15.05%
19.05%
23.17%
31.78%
Revenue(%)
2017 2018 2019 2020 2021
2017 2018 2019 2020 2021
0.00%
5.00%
10.00%
15.00%
20.00%
25.00%
30.00%
35.00%
Comaprison of Market Capitalisation and
Revenue
Market Cap(%) Revenue(%)
4. Elaborate the findings and analysis.
Sum: This technique is very easiest method to apply and get to know the overall condition
of the business. It is very effective and efficient to use without facing any problem. The Above
data is clearly shown that market capitalization, revenue and number of users of the face book
company. This company generate huge profit in past 5 years and work with full efficiency with
the dedicated staff who cooperates the firm at every point of time. Basically the formula to use
sum method is adding the data of every year and then you will get the total of capitalization of
market, revenue of the firm and number of users of the company.
⊘ This is a preview!⊘
Do you want full access?
Subscribe today to unlock all pages.
Trusted by 1+ million students worldwide
Mean: This method is helps to know the idea for the overall position of the company and it
easy to calculate for implementing the formula. The formula to calculate the mean is adding the
each and every individual item in a group and dividing it by total number of years. This
technique is simple to use as compare to median because of this company can easy to know the
current position of the business it will show the clear view of the firm. The above data show the
mean of past 5 years for revenue of the company, market capitalization and number of users.
They show the overall performance of the business in each of them.
Median: In this point this type of method is very complicated as compare to the mean
technique. The calculation of this technique is complex and also show the current position of the
business and show that how much company will grow in near future. Basically they find the mid-
value for the given items available in the data. As it can be seen that the above data of excel
show the median of five years is 2019 for market capitalisation and the value is 530.56 and same
as they show the median of the revenue and the number of users of the firm. The formula to
calculate the median is N+1 / 2.
The above is the presentattion of the facebook figures in graphical form which depects
their performance over the period starting from 2017 to 2021. The first chart shoes their market
capitalisation positioning that has been consistantly incresing which indicates that as comparet to
other social media platform they are performing well as depicted in chart also which is in
incresing direction.
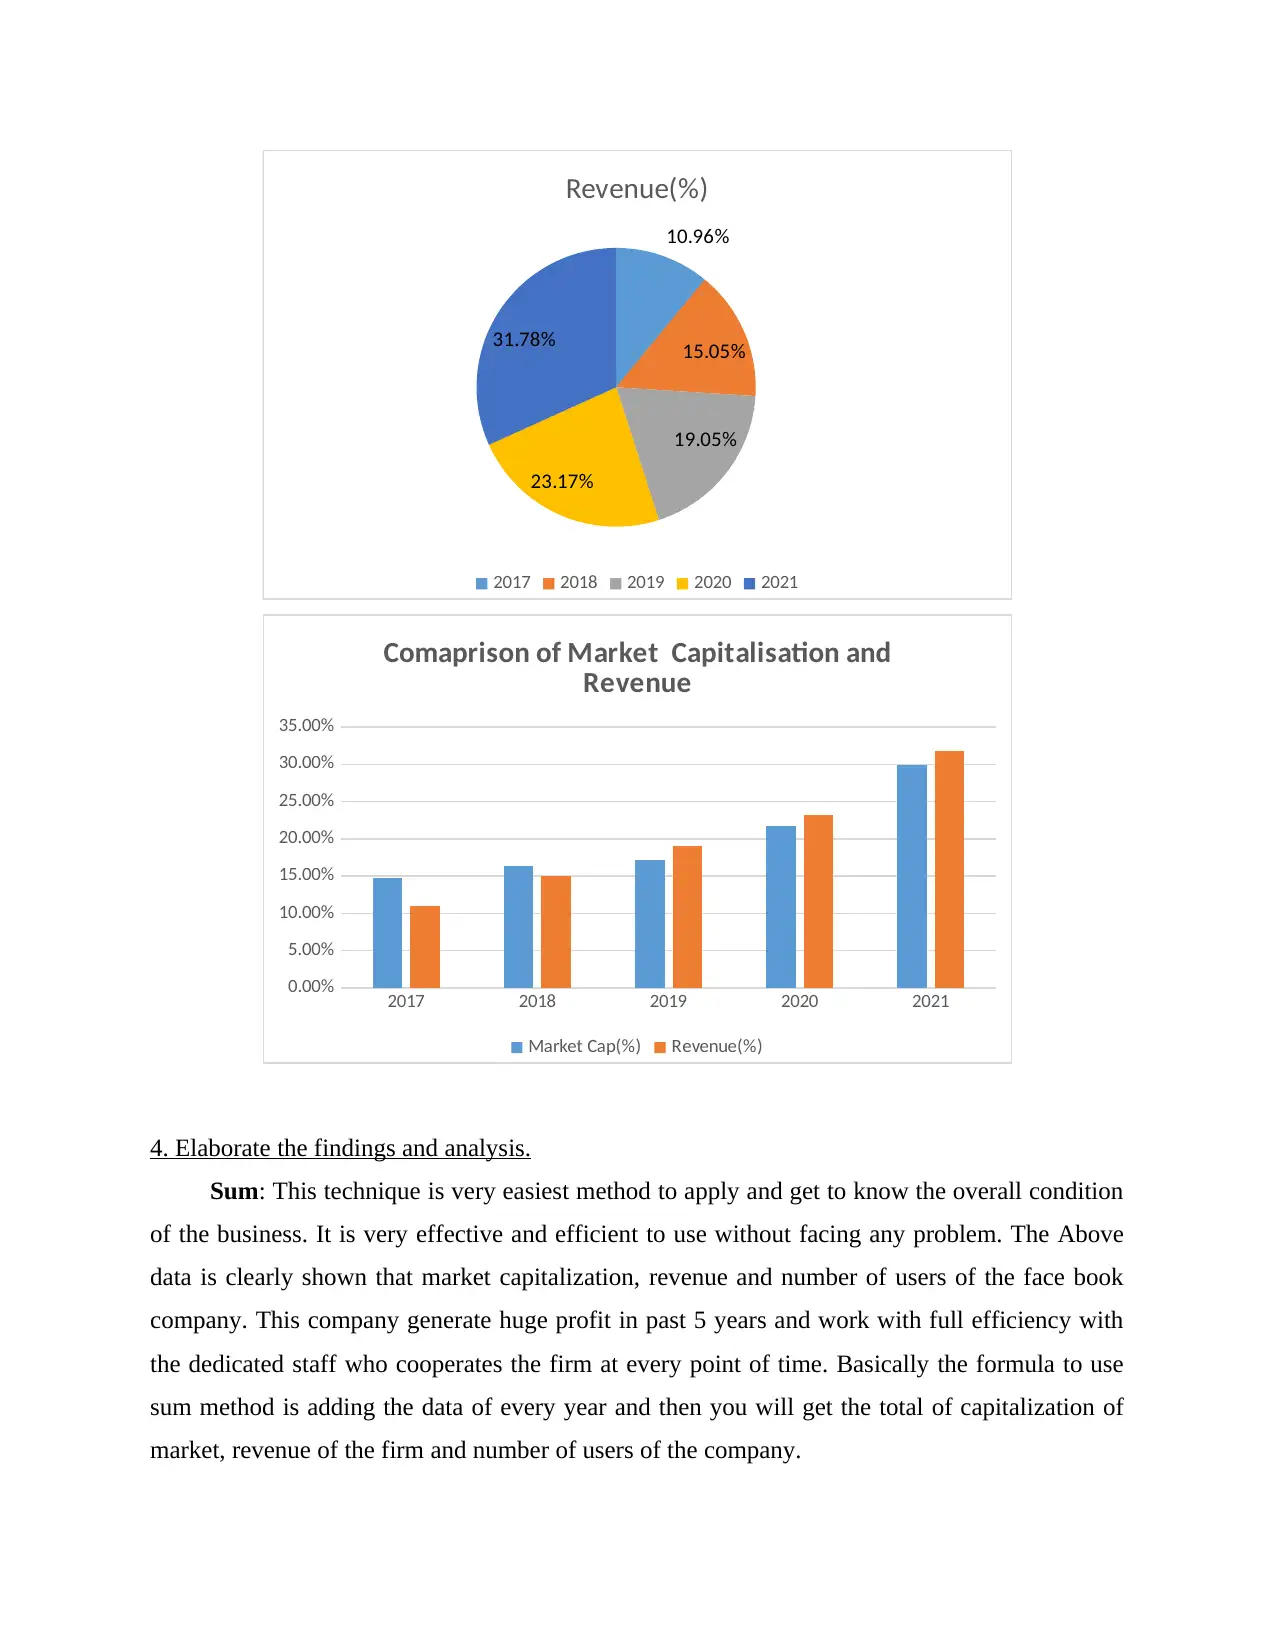
The other chart represent their revenues in different years that what revenues they have
gererated during such fiver consequetive years which is highest in 2021 around 31.78 % which is
almost shows their dominance in the market of online platform. The last and the final chart
relates to comparison between market capitalisation and revenue during 2017 to 2021which is
increasing in the parallal direction that shows that they are effectivly and efficinetly utilising
their resources that why they are gererating such higher amount of volume in such short span of
time.
CONCLUSION
The report prepared above depicts the usage of functions such as SUM, MINIMUM,
MAXIMUM, COUNT, Number of employees, Market capitalisation. It helps to find out what is
the growth rate observed in company for a time duration of 5 years and what is expected
easy to calculate for implementing the formula. The formula to calculate the mean is adding the
each and every individual item in a group and dividing it by total number of years. This
technique is simple to use as compare to median because of this company can easy to know the
current position of the business it will show the clear view of the firm. The above data show the
mean of past 5 years for revenue of the company, market capitalization and number of users.
They show the overall performance of the business in each of them.
Median: In this point this type of method is very complicated as compare to the mean
technique. The calculation of this technique is complex and also show the current position of the
business and show that how much company will grow in near future. Basically they find the mid-
value for the given items available in the data. As it can be seen that the above data of excel
show the median of five years is 2019 for market capitalisation and the value is 530.56 and same
as they show the median of the revenue and the number of users of the firm. The formula to
calculate the median is N+1 / 2.
The above is the presentattion of the facebook figures in graphical form which depects
their performance over the period starting from 2017 to 2021. The first chart shoes their market
capitalisation positioning that has been consistantly incresing which indicates that as comparet to
other social media platform they are performing well as depicted in chart also which is in
incresing direction.
The other chart represent their revenues in different years that what revenues they have
gererated during such fiver consequetive years which is highest in 2021 around 31.78 % which is
almost shows their dominance in the market of online platform. The last and the final chart
relates to comparison between market capitalisation and revenue during 2017 to 2021which is
increasing in the parallal direction that shows that they are effectivly and efficinetly utilising
their resources that why they are gererating such higher amount of volume in such short span of
time.
CONCLUSION
The report prepared above depicts the usage of functions such as SUM, MINIMUM,
MAXIMUM, COUNT, Number of employees, Market capitalisation. It helps to find out what is
the growth rate observed in company for a time duration of 5 years and what is expected
Paraphrase This Document
Need a fresh take? Get an instant paraphrase of this document with our AI Paraphraser
performance of firm in near future. The report further helps to interpret the data and information
collected so far and what it serves in the eye of people linked and employees engaged. It helps to
compute revenues generate by the company and whether the company is successful in hiring
adequate staff or not. It also lays down an idea as by what amount the revenue is seen to rise or
fall and what could be the related reasons behind it. There are many methods that are helpful in
calculating the increase and decrease of market capitalisation in present market. Thus, the report
helps to give an idea about the researcher as well that which data is being chosen by the
respective person and the topic chosen.
REFERENCES
Books and Journals
Cacciatore, M.A. And et.al., 2018. Is Facebook making us dumber? Exploring social media use
as a predictor of political knowledge. Journalism & mass communication quarterly.
95(2). pp.404-424.
Buchanan, S.A., Dorey, J. and Pierce Meyer, K., 2018. Traveling through: exploring doctoral
demographics in archival studies. Archival Science. 18(2). pp.143-163.
Kwak, K.T., Oh, C.J. and Lee, S.W., 2021. Who uses paid over-the-top services and why? Cross-
national comparisons of consumer demographics and values. Telecommunications
Policy, 45(7), p.102168.
Tin, D. and et.al., 2021. 50 years of mass-fatality terrorist attacks: a retrospective study of target
demographics, modalities, and injury patterns to better inform future counter-terrorism
medicine preparedness and response. Prehospital and disaster medicine. 36(5). pp.531-
535.
García Cabello, J., 2019. A model towards global demographics: an application—a universal
bank branch geolocator based on branch size. Soft Computing. 23(16). pp.7193-7205.
⊘ This is a preview!⊘
Do you want full access?
Subscribe today to unlock all pages.
Trusted by 1+ million students worldwide
1 out of 9
Your All-in-One AI-Powered Toolkit for Academic Success.
+13062052269
info@desklib.com
Available 24*7 on WhatsApp / Email
![[object Object]](/_next/static/media/star-bottom.7253800d.svg)
Unlock your academic potential
Copyright © 2020–2026 A2Z Services. All Rights Reserved. Developed and managed by ZUCOL.