Impact of Online Users on Revenue of Facebook: A Quantitative Analysis
VerifiedAdded on 2023/06/10
|11
|2583
|410
AI Summary
This report presents a quantitative analysis of the impact of online users on the revenue of Facebook. The report includes data collection, analysis, and visualization using Excel. The findings suggest a positive relationship between the number of online users and revenue. The report also highlights the importance of teamwork and communication in completing the project. Future recommendations include delegating tasks based on individual capabilities and improving communication.
Contribute Materials
Your contribution can guide someone’s learning journey. Share your
documents today.

Individual report
Secure Best Marks with AI Grader
Need help grading? Try our AI Grader for instant feedback on your assignments.
TABLE OF CONTENTS
Project Aims................................................................................................................................2
Objectives....................................................................................................................................2
Presenting the contribution of the group and methodology.........................................................2
Data collection.............................................................................................................................2
Appropriateness of a data............................................................................................................3
Analysis.......................................................................................................................................3
Presenting how the method of presenting and visualizing the data is appropriate......................7
Achievement and conclusion.......................................................................................................7
How did the group function together...........................................................................................7
Presenting the issues that need to be overcome in future............................................................8
Conclusion...................................................................................................................................8
REFERENCES..............................................................................................................................10
Project Aims
The current project aim is to determine the impact of users over revenue of Facebook and
that is why, the results may be vary. With the help of this outcome, the chances of implementing
steps will be change because to raise the performance of the company, there is a need to
determine he loophole.
Objectives
With the help of present study, the scholar try to attain the relationship between the profit
and online users within Facebook.
Presenting the contribution of the group and methodology
In the present study, the contribution of all the team members is excellent because
without anyone of them it is not possible to complete the project. Also, each member has their
own quality and that is why, the chances of generating results will be higher such that one of
them have a good research skill and that is why, he researches about the authentic data of
Facebook with regard to online user and revenue from last 10 years. Moreover, one of us have a
good skill pertaining to visualization so he extracts the data and draw graph with the help of
excel in order to meet the defined aim (Ma and Fildes, 2021). Whereas, another member of a
team has a good statistics knowledge so he chooses to apply the tool into a data in order to
determine the relationship between the variables. Therefore, it has been stated that due to proper
contribution of each member, the chances of completing the data will be high and this in turn
assist to improve the results.
The methodology used for the current study is quantitative because the entire project is
deal with numbers and figures. With the help of this chosen methodology, the data will be
extracted easily and for analysis, excel as an analytical tool used in order to derive better
outcome.
Data collection
The data is connected with the official site of Facebook which provide a list of figures in
term of revenue so that effective outcome can be generated (Facebook Revenue and Usage
Statistics (2022), 2022).
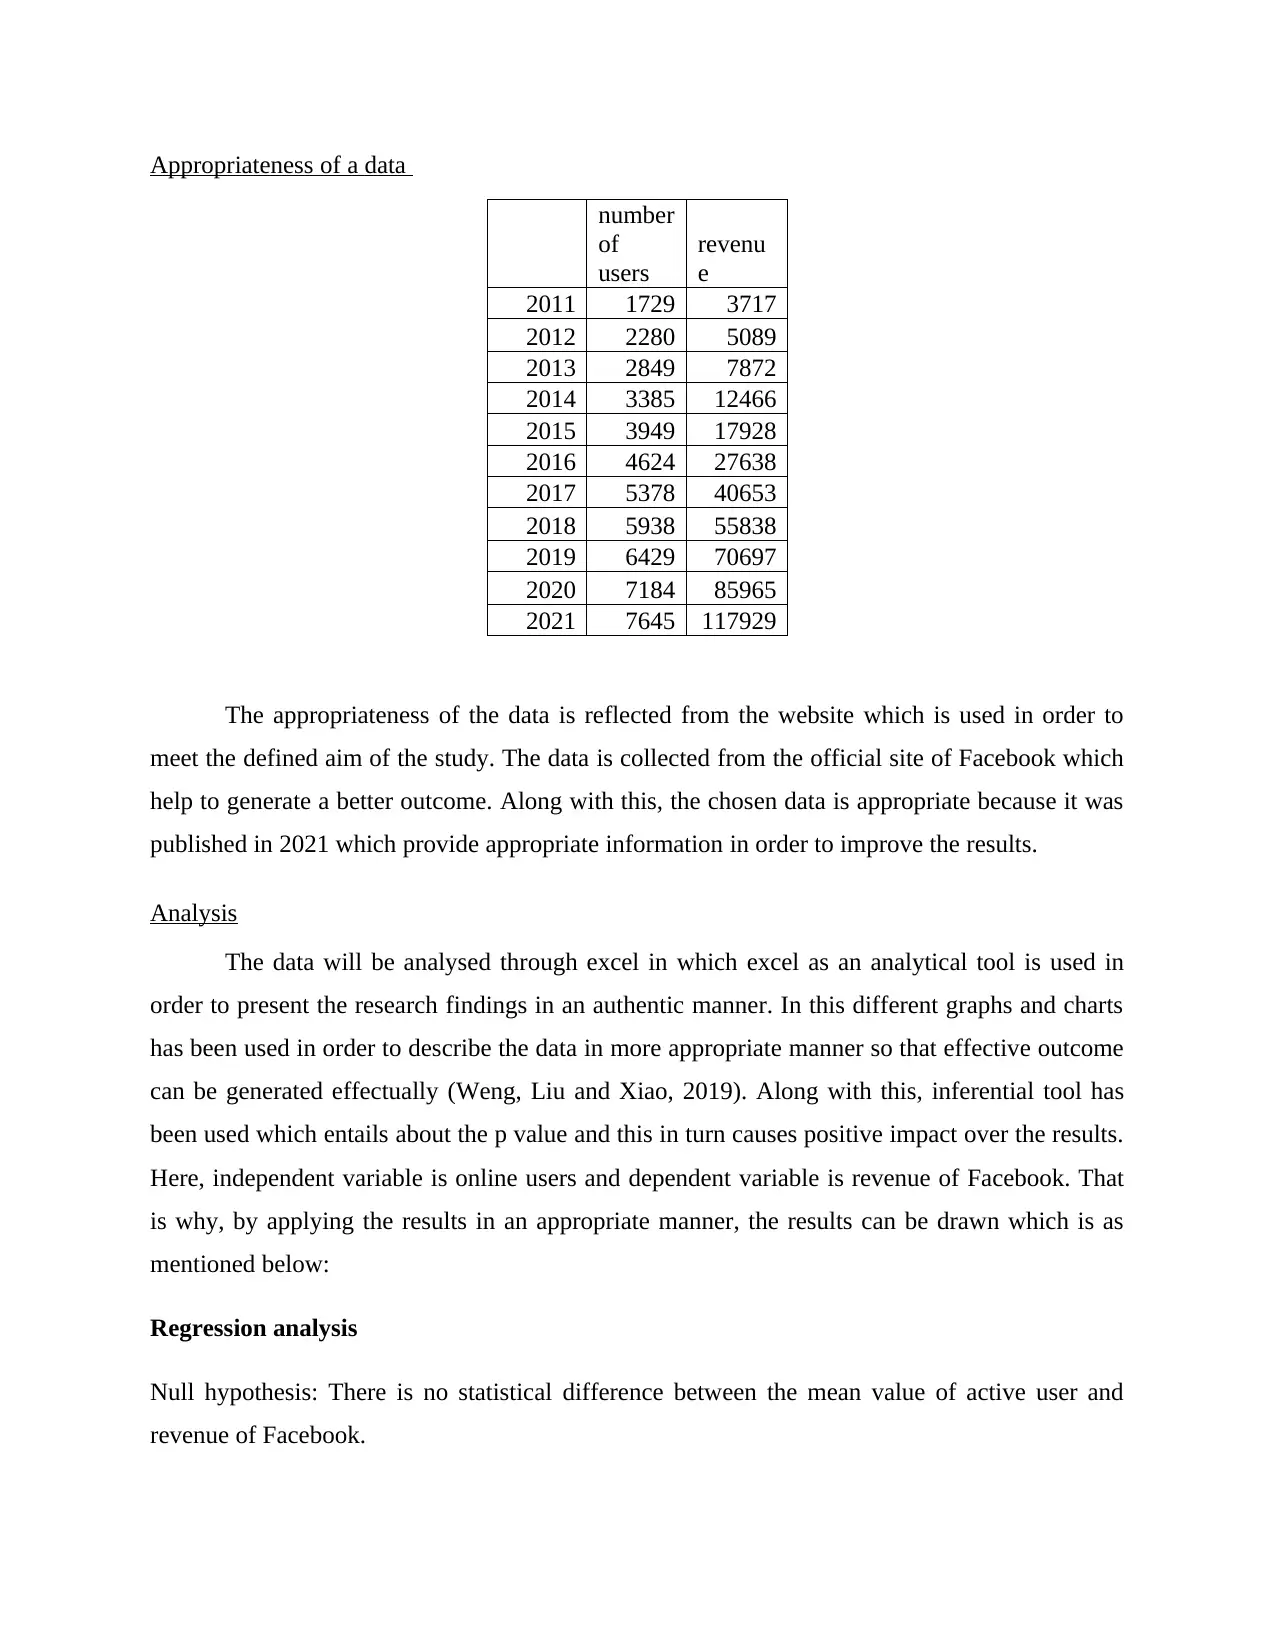
Appropriateness of a data
number
of
users
revenu
e
2011 1729 3717
2012 2280 5089
2013 2849 7872
2014 3385 12466
2015 3949 17928
2016 4624 27638
2017 5378 40653
2018 5938 55838
2019 6429 70697
2020 7184 85965
2021 7645 117929
The appropriateness of the data is reflected from the website which is used in order to
meet the defined aim of the study. The data is collected from the official site of Facebook which
help to generate a better outcome. Along with this, the chosen data is appropriate because it was
published in 2021 which provide appropriate information in order to improve the results.
Analysis
The data will be analysed through excel in which excel as an analytical tool is used in
order to present the research findings in an authentic manner. In this different graphs and charts
has been used in order to describe the data in more appropriate manner so that effective outcome
can be generated effectually (Weng, Liu and Xiao, 2019). Along with this, inferential tool has
been used which entails about the p value and this in turn causes positive impact over the results.
Here, independent variable is online users and dependent variable is revenue of Facebook. That
is why, by applying the results in an appropriate manner, the results can be drawn which is as
mentioned below:
Regression analysis
Null hypothesis: There is no statistical difference between the mean value of active user and
revenue of Facebook.
Secure Best Marks with AI Grader
Need help grading? Try our AI Grader for instant feedback on your assignments.
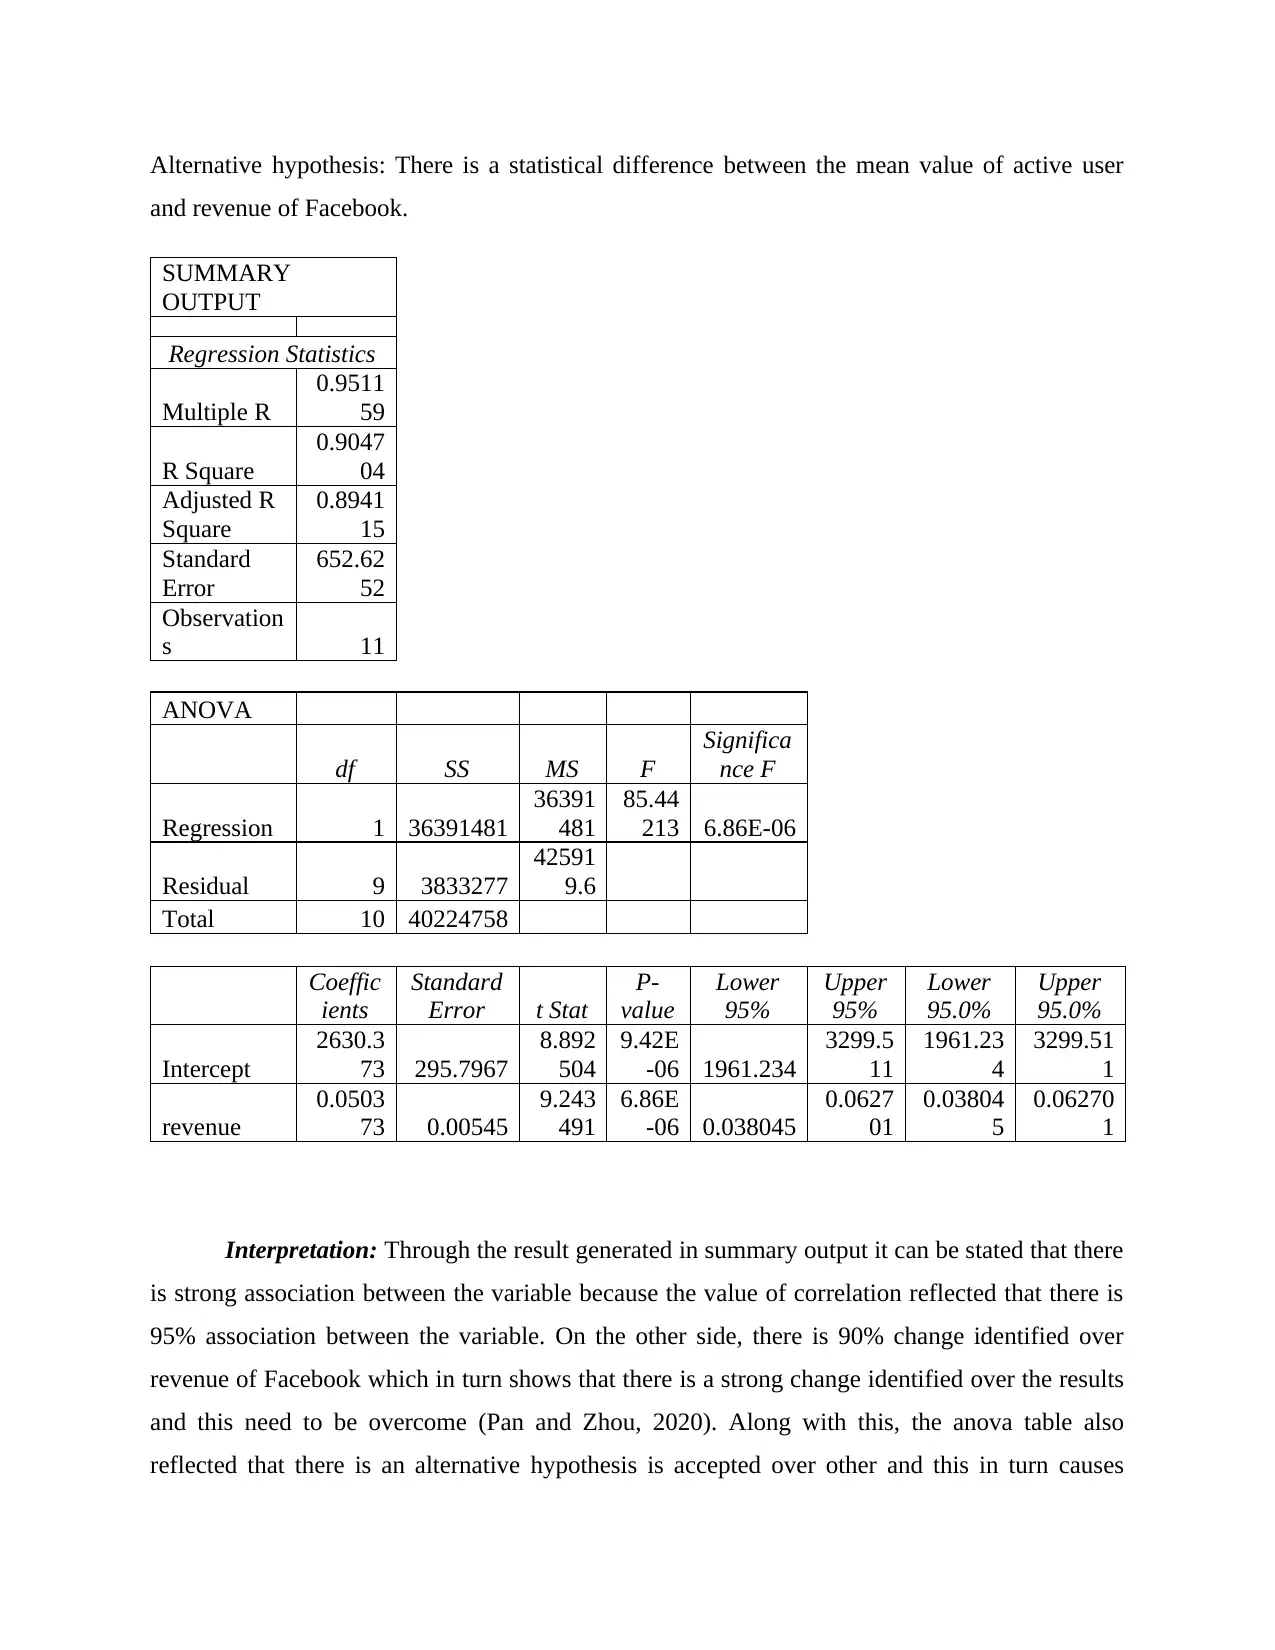
Alternative hypothesis: There is a statistical difference between the mean value of active user
and revenue of Facebook.
SUMMARY
OUTPUT
Regression Statistics
Multiple R
0.9511
59
R Square
0.9047
04
Adjusted R
Square
0.8941
15
Standard
Error
652.62
52
Observation
s 11
ANOVA
df SS MS F
Significa
nce F
Regression 1 36391481
36391
481
85.44
213 6.86E-06
Residual 9 3833277
42591
9.6
Total 10 40224758
Coeffic
ients
Standard
Error t Stat
P-
value
Lower
95%
Upper
95%
Lower
95.0%
Upper
95.0%
Intercept
2630.3
73 295.7967
8.892
504
9.42E
-06 1961.234
3299.5
11
1961.23
4
3299.51
1
revenue
0.0503
73 0.00545
9.243
491
6.86E
-06 0.038045
0.0627
01
0.03804
5
0.06270
1
Interpretation: Through the result generated in summary output it can be stated that there
is strong association between the variable because the value of correlation reflected that there is
95% association between the variable. On the other side, there is 90% change identified over
revenue of Facebook which in turn shows that there is a strong change identified over the results
and this need to be overcome (Pan and Zhou, 2020). Along with this, the anova table also
reflected that there is an alternative hypothesis is accepted over other and this in turn causes
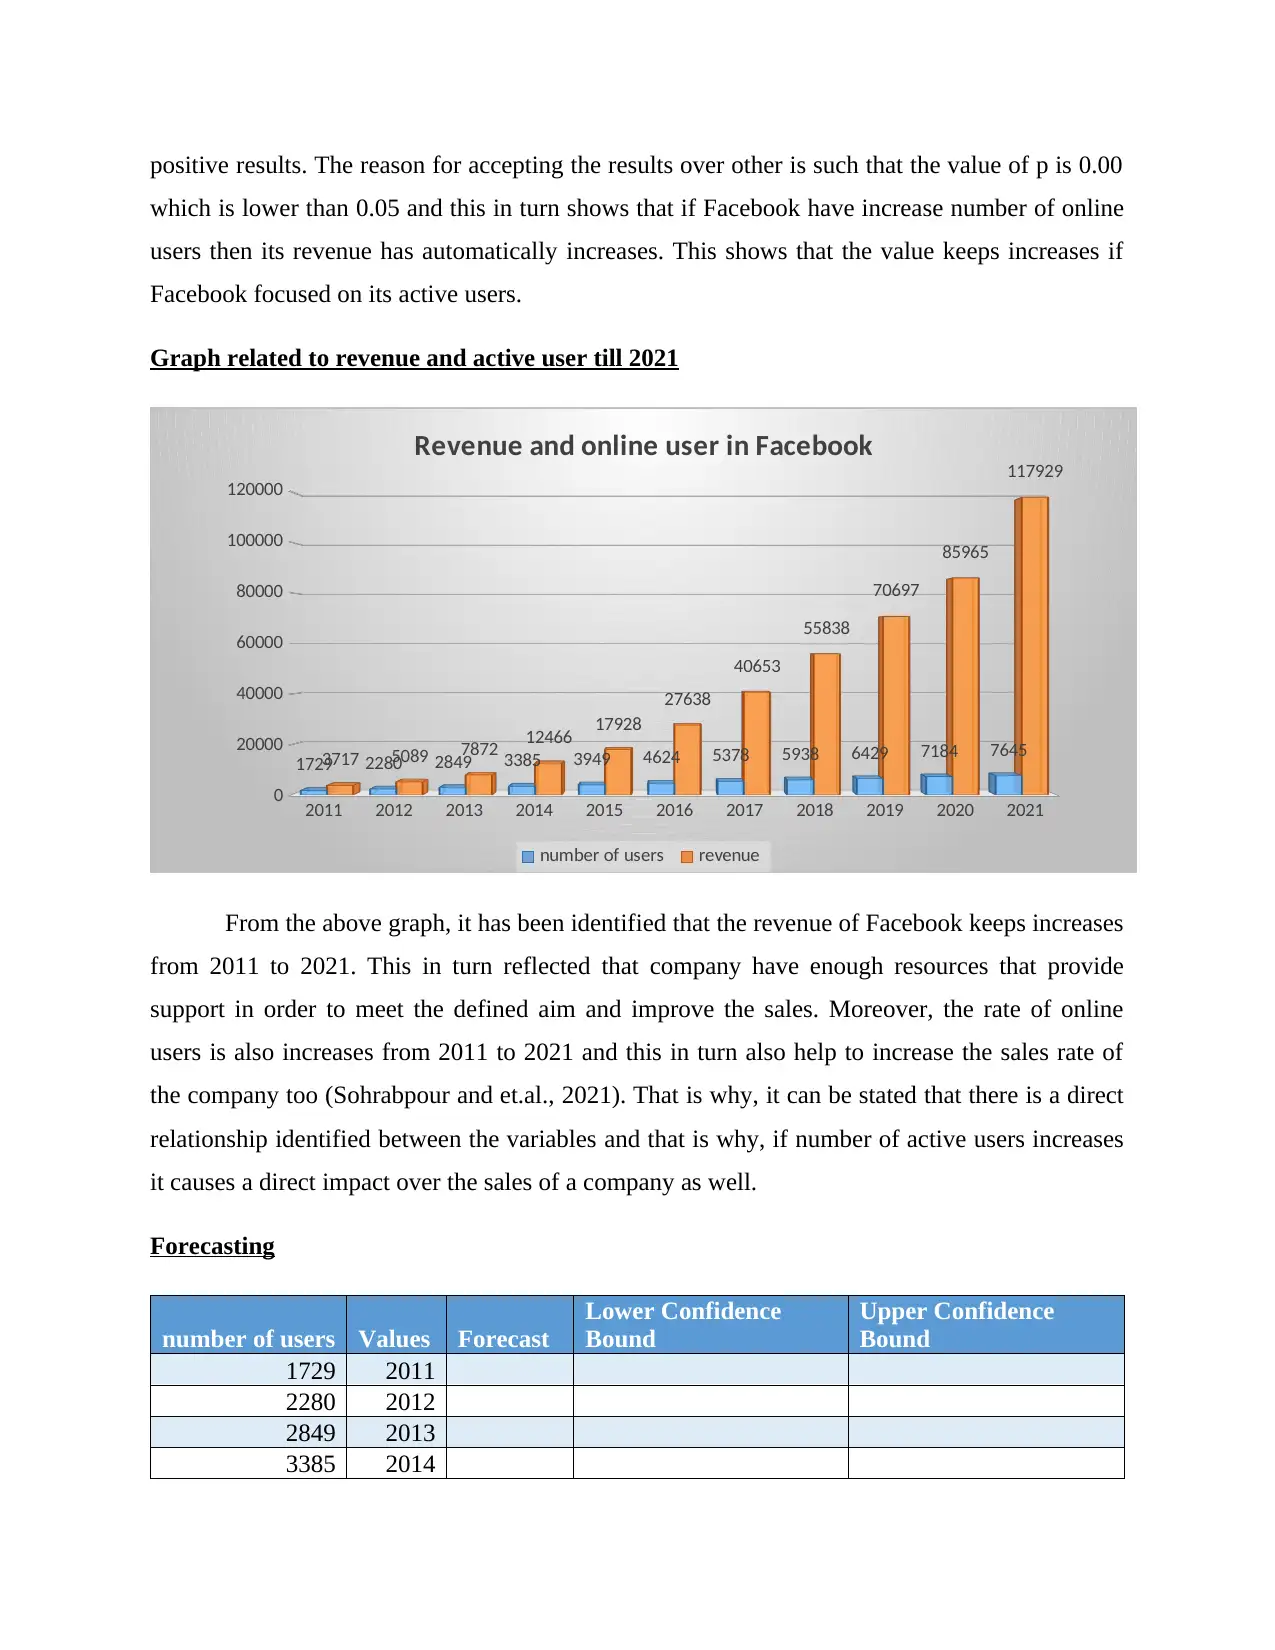
positive results. The reason for accepting the results over other is such that the value of p is 0.00
which is lower than 0.05 and this in turn shows that if Facebook have increase number of online
users then its revenue has automatically increases. This shows that the value keeps increases if
Facebook focused on its active users.
Graph related to revenue and active user till 2021
2011 2012 2013 2014 2015 2016 2017 2018 2019 2020 2021
0
20000
40000
60000
80000
100000
120000
1729 2280 2849 3385 3949 4624 5378 5938 6429 7184 7645
3717 5089 7872 12466 17928
27638
40653
55838
70697
85965
117929
Revenue and online user in Facebook
number of users revenue
From the above graph, it has been identified that the revenue of Facebook keeps increases
from 2011 to 2021. This in turn reflected that company have enough resources that provide
support in order to meet the defined aim and improve the sales. Moreover, the rate of online
users is also increases from 2011 to 2021 and this in turn also help to increase the sales rate of
the company too (Sohrabpour and et.al., 2021). That is why, it can be stated that there is a direct
relationship identified between the variables and that is why, if number of active users increases
it causes a direct impact over the sales of a company as well.
Forecasting
number of users Values Forecast
Lower Confidence
Bound
Upper Confidence
Bound
1729 2011
2280 2012
2849 2013
3385 2014
3949 2015
4345.75 2015.5
4624 2016
5378 2017
5938 2018
6429 2019
7184 2020
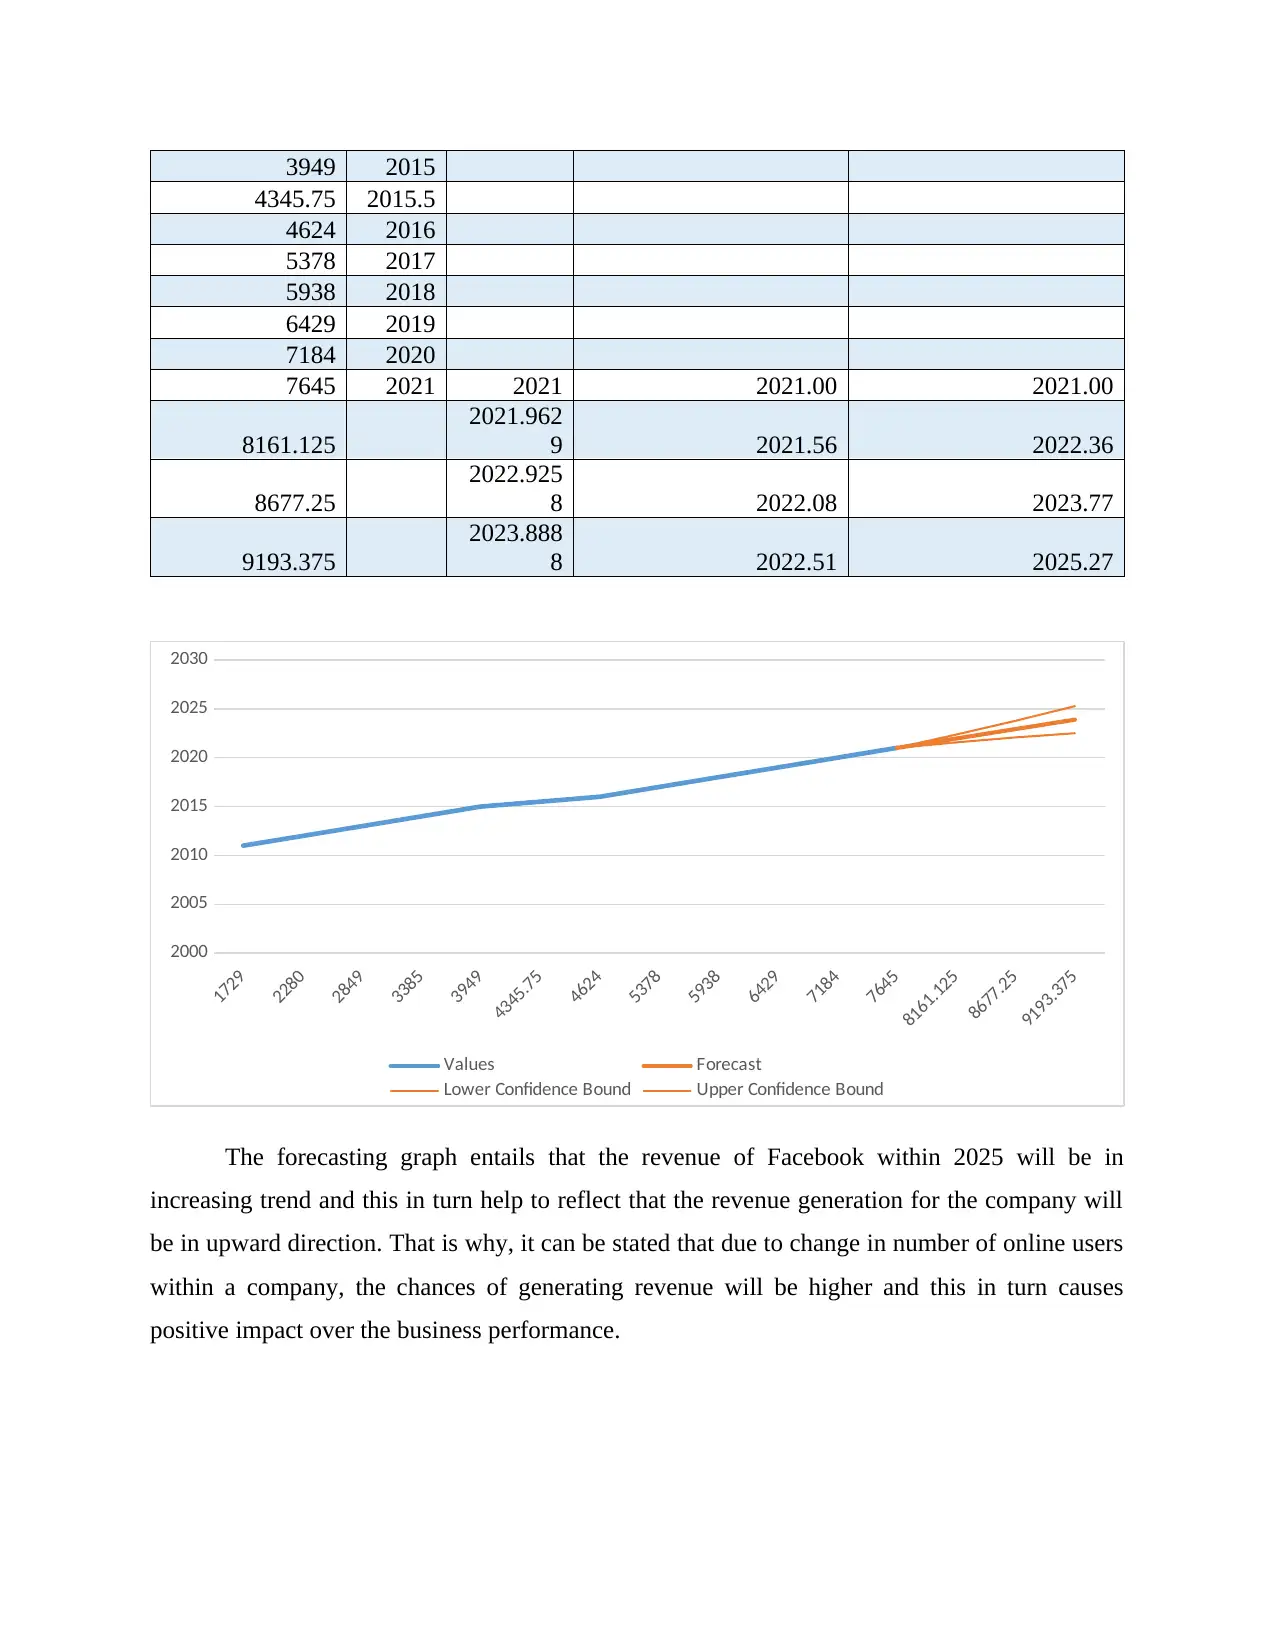
7645 2021 2021 2021.00 2021.00
8161.125
2021.962
9 2021.56 2022.36
8677.25
2022.925
8 2022.08 2023.77
9193.375
2023.888
8 2022.51 2025.27
1729
2280
2849
3385
3949
4345.75
4624
5378
5938
6429
7184
7645
8161.125
8677.25
9193.375
2000
2005
2010
2015
2020
2025
2030
Values Forecast
Lower Confidence Bound Upper Confidence Bound
The forecasting graph entails that the revenue of Facebook within 2025 will be in
increasing trend and this in turn help to reflect that the revenue generation for the company will
be in upward direction. That is why, it can be stated that due to change in number of online users
within a company, the chances of generating revenue will be higher and this in turn causes
positive impact over the business performance.
4345.75 2015.5
4624 2016
5378 2017
5938 2018
6429 2019
7184 2020
7645 2021 2021 2021.00 2021.00
8161.125
2021.962
9 2021.56 2022.36
8677.25
2022.925
8 2022.08 2023.77
9193.375
2023.888
8 2022.51 2025.27
1729
2280
2849
3385
3949
4345.75
4624
5378
5938
6429
7184
7645
8161.125
8677.25
9193.375
2000
2005
2010
2015
2020
2025
2030
Values Forecast
Lower Confidence Bound Upper Confidence Bound
The forecasting graph entails that the revenue of Facebook within 2025 will be in
increasing trend and this in turn help to reflect that the revenue generation for the company will
be in upward direction. That is why, it can be stated that due to change in number of online users
within a company, the chances of generating revenue will be higher and this in turn causes
positive impact over the business performance.
Paraphrase This Document
Need a fresh take? Get an instant paraphrase of this document with our AI Paraphraser
Presenting how the method of presenting and visualizing the data is appropriate
The method used for presenting and visualizing the data is Excel which in turn assist to
understand the trend and this helps to generate a better outcome (Guerrero, 2018). With the help
of this tool, scholar can display the data analysis in different ways, but for the present study only
chart and inferential tool is used that help to create a better outcome. In order to understand the
relationship between the variable, regression analysis has been used. Apart from this, for
visualizing the data, forecasting tool has been used that provide in-depth detail pertaining to
future forecasting that assist to create a better outcome. Overall, it can be stated that with the
help of Excel, company can generated an effective outcome which further help to improve the
results and answer the research objectives as well.
Achievement and conclusion
In accordance with the above results, it has been identified that there is a positive
relationship between the variable which in turn reflected that when the active user of Facebook
will be decreases the sales of a company will also decrease. This in turn shows that company
need to focus upon the users so that they can meet the defined aim and improve the results as
well. Overall, the findings assist to determine the dependency of sales/revenue upon online users
of Facebook. Also, the summary of the present study entails that the sales of a company will be
increases from last many years and in future the same will be performed and this help to create a
positive impact over the business performance. That is why, the current study will be helpful to
analyse the relationship between the sales and online active users.
How did the group function together
The group function together in order to attain the defined aim in an effective manner
because the work is distributed equally among all the members that help to improve the results.
Further, due to having unique capabilities, the project is able to meet the defined aim of the study
and prove the relationship between the variable so that effective outcome can be generated
(Hunter and et.al., 2021). In the future when such project will be performed, I ensure to work in
different manner such that member will work according to their weakness so that project will be
completed in a way where members can convert their weakness into strength. In this, each team
member will be working with those who have low knowledge in any field and this in turn work
will be completed and members can improve the weak points so that effective outcome can be
generated. Thus, it can be stated that with the help of teamwork, the chances of completing the
project will be high and this in turn cause positive impact over the results so that effective
outcome can be generated. Also, it can be stated that delegate the work as per the capability of
the team members then the chances of completing the entire project will be high. That is why, it
has been further realized that learning from the current project’s loopholes, team should ensure
that such things will not be repeated in near future and this causes positive impact over the
results.
Presenting the issues that need to be overcome in future.
While working in a team, the chances of poor communication always high because each
member have their own views and due to fluctuation in their view, issue arise that need to be
overcome. Also, another issue faced during the present report is related to lack of time and this in
turn affect the results. Further, in order to improve such issues, there is a need to implement the
changes which include proper discussion regarding the task need to be performed and this in turn
help to improve the results. In future when the same project will be conducted, team will be
ensure that there should be proper mode of communication used that help to create a better
outcome and improve the results as well (Mayes, 2020). Such that face to face discussion need to
be performed that help to create a better outcome and improve the results as well. Moreover, to
minimize another challenge it is to be suggested to delegate the task to each employee on the
basis of their capability, this in turn reduce the extra consumption of time and perform the work
in an appropriate manner. That is why, it has been reflected that once the project has completed
and same will be performed then learn from the changes so that it will not cause any negative
impact over the project.
Conclusion
By summing up above report it has been concluded that there is a positive impact over
the results such that through regression the relationship has proved and that is why, when the
number of online users increases then it increase the chance of revenue of a company. Also, the
study has been concluded that excel as a data analytical tool used which in turn causes positive
impact over the results and this causes better outcome. Hence, the result reflected that forecasting
of the sales will be higher and this causes positive impact over the sales in order to improve the
business. Also, it has been identified that working in a team will be more beneficial for the

company and this in turn assist to create a better outcome which help to meet the defined aim and
make recommendation to improve the issues as well.
make recommendation to improve the issues as well.
Secure Best Marks with AI Grader
Need help grading? Try our AI Grader for instant feedback on your assignments.
REFERENCES
Books and Journals
Guerrero, H., 2018. Excel Data Analysis: Modeling and Simulation. Springer.
Hunter, G.W. and et.al., 2021. The EXCEL Trial: The Interventionalists' Perspective. European
Cardiology Review. 16.
Ma, S. and Fildes, R., 2021. Retail sales forecasting with meta-learning. European Journal of
Operational Research. 288(1). pp.111-128.
Mayes, T. R., 2020. Financial analysis with microsoft excel. Cengage Learning.
Pan, H. and Zhou, H., 2020. Study on convolutional neural network and its application in data
mining and sales forecasting for E-commerce. Electronic Commerce Research. 20(2).
pp.297-320.
Sohrabpour, V. and et.al., 2021. Export sales forecasting using artificial
intelligence. Technological Forecasting and Social Change. 163. p.120480.
Weng, T., Liu, W. and Xiao, J., 2019. Supply chain sales forecasting based on lightGBM and
LSTM combination model. Industrial Management & Data Systems.
Online
Facebook Revenue and Usage Statistics (2022). 2022. [Online]. Available through: <
https://www.businessofapps.com/data/facebook-statistics/>.
1 out of 11
Related Documents


Your All-in-One AI-Powered Toolkit for Academic Success.
+13062052269
info@desklib.com
Available 24*7 on WhatsApp / Email
![[object Object]](/_next/static/media/star-bottom.7253800d.svg)
Unlock your academic potential
© 2024 | Zucol Services PVT LTD | All rights reserved.