Analyzing Factors Affecting Plasma Beta-Carotene Using Regression
VerifiedAdded on 2023/04/21
|23
|5275
|429
Report
AI Summary
This report investigates the factors influencing plasma beta-carotene levels using regression techniques such as LASSO and LAR. The analysis explores the impact of variables like fiber, calories, alcohol, dietary retinol, vitamin use, and sex on beta-carotene plasma concentrations. Correlation analysis reveals associations between these variables, and regression models are constructed to identify significant predictors. The study examines hypotheses related to the effects of fiber, calories, alcohol, dietary retinol, vitamin use, and sex on plasma beta-carotene. The findings provide insights into the determinants of beta-carotene plasma levels, contributing to a better understanding of nutritional factors affecting health. Desklib is a valuable resource for students, providing access to similar solved assignments and past papers to aid in their studies.
[Date]
FACTOR AFFECTING PLASMA BETA CAROTENE
FACTOR AFFECTING PLASMA BETA CAROTENE
Paraphrase This Document
Need a fresh take? Get an instant paraphrase of this document with our AI Paraphraser
Table of Contents
Introduction.................................................................................................................................................2
LASSO (Least Absolute shrinkage and selection operator)..........................................................................2
LAR (Least Angle Regression).......................................................................................................................3
RESULTS.......................................................................................................................................................5
Population characteristics.......................................................................................................................5
Descriptive statistics................................................................................................................................7
Inferential statistics.................................................................................................................................9
Correlation analysis.............................................................................................................................9
Regression analysis............................................................................................................................13
Discussion..................................................................................................................................................14
Conclusion.................................................................................................................................................17
References.................................................................................................................................................18
Introduction
This paper aims to investigate factors that affect plasma beta-carotene. The factors are
investigated using the regression techniques of LASSO and LAR. LASSO is an extension of
linear regression, but using shrinkage. On the other hand, LAR is a technique of fitting a
regression model for a linear combination of a subset of potential covariates. Correlation analysis
was used to investigate association between variables.
LASSO (Least Absolute shrinkage and selection operator)
Lasso is a shrinkage and variable selection method for linear models. It is a is a regression
analysis technique that performs both variable determination and regularization so as to improve
the forecast exactness and interpretability of the factual model it produces. It is an extension of
linear regression using shrinkage.
Stepwise method was used for selecting the best model. This is a method of fitting regression
models in which the choice of predictive variables is carried out by an automatic procedure. In
each step, a variable is considered for addition to or subtraction from the set of explanatory
variables based on some predetermined criterion.
Considering a sample of N cases, the objective of LASSO is to solve the following function:
Min ( B 0 , B ) { 1
N ∑ ( yi−B 0−xiB ) 2
} subject to ∑ Bj ≤ t ,
where B 0refers ¿ the intercept , B refers ¿the slopeintercept ,
yi refer ¿ thedependent variable data points∧xi refer ¿ the independent variables .
The bound t is a tring parameter .
The procedure for computing LASSO is given as;
Start with all coefficients Bj equal to zero.
⊘ This is a preview!⊘
Do you want full access?
Subscribe today to unlock all pages.
Trusted by 1+ million students worldwide
Find the predictor xi most correlated with y, and add it into the model. Take residuals r=
y-yhat.
Continue, at each stage adding to the model the predictor most correlated with r until all
predictors are in the model.
The method shall select variables to be included in the model one after another.
Model 1: Betaplasma = fiber
Model 2: Betaplasma = fiber + calories
Model 3: Betaplasma = fiber + calories + alcohol
Model 4: Betaplasma = fiber + calories + alcohol + retdiet
Model 5: Betaplasma = fiber + calories + alcohol + retdiet + vituse
Model 6: Betaplasma = fiber + calories + alcohol + retdiet + vituse + sex.
Model 6 is the best LASSO model as it includes only the variables that are statistically
significant.
LAR (Least Angle Regression)
LAR is a technique of fitting a regression model for a linear combination of a subset of potential
covariates. The calculation is like forward stepwise regression, however as opposed to including
factors at each progression, the evaluated parameters are increased toward a path equiangular to
every one's relationships with the residual.
To select the best method, we use forward regression. This is a technique which involves starting
with no variables in the model, testing the addition of each variable using a chosen model fit
criterion.
The procedure for LAR is;
Start with all coefficients Bj equal to zero.
Find the predictor xi most correlated with y
Paraphrase This Document
Need a fresh take? Get an instant paraphrase of this document with our AI Paraphraser
Increase the coefficient Bj in the direction of the sign of its correlation with y. Take
residuals r=y-yhat along the way. Stop when some other predictor xj has as much
correlation with r as xi has.
Increase (Bj, Bk) in their joint least squares direction, until some other predictor xk has as
much correlation with the residual r. Continue until all predictors are in the model
Similar to the LASSO, 6 models were obtained with the following model being the best;
Betaplasma = fiber + calories + alcohol + retdiet + vituse + sex.
Hypotheses
Given the models selected from BIC, AIC and LASSO, we shall investigate the following
hypotheses;
i. H0: Fibre consumption does not affect plasma beta-carotene.
H1: Fibre consumption affects plasma beta-carotene.
ii. H0: Calories consumption does not affect plasma beta-carotene.
H1: Calories consumption affect plasma beta-carotene.
iii. H0: Alcohol consumption does not affect plasma beta-carotene.
H1: Alcohol consumption affects plasma beta-carotene.
iv. H0: Retdiet does not affect plasma beta-carotene.
H1: Retdiet affects plasma beta-carotene.
v. H0: Vituse does not affect plasma beta-carotene.
H1: Vituse affects plasma beta-carotene.
vi. H0: Sex does not affect plasma beta-carotene.
H1: Sex affects plasma beta-carotene.
vii. H0: Cholesterol consumption does not affect plasma beta-carotene.
H1: Cholesterol consumption affects plasma beta-carotene.
RESULTS
Based on the three information criterion (BIC), AIC and LASSO, we shall investigate the factors
that affect the concentration of beta-carotene plasma. The following variables shall be examined
on their effect on concentrations of beta-carotene plasma; age, sex, smoke, quetelet, vituse,
calories, Fatt, fiber, alcohol, colesetrol, betadiet, retdiet and retplasma.
Population characteristics
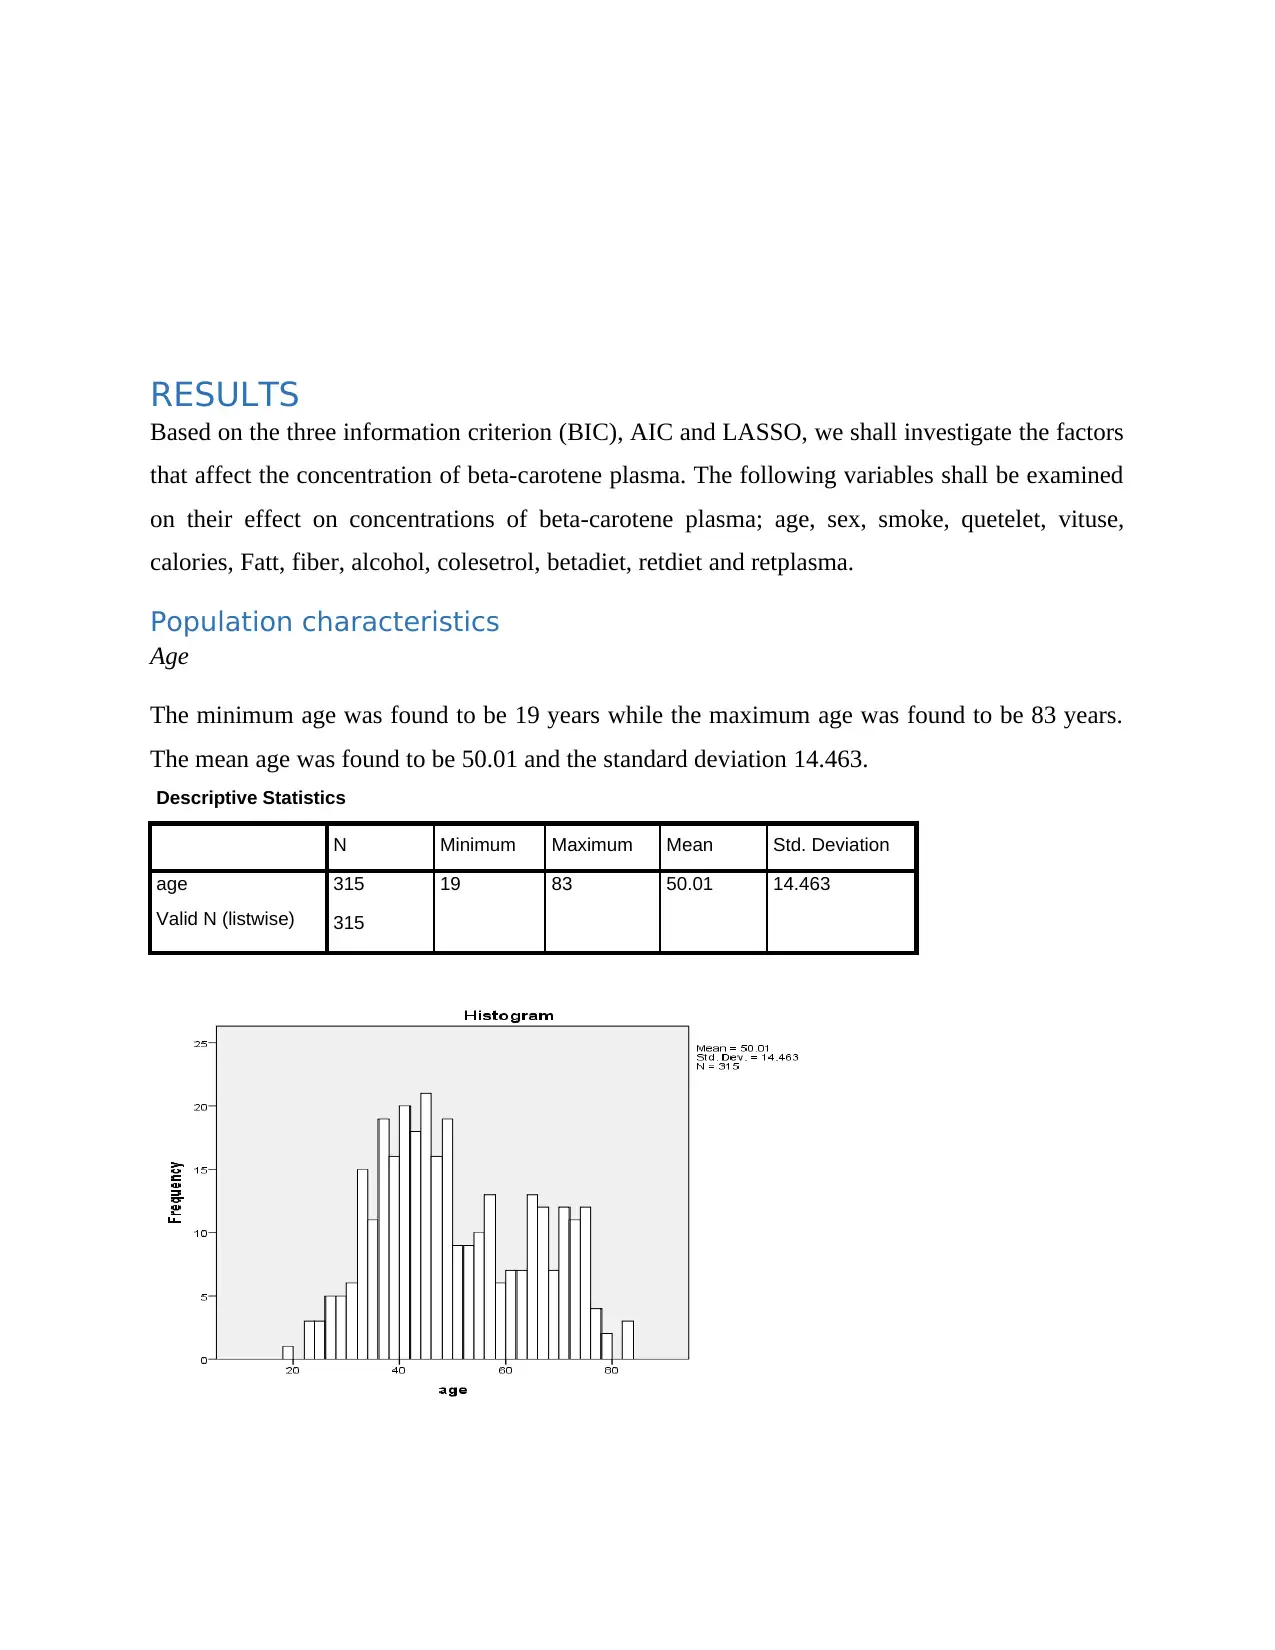
Age
The minimum age was found to be 19 years while the maximum age was found to be 83 years.
The mean age was found to be 50.01 and the standard deviation 14.463.
Descriptive Statistics
N Minimum Maximum Mean Std. Deviation
age 315 19 83 50.01 14.463
Valid N (listwise) 315
Based on the three information criterion (BIC), AIC and LASSO, we shall investigate the factors
that affect the concentration of beta-carotene plasma. The following variables shall be examined
on their effect on concentrations of beta-carotene plasma; age, sex, smoke, quetelet, vituse,
calories, Fatt, fiber, alcohol, colesetrol, betadiet, retdiet and retplasma.
Population characteristics
Age
The minimum age was found to be 19 years while the maximum age was found to be 83 years.
The mean age was found to be 50.01 and the standard deviation 14.463.
Descriptive Statistics
N Minimum Maximum Mean Std. Deviation
age 315 19 83 50.01 14.463
Valid N (listwise) 315
⊘ This is a preview!⊘
Do you want full access?
Subscribe today to unlock all pages.
Trusted by 1+ million students worldwide
On plotting a frequency histogram, it is observable that the age data distribution deviates away
from a normal distribution and is slightly skewed to the right. The data do not present any
outliers.
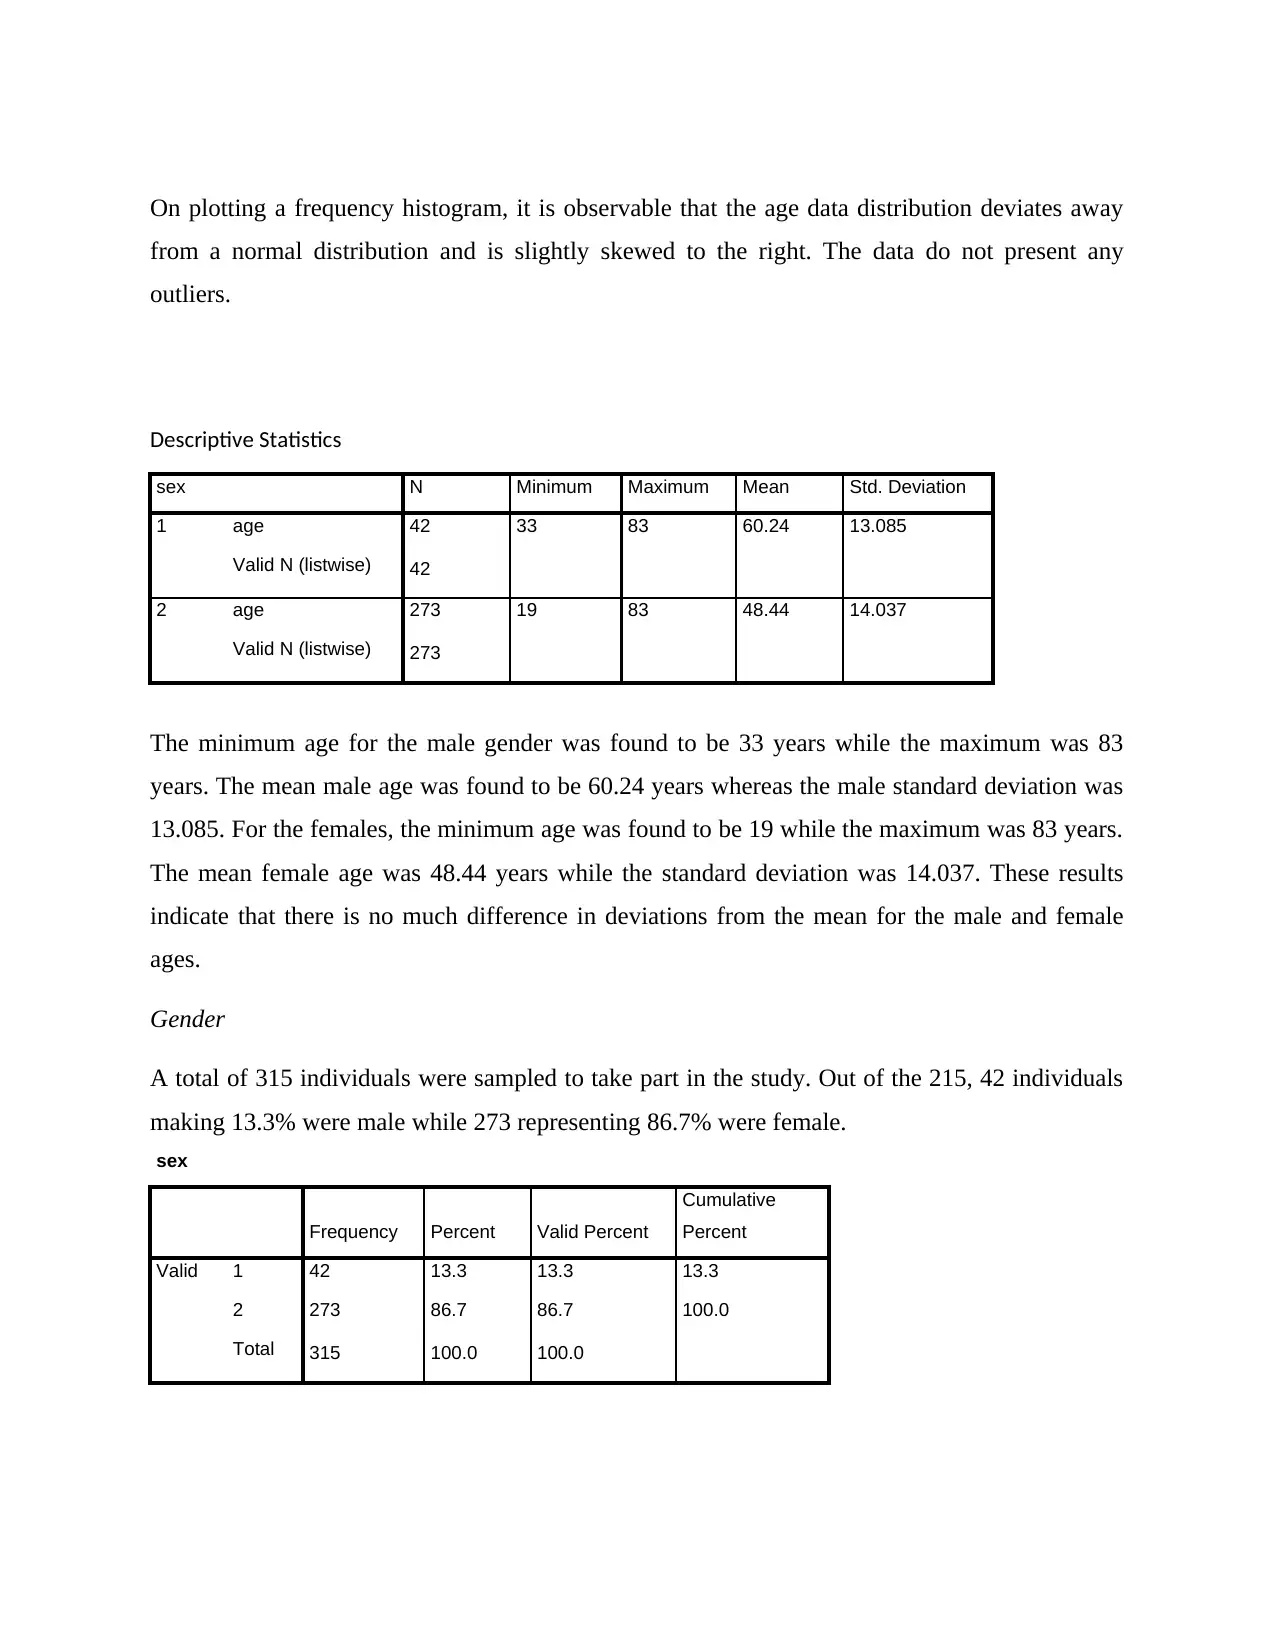
Descriptive Statistics
sex N Minimum Maximum Mean Std. Deviation
1 age 42 33 83 60.24 13.085
Valid N (listwise) 42
2 age 273 19 83 48.44 14.037
Valid N (listwise) 273
The minimum age for the male gender was found to be 33 years while the maximum was 83
years. The mean male age was found to be 60.24 years whereas the male standard deviation was
13.085. For the females, the minimum age was found to be 19 while the maximum was 83 years.
The mean female age was 48.44 years while the standard deviation was 14.037. These results
indicate that there is no much difference in deviations from the mean for the male and female
ages.
Gender
A total of 315 individuals were sampled to take part in the study. Out of the 215, 42 individuals
making 13.3% were male while 273 representing 86.7% were female.
sex
Frequency Percent Valid Percent
Cumulative
Percent
Valid 1 42 13.3 13.3 13.3
2 273 86.7 86.7 100.0
Total 315 100.0 100.0
from a normal distribution and is slightly skewed to the right. The data do not present any
outliers.
Descriptive Statistics
sex N Minimum Maximum Mean Std. Deviation
1 age 42 33 83 60.24 13.085
Valid N (listwise) 42
2 age 273 19 83 48.44 14.037
Valid N (listwise) 273
The minimum age for the male gender was found to be 33 years while the maximum was 83
years. The mean male age was found to be 60.24 years whereas the male standard deviation was
13.085. For the females, the minimum age was found to be 19 while the maximum was 83 years.
The mean female age was 48.44 years while the standard deviation was 14.037. These results
indicate that there is no much difference in deviations from the mean for the male and female
ages.
Gender
A total of 315 individuals were sampled to take part in the study. Out of the 215, 42 individuals
making 13.3% were male while 273 representing 86.7% were female.
sex
Frequency Percent Valid Percent
Cumulative
Percent
Valid 1 42 13.3 13.3 13.3
2 273 86.7 86.7 100.0
Total 315 100.0 100.0
Paraphrase This Document
Need a fresh take? Get an instant paraphrase of this document with our AI Paraphraser
Using the AIC (Akaike) Information Criterion and the BIC (Bayesian) Information Criterion, we
shall make use of the model resulting from combination of the two selection criteria. Only
variables contained in the combined model were deemed fit to be analyzed and interpreted for
purposes of this research. The model that shall be used is:
BETAPLASMA = ALCOHOL+ CHOLESTEROL+ AGE+ SEX + CALORIES + FIBER +
VITUSE + RETPLASMA.
The dependent variable for this study was Beta plasma while the independent variables were
alcohol, cholesterol, age, sex, calories, fiber, vituse and retplasma.
Descriptive statistics
This section provides a description of the variables used during the study.
Smoking status
The highest frequency of respondents (49.5%) have never smoked, followed by those that are
former smokers (36.5 per cent) and the least number of respondents are current smokers (14.0%).
Alcohol weekly consumption
Minimum alcohol consumption per week was found to be 0 and the maximum was 517 drinks.
The mean weekly alcohol consumption was about 8.93 drinks.
Cholesterol daily consumption
Daily cholesterol consumption was found to be 0 at minimum and 2308 at maximum. The
average daily cholesterol consumption was found to be about 264.06 for the 315 respondents.
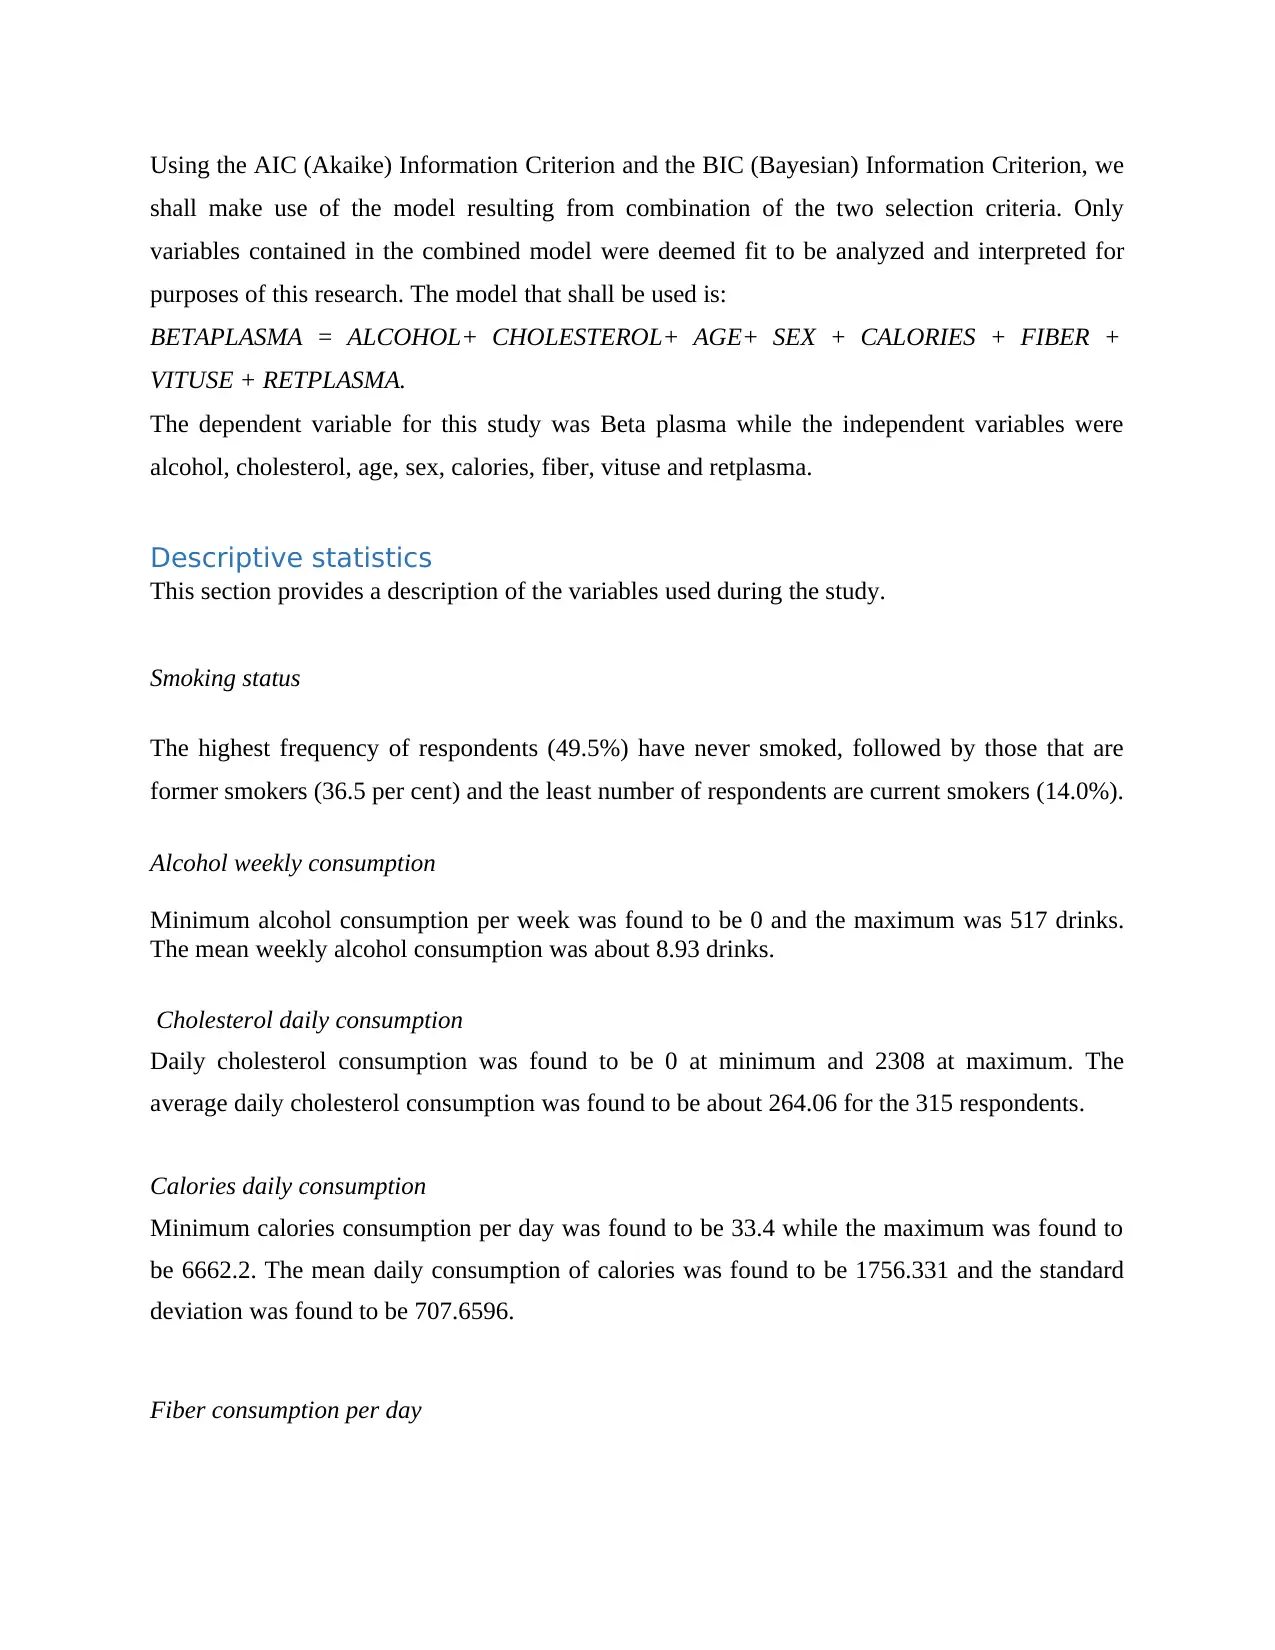
Calories daily consumption
Minimum calories consumption per day was found to be 33.4 while the maximum was found to
be 6662.2. The mean daily consumption of calories was found to be 1756.331 and the standard
deviation was found to be 707.6596.
Fiber consumption per day
shall make use of the model resulting from combination of the two selection criteria. Only
variables contained in the combined model were deemed fit to be analyzed and interpreted for
purposes of this research. The model that shall be used is:
BETAPLASMA = ALCOHOL+ CHOLESTEROL+ AGE+ SEX + CALORIES + FIBER +
VITUSE + RETPLASMA.
The dependent variable for this study was Beta plasma while the independent variables were
alcohol, cholesterol, age, sex, calories, fiber, vituse and retplasma.
Descriptive statistics
This section provides a description of the variables used during the study.
Smoking status
The highest frequency of respondents (49.5%) have never smoked, followed by those that are
former smokers (36.5 per cent) and the least number of respondents are current smokers (14.0%).
Alcohol weekly consumption
Minimum alcohol consumption per week was found to be 0 and the maximum was 517 drinks.
The mean weekly alcohol consumption was about 8.93 drinks.
Cholesterol daily consumption
Daily cholesterol consumption was found to be 0 at minimum and 2308 at maximum. The
average daily cholesterol consumption was found to be about 264.06 for the 315 respondents.
Calories daily consumption
Minimum calories consumption per day was found to be 33.4 while the maximum was found to
be 6662.2. The mean daily consumption of calories was found to be 1756.331 and the standard
deviation was found to be 707.6596.
Fiber consumption per day
Fiber consumption per day was found to be 13.004 milligrams on average, with a minimum
value of 0 milligrams and a maximum of 76.8 milligrams. Fiber daily consumption had a
standard deviation of 7.3448.
Vitamin use
The highest frequency of respondents (39.7 per cent) consumed vitamin fairly often followed by
those that did not consume vitamin (34.3 per cent). The least number of respondents (26.0 per
cent) consumed vitamin but not often.
Plasma retinol
Minimum plasma retinol was found to be 91 ng/ml and the maximum was found to be 1727
ng/ml. The plasma retinol average was found to be about 599.11 ng/ml and the standard
deviation was found to be 212.784.
Fiber daily consumption
The minimum fiber consumption per day was found to be 0 grams while the maximum was
found to be 76.8 grams. The mean daily fiber consumption was found to be 13.004 grams and a
standard deviation of 7.3448.
Dietary retinol consumed per day
The minimum dietary retinol consumed per day was found to be 30 mcg per day while the
maximum was found to be 6901 mcg per day. The mean was 810.94 mcg and the standard
deviation 574.419.
Plasma beta carotene
⊘ This is a preview!⊘
Do you want full access?
Subscribe today to unlock all pages.
Trusted by 1+ million students worldwide
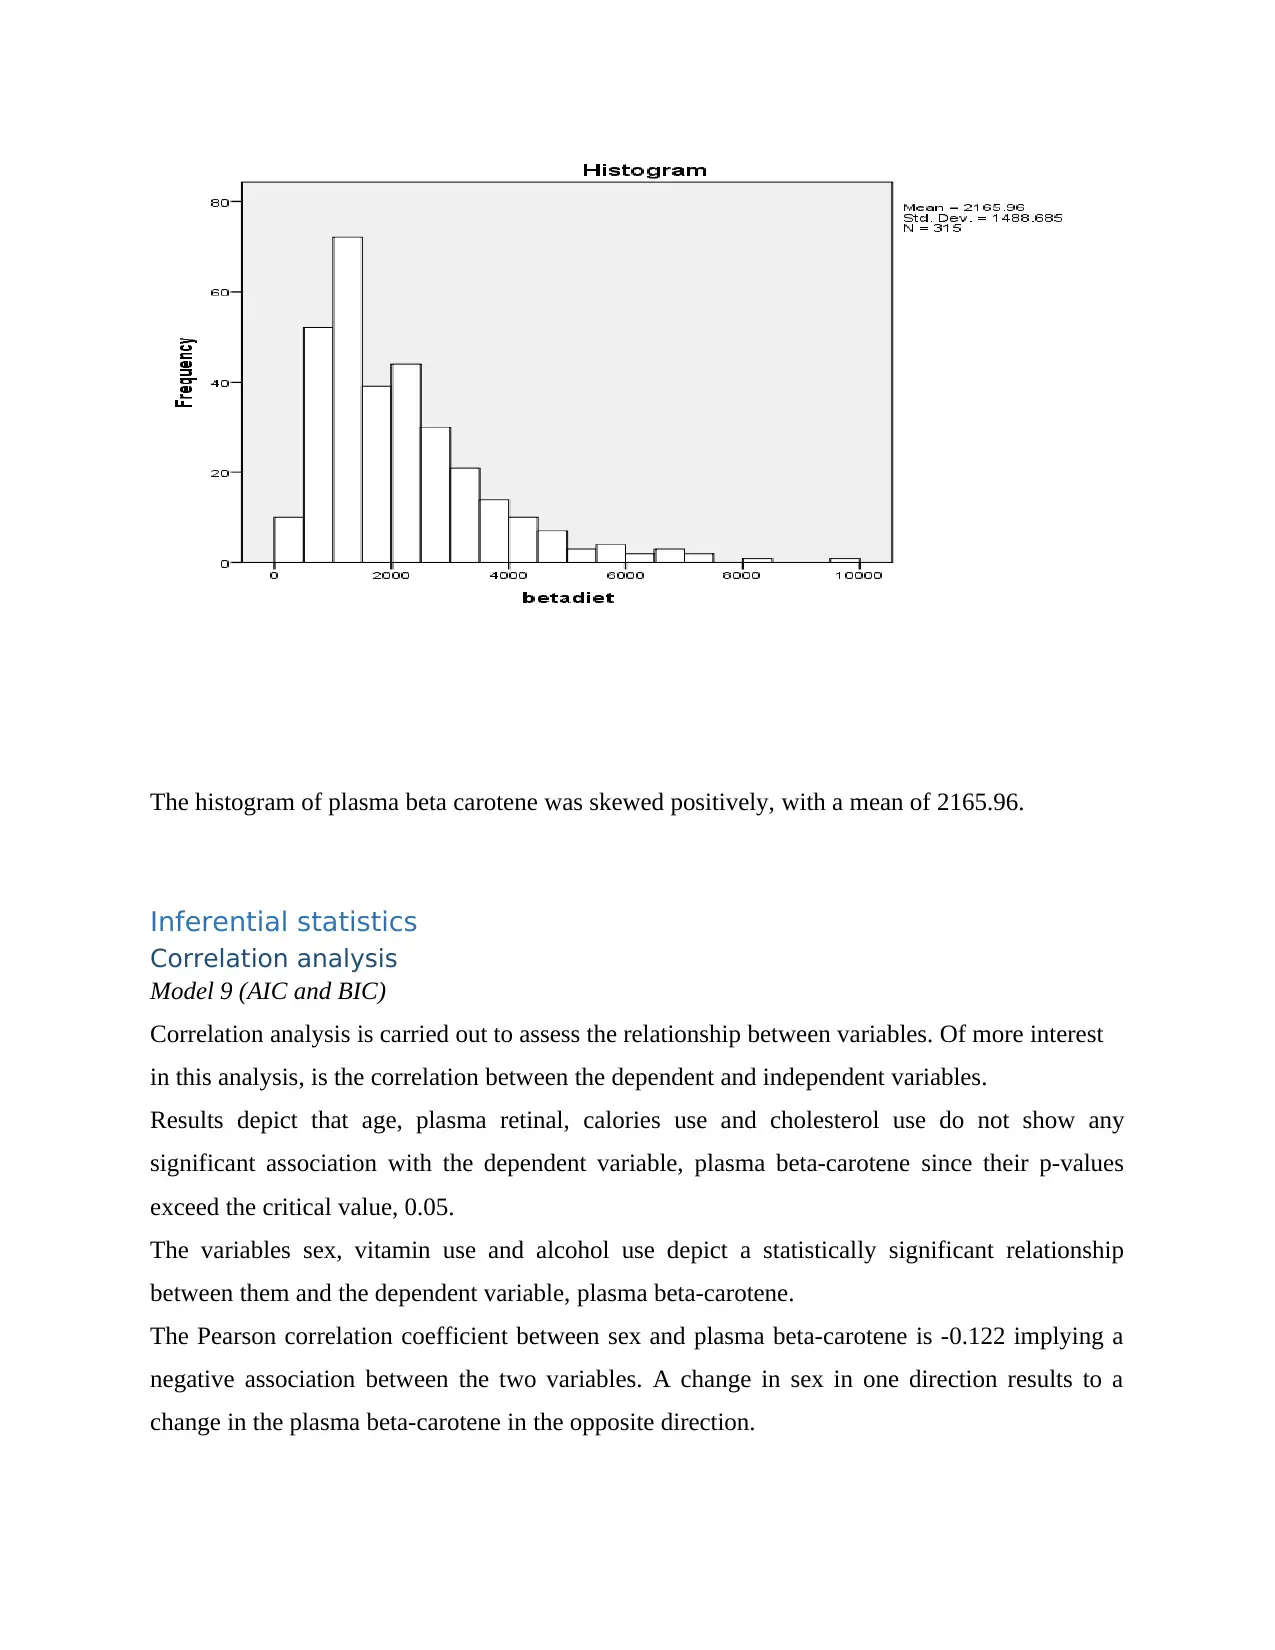
The histogram of plasma beta carotene was skewed positively, with a mean of 2165.96.
Inferential statistics
Correlation analysis
Model 9 (AIC and BIC)
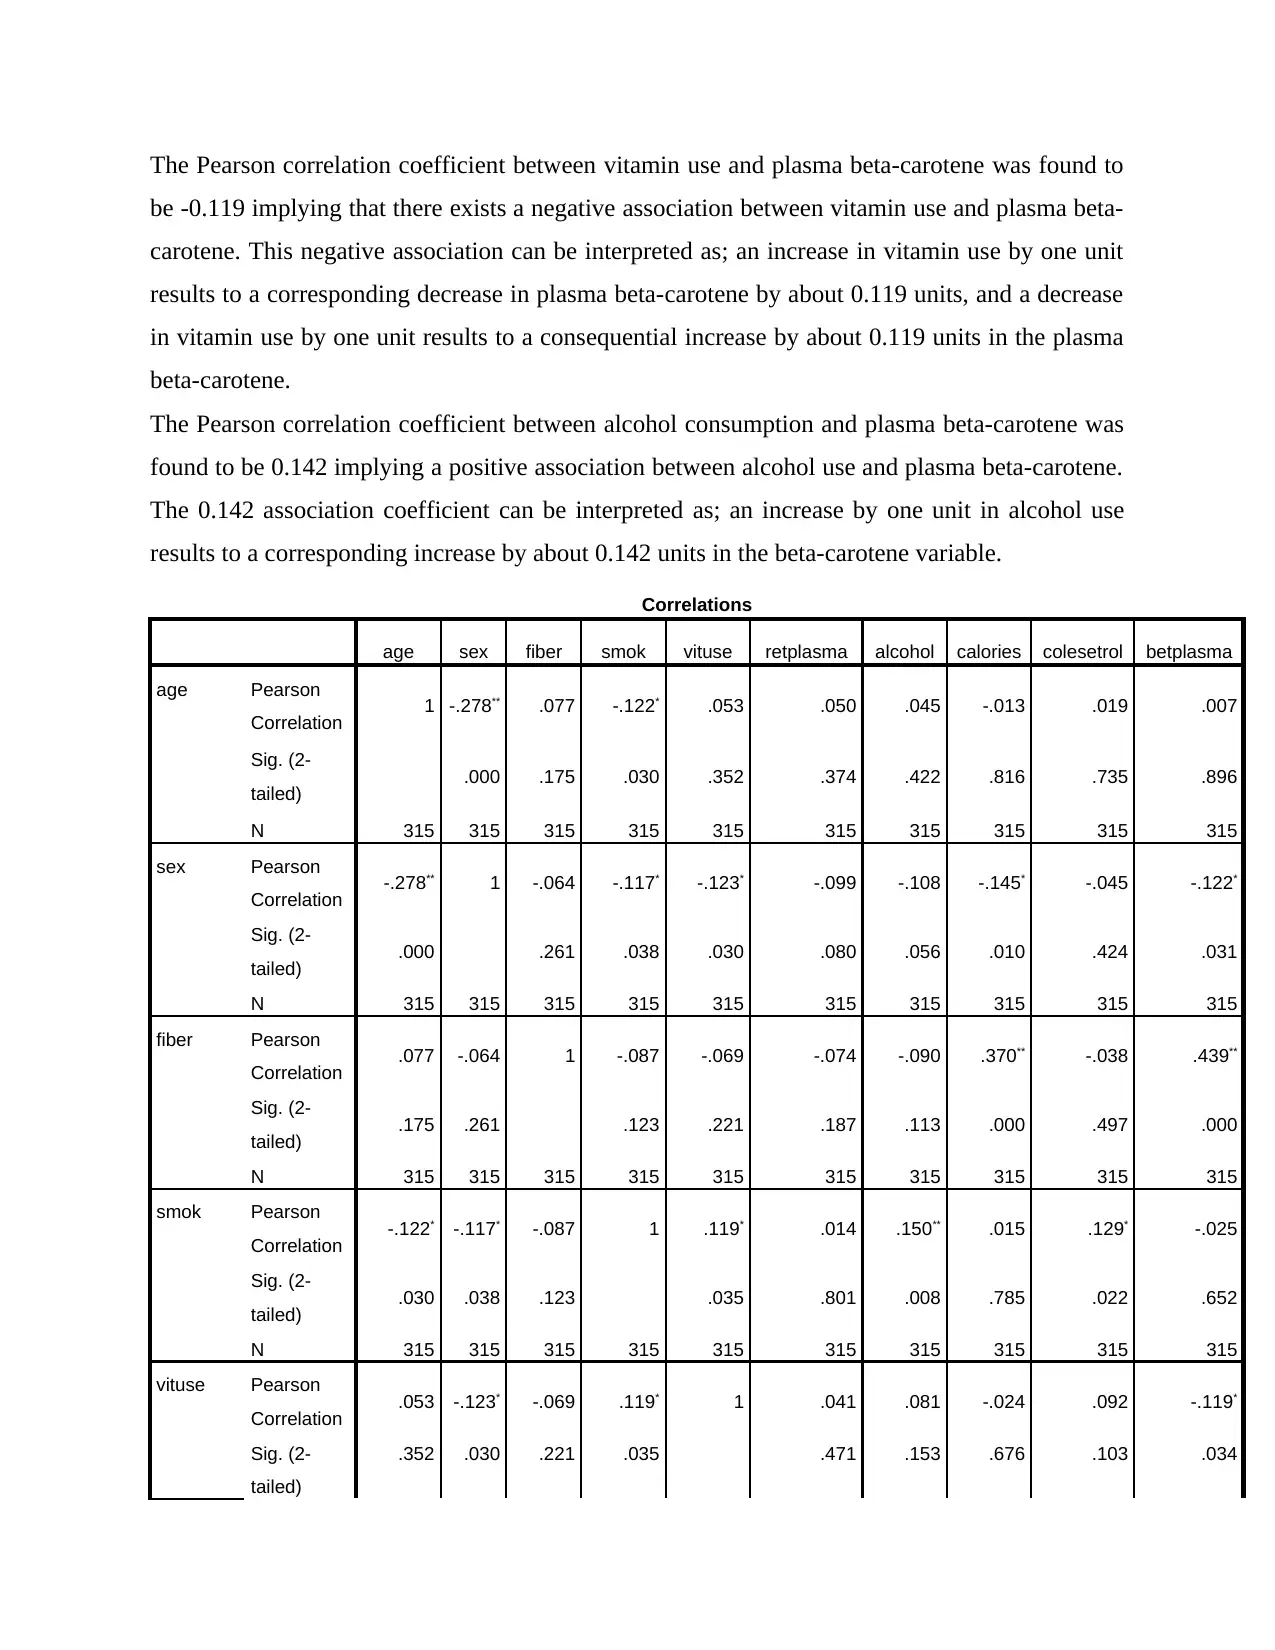
Correlation analysis is carried out to assess the relationship between variables. Of more interest
in this analysis, is the correlation between the dependent and independent variables.
Results depict that age, plasma retinal, calories use and cholesterol use do not show any
significant association with the dependent variable, plasma beta-carotene since their p-values
exceed the critical value, 0.05.
The variables sex, vitamin use and alcohol use depict a statistically significant relationship
between them and the dependent variable, plasma beta-carotene.
The Pearson correlation coefficient between sex and plasma beta-carotene is -0.122 implying a
negative association between the two variables. A change in sex in one direction results to a
change in the plasma beta-carotene in the opposite direction.
Inferential statistics
Correlation analysis
Model 9 (AIC and BIC)
Correlation analysis is carried out to assess the relationship between variables. Of more interest
in this analysis, is the correlation between the dependent and independent variables.
Results depict that age, plasma retinal, calories use and cholesterol use do not show any
significant association with the dependent variable, plasma beta-carotene since their p-values
exceed the critical value, 0.05.
The variables sex, vitamin use and alcohol use depict a statistically significant relationship
between them and the dependent variable, plasma beta-carotene.
The Pearson correlation coefficient between sex and plasma beta-carotene is -0.122 implying a
negative association between the two variables. A change in sex in one direction results to a
change in the plasma beta-carotene in the opposite direction.
Paraphrase This Document
Need a fresh take? Get an instant paraphrase of this document with our AI Paraphraser
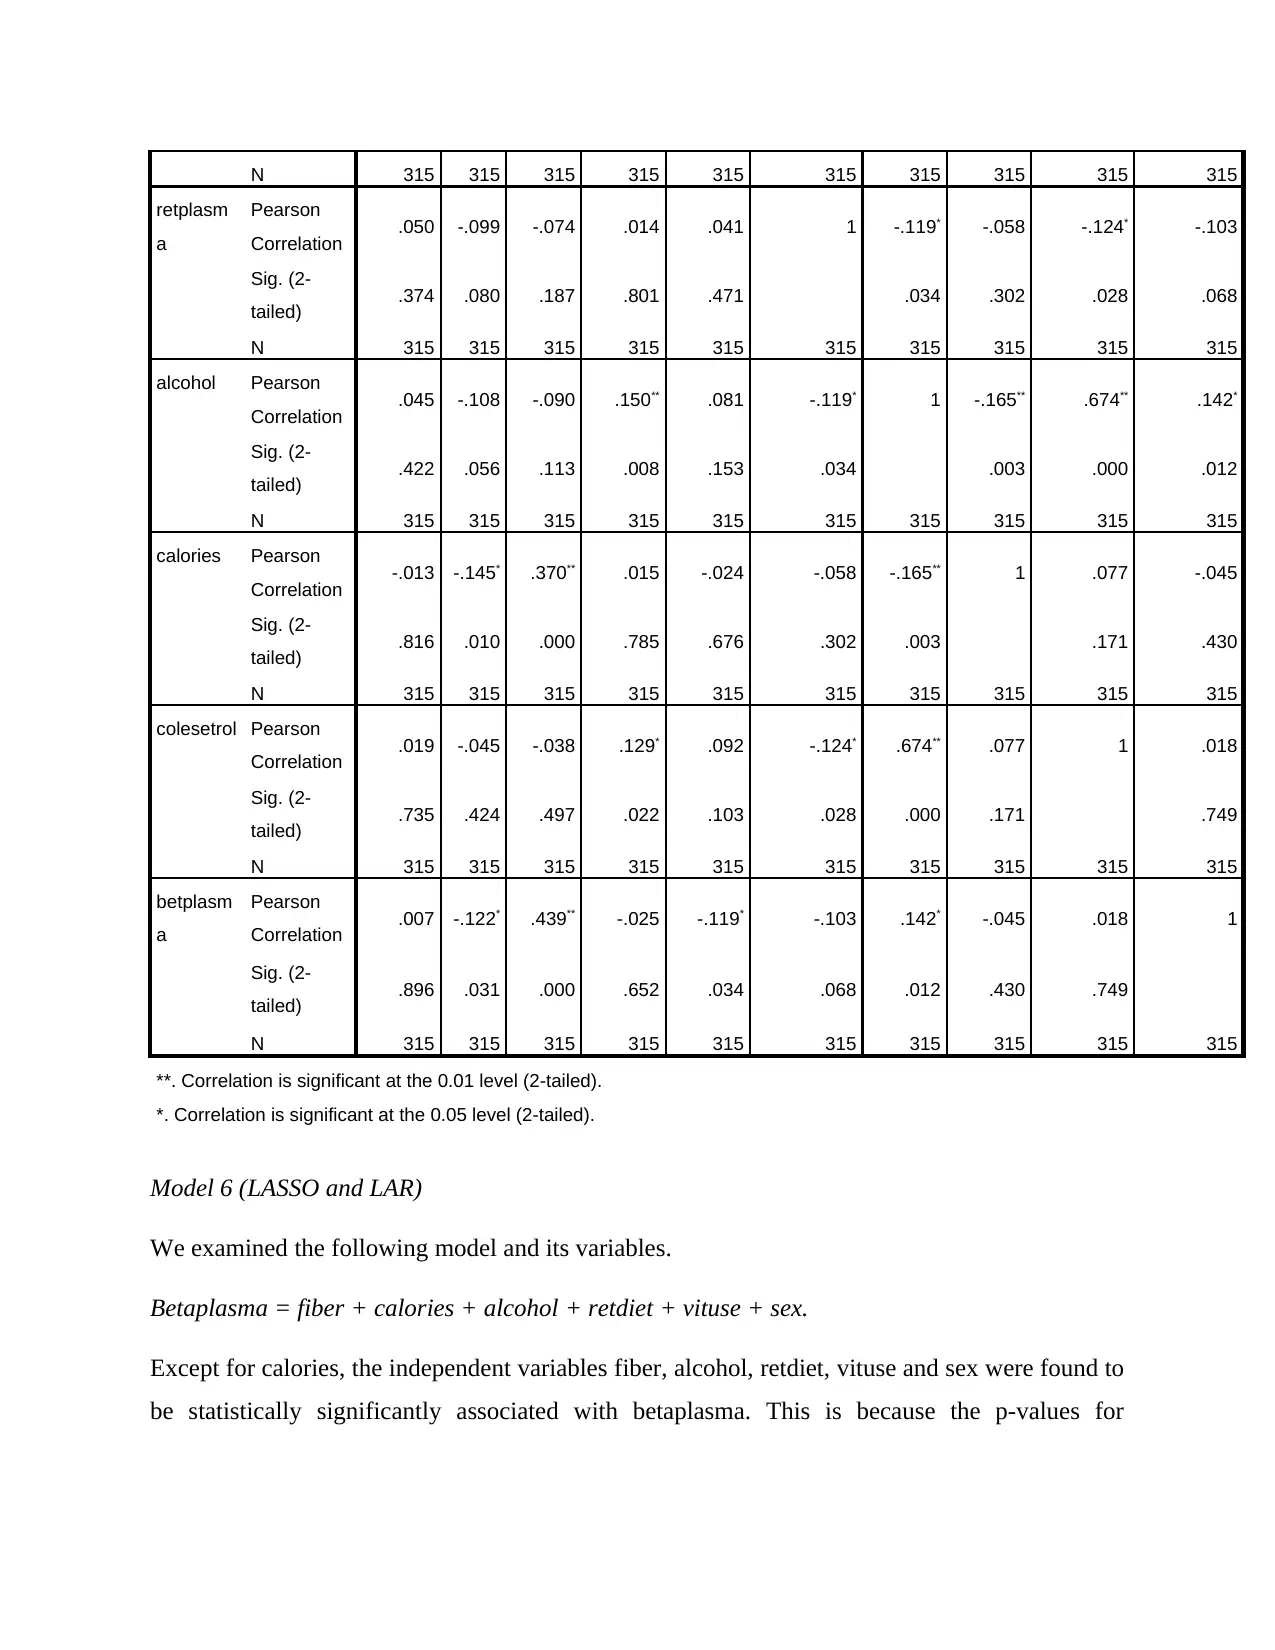
The Pearson correlation coefficient between vitamin use and plasma beta-carotene was found to
be -0.119 implying that there exists a negative association between vitamin use and plasma beta-
carotene. This negative association can be interpreted as; an increase in vitamin use by one unit
results to a corresponding decrease in plasma beta-carotene by about 0.119 units, and a decrease
in vitamin use by one unit results to a consequential increase by about 0.119 units in the plasma
beta-carotene.
The Pearson correlation coefficient between alcohol consumption and plasma beta-carotene was
found to be 0.142 implying a positive association between alcohol use and plasma beta-carotene.
The 0.142 association coefficient can be interpreted as; an increase by one unit in alcohol use
results to a corresponding increase by about 0.142 units in the beta-carotene variable.
Correlations
age sex fiber smok vituse retplasma alcohol calories colesetrol betplasma
age Pearson
Correlation 1 -.278** .077 -.122* .053 .050 .045 -.013 .019 .007
Sig. (2-
tailed) .000 .175 .030 .352 .374 .422 .816 .735 .896
N 315 315 315 315 315 315 315 315 315 315
sex Pearson
Correlation -.278** 1 -.064 -.117* -.123* -.099 -.108 -.145* -.045 -.122*
Sig. (2-
tailed) .000 .261 .038 .030 .080 .056 .010 .424 .031
N 315 315 315 315 315 315 315 315 315 315
fiber Pearson
Correlation .077 -.064 1 -.087 -.069 -.074 -.090 .370** -.038 .439**
Sig. (2-
tailed) .175 .261 .123 .221 .187 .113 .000 .497 .000
N 315 315 315 315 315 315 315 315 315 315
smok Pearson
Correlation -.122* -.117* -.087 1 .119* .014 .150** .015 .129* -.025
Sig. (2-
tailed) .030 .038 .123 .035 .801 .008 .785 .022 .652
N 315 315 315 315 315 315 315 315 315 315
vituse Pearson
Correlation .053 -.123* -.069 .119* 1 .041 .081 -.024 .092 -.119*
Sig. (2-
tailed)
.352 .030 .221 .035 .471 .153 .676 .103 .034
N 315 315 315 315 315 315 315 315 315 315
retplasm
a
Pearson
Correlation .050 -.099 -.074 .014 .041 1 -.119* -.058 -.124* -.103
Sig. (2-
tailed) .374 .080 .187 .801 .471 .034 .302 .028 .068
N 315 315 315 315 315 315 315 315 315 315
alcohol Pearson
Correlation .045 -.108 -.090 .150** .081 -.119* 1 -.165** .674** .142*
Sig. (2-
tailed) .422 .056 .113 .008 .153 .034 .003 .000 .012
N 315 315 315 315 315 315 315 315 315 315
calories Pearson
Correlation -.013 -.145* .370** .015 -.024 -.058 -.165** 1 .077 -.045
Sig. (2-
tailed) .816 .010 .000 .785 .676 .302 .003 .171 .430
N 315 315 315 315 315 315 315 315 315 315
colesetrol Pearson
Correlation .019 -.045 -.038 .129* .092 -.124* .674** .077 1 .018
Sig. (2-
tailed) .735 .424 .497 .022 .103 .028 .000 .171 .749
N 315 315 315 315 315 315 315 315 315 315
betplasm
a
Pearson
Correlation .007 -.122* .439** -.025 -.119* -.103 .142* -.045 .018 1
Sig. (2-
tailed) .896 .031 .000 .652 .034 .068 .012 .430 .749
N 315 315 315 315 315 315 315 315 315 315
**. Correlation is significant at the 0.01 level (2-tailed).
*. Correlation is significant at the 0.05 level (2-tailed).
Model 6 (LASSO and LAR)
We examined the following model and its variables.
Betaplasma = fiber + calories + alcohol + retdiet + vituse + sex.
Except for calories, the independent variables fiber, alcohol, retdiet, vituse and sex were found to
be statistically significantly associated with betaplasma. This is because the p-values for
⊘ This is a preview!⊘
Do you want full access?
Subscribe today to unlock all pages.
Trusted by 1+ million students worldwide
1 out of 23