Analysis of Well-being Data Using Factor Analysis (PSYC077H7)

Verified

Added on  2023/01/16

|26
|4005
|54
Homework Assignment
AI Summary
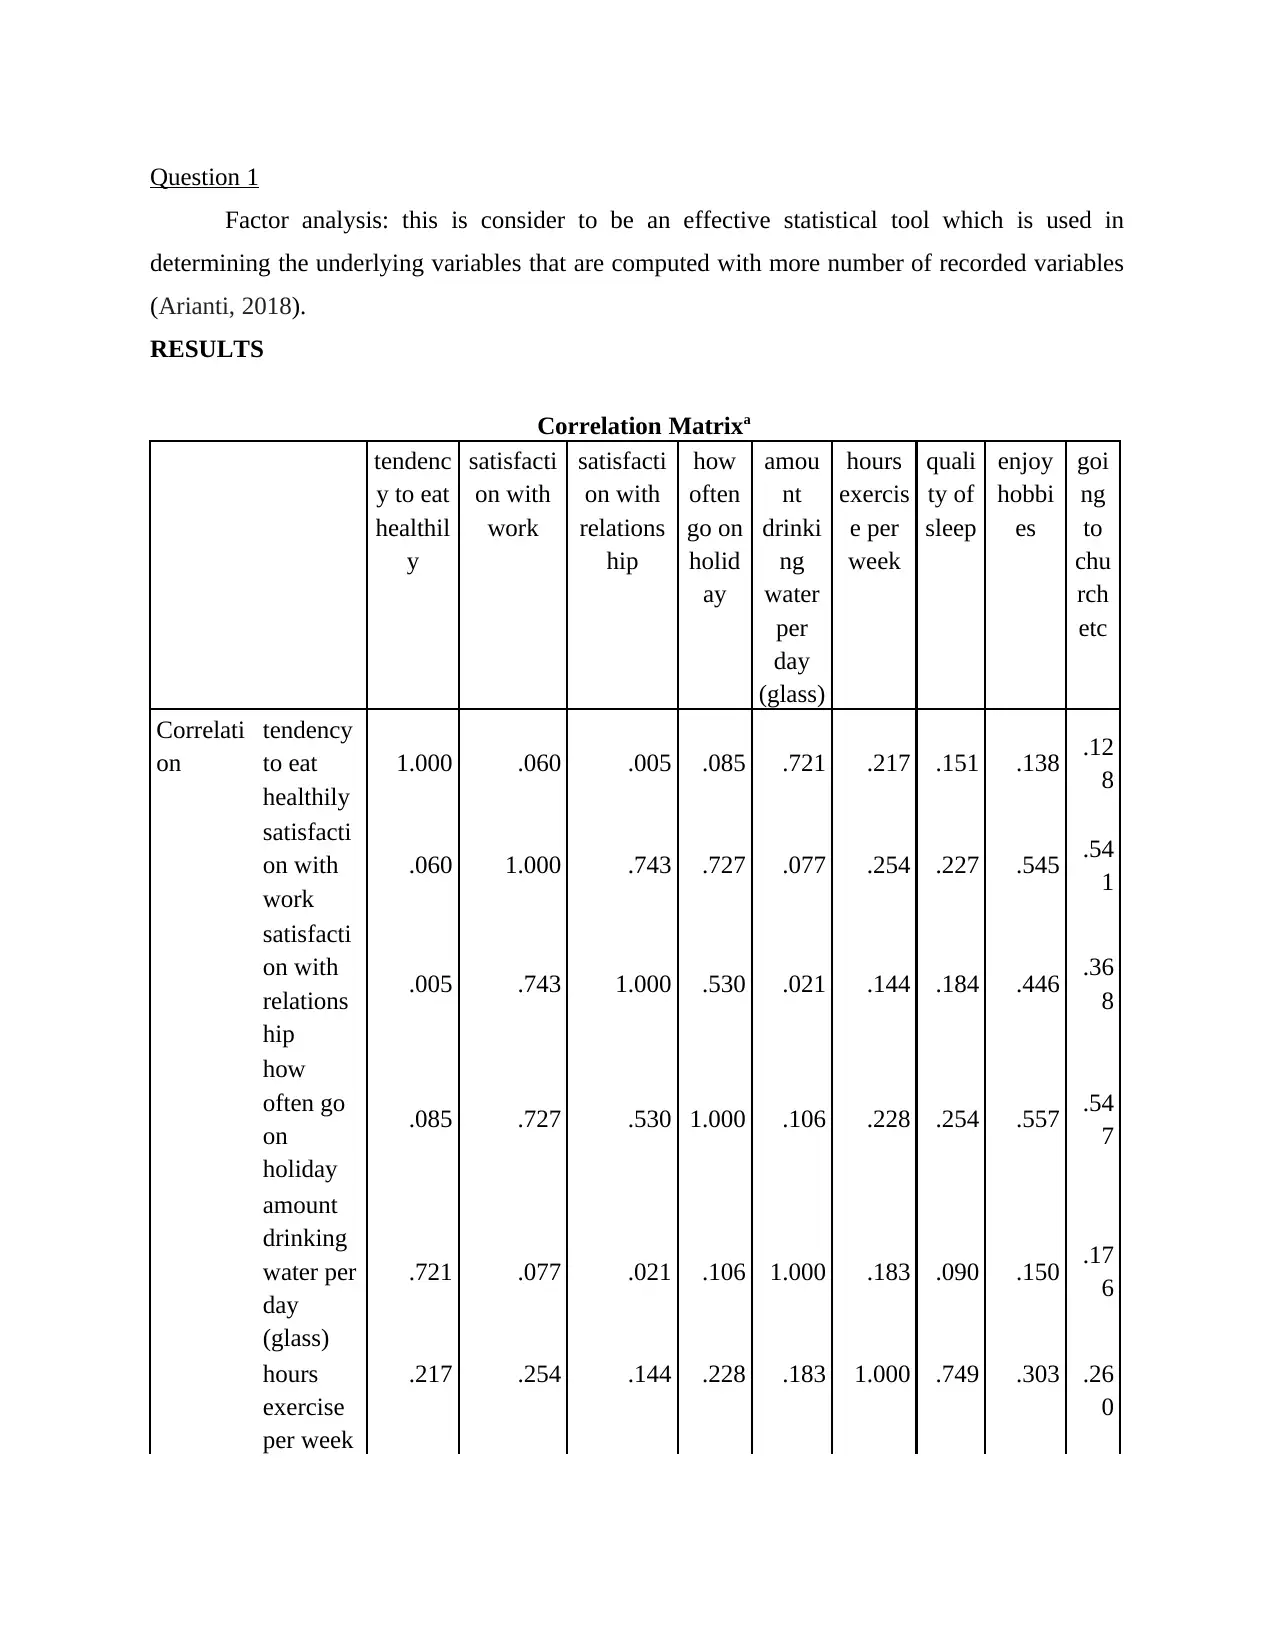
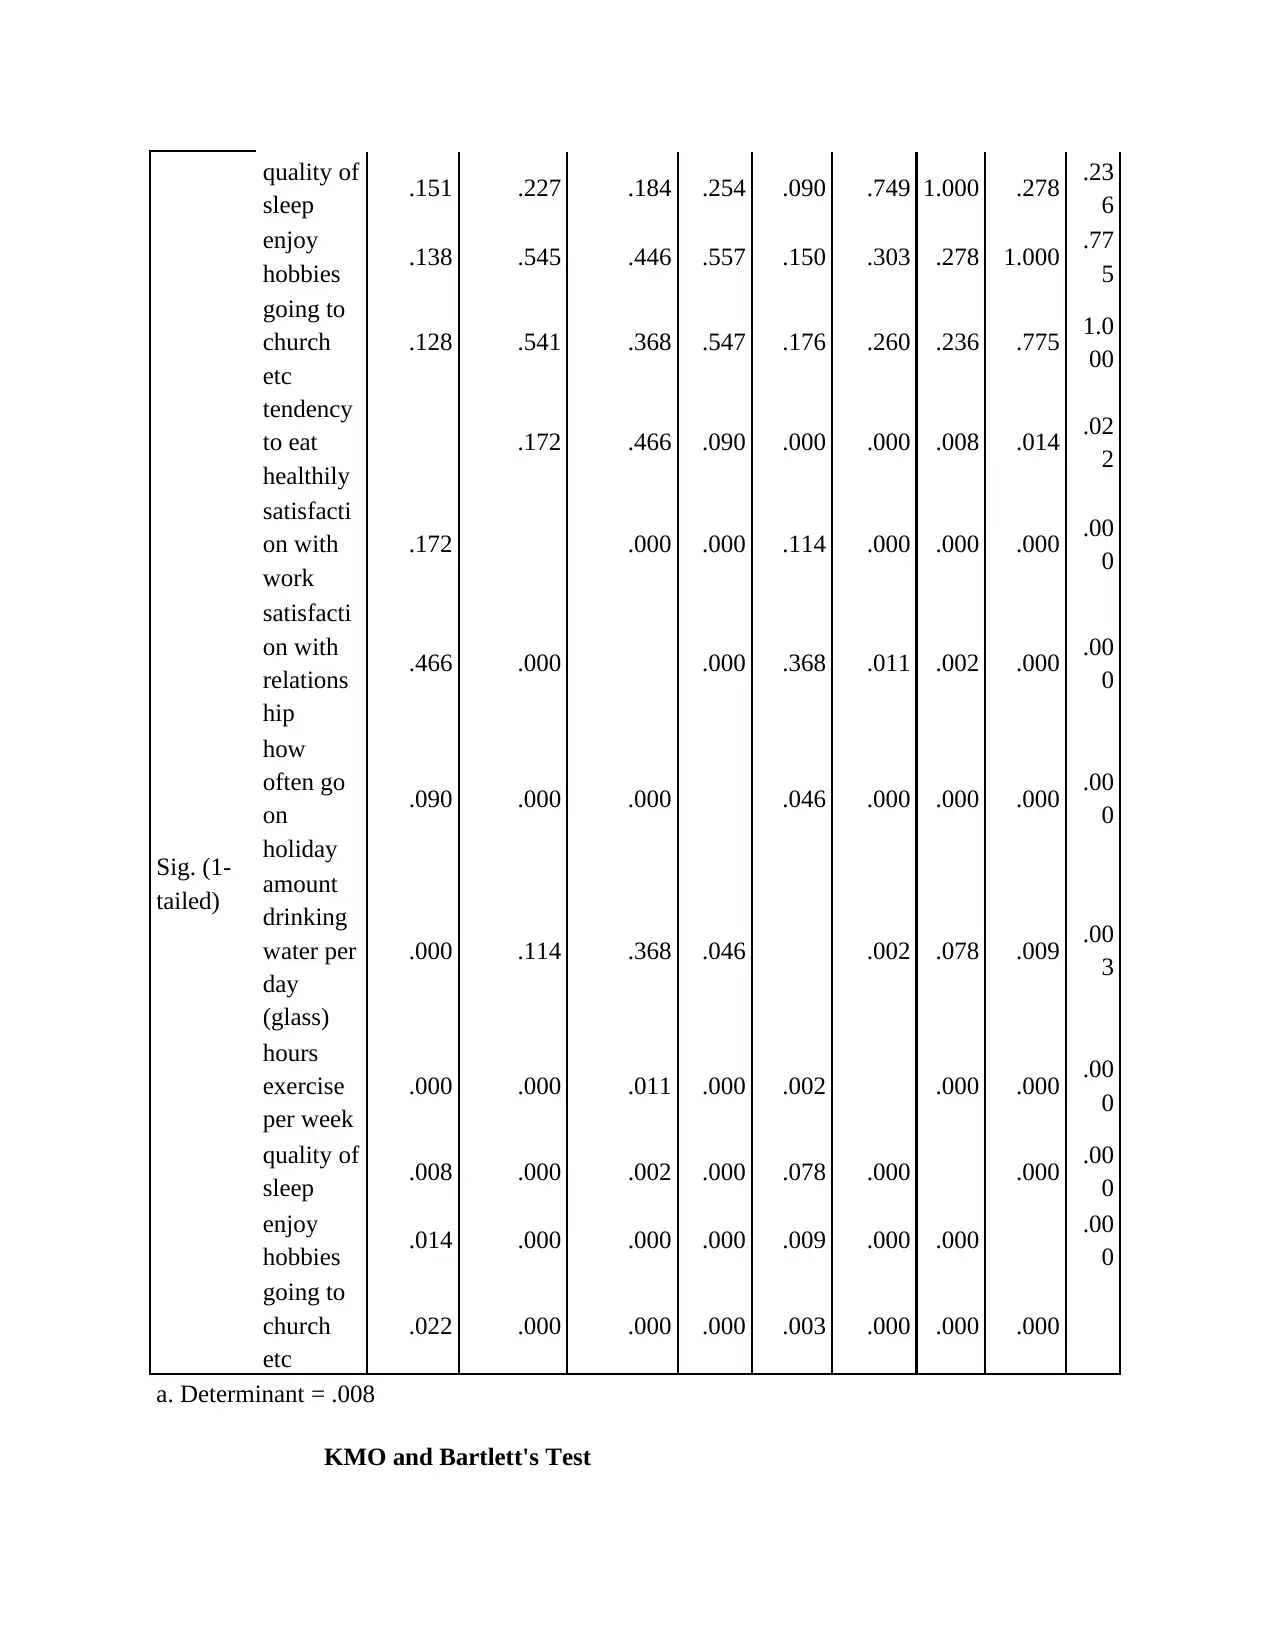
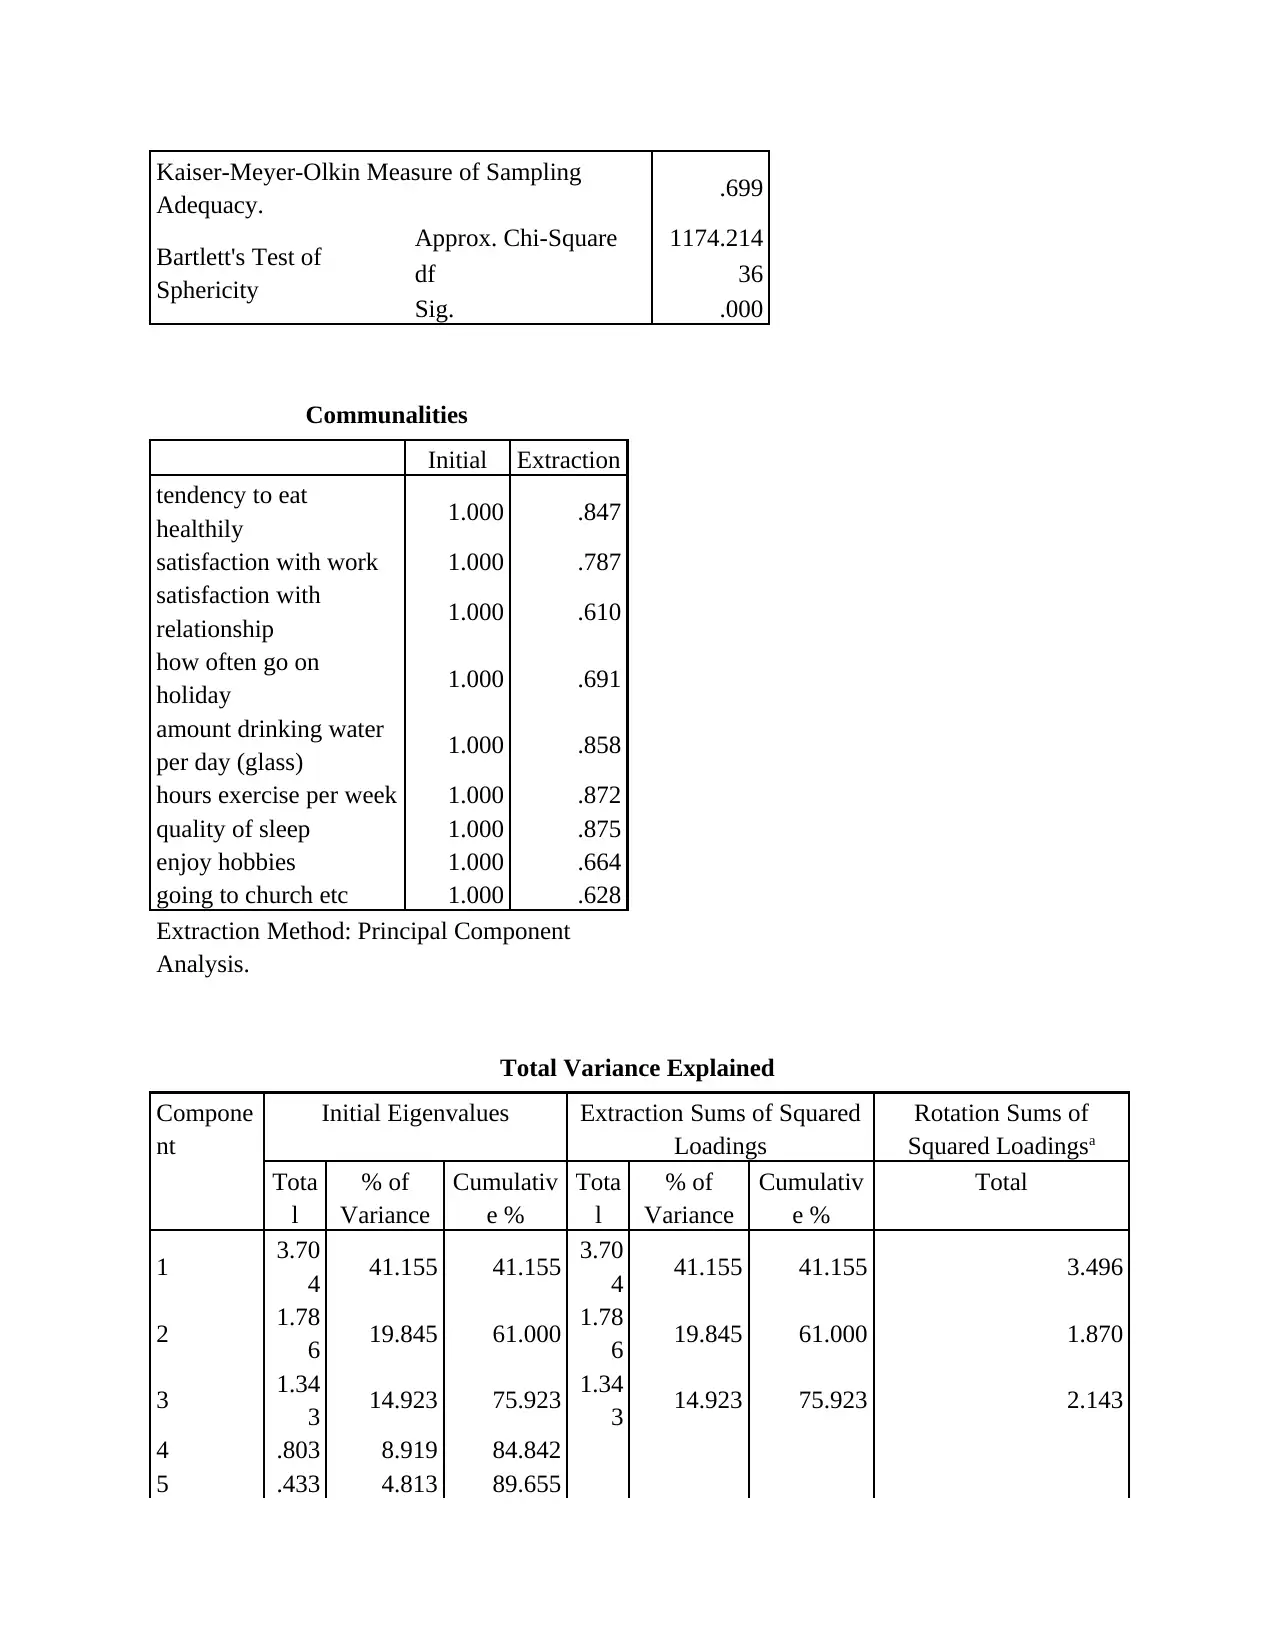
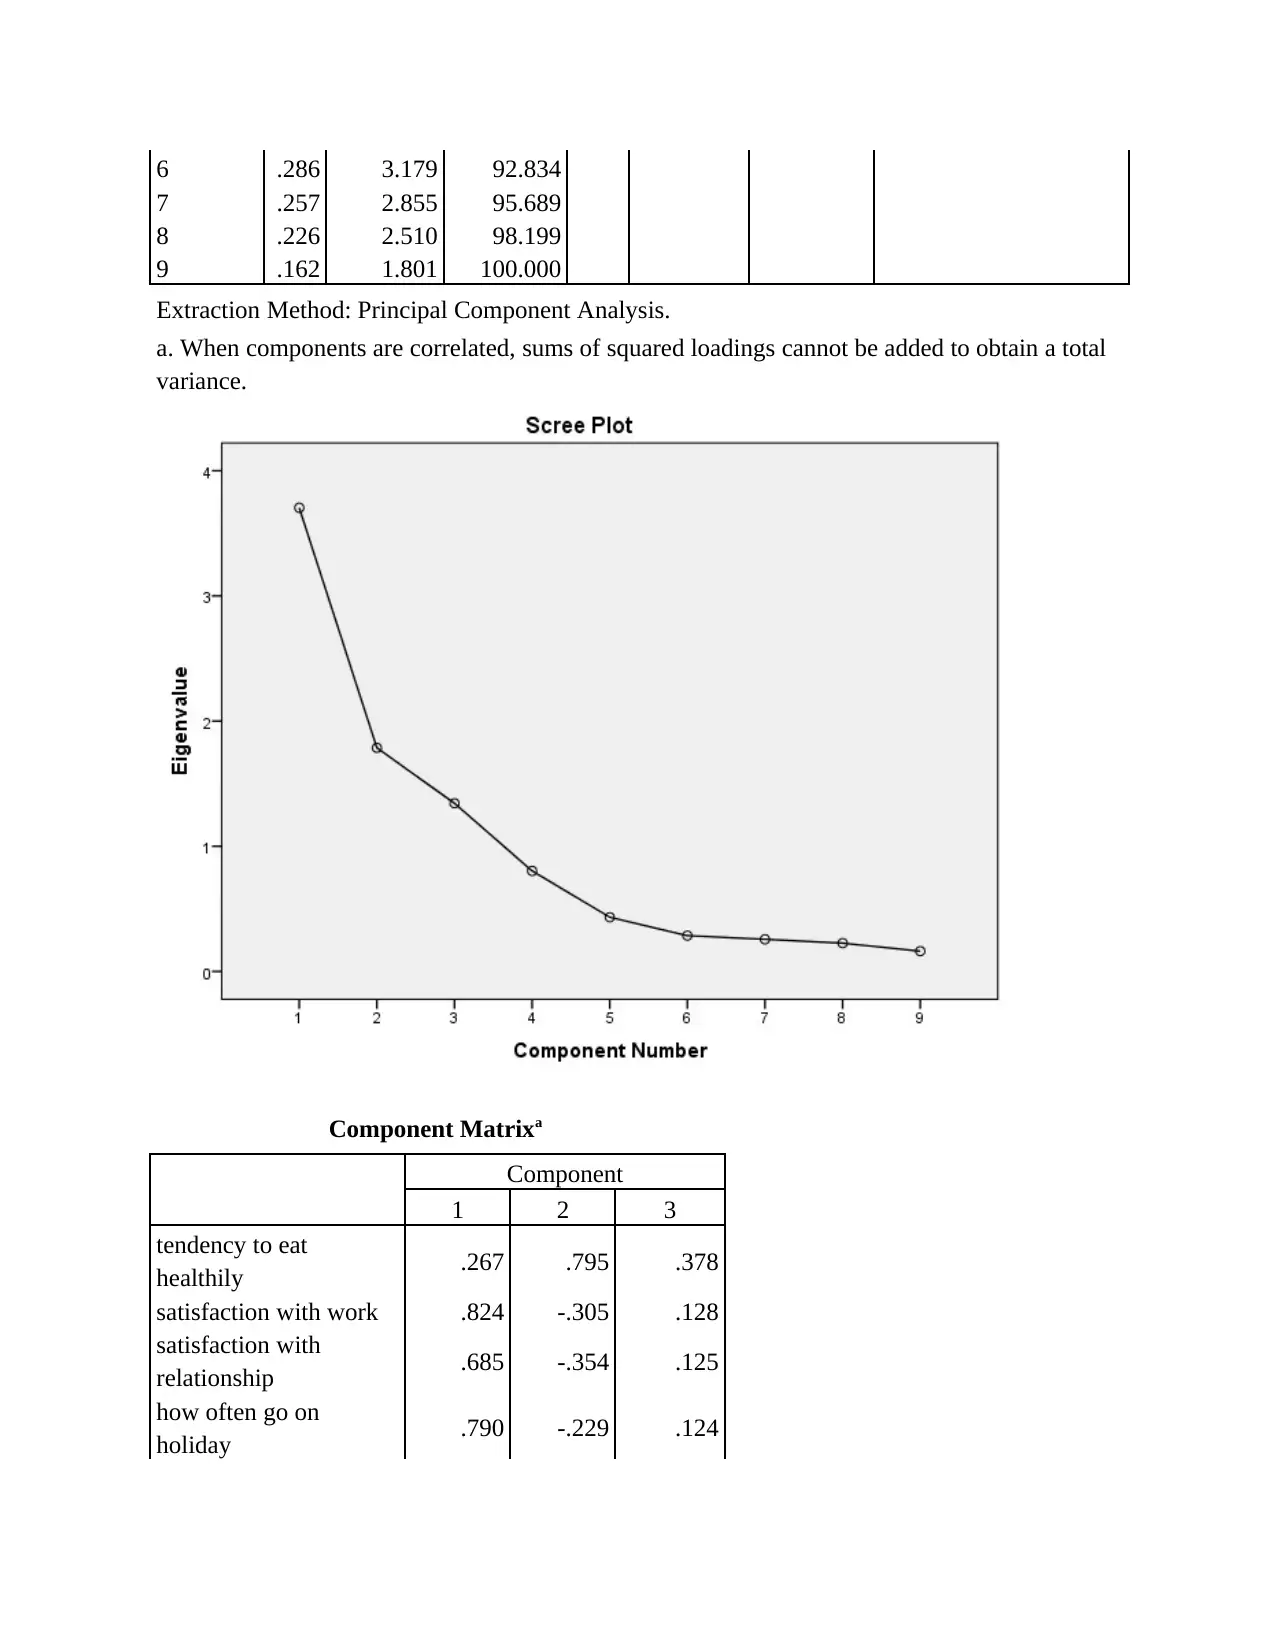
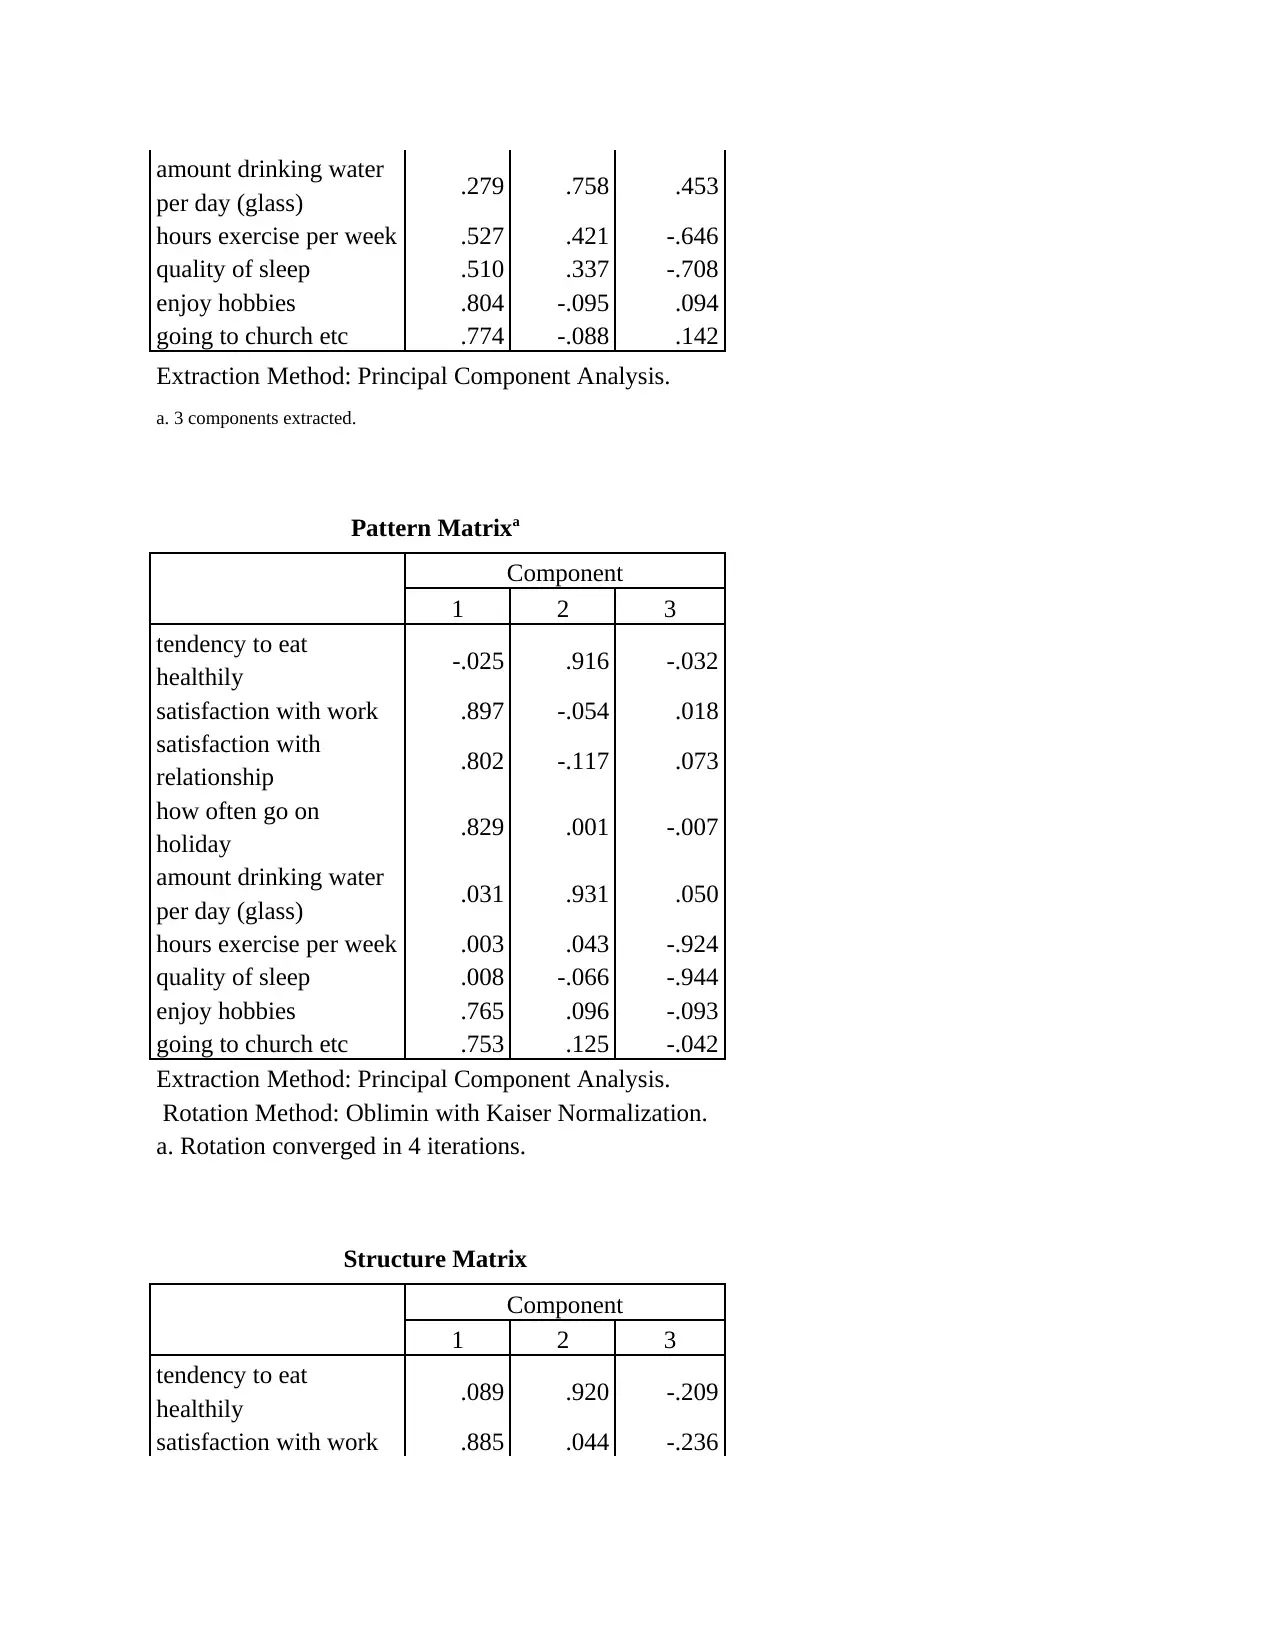
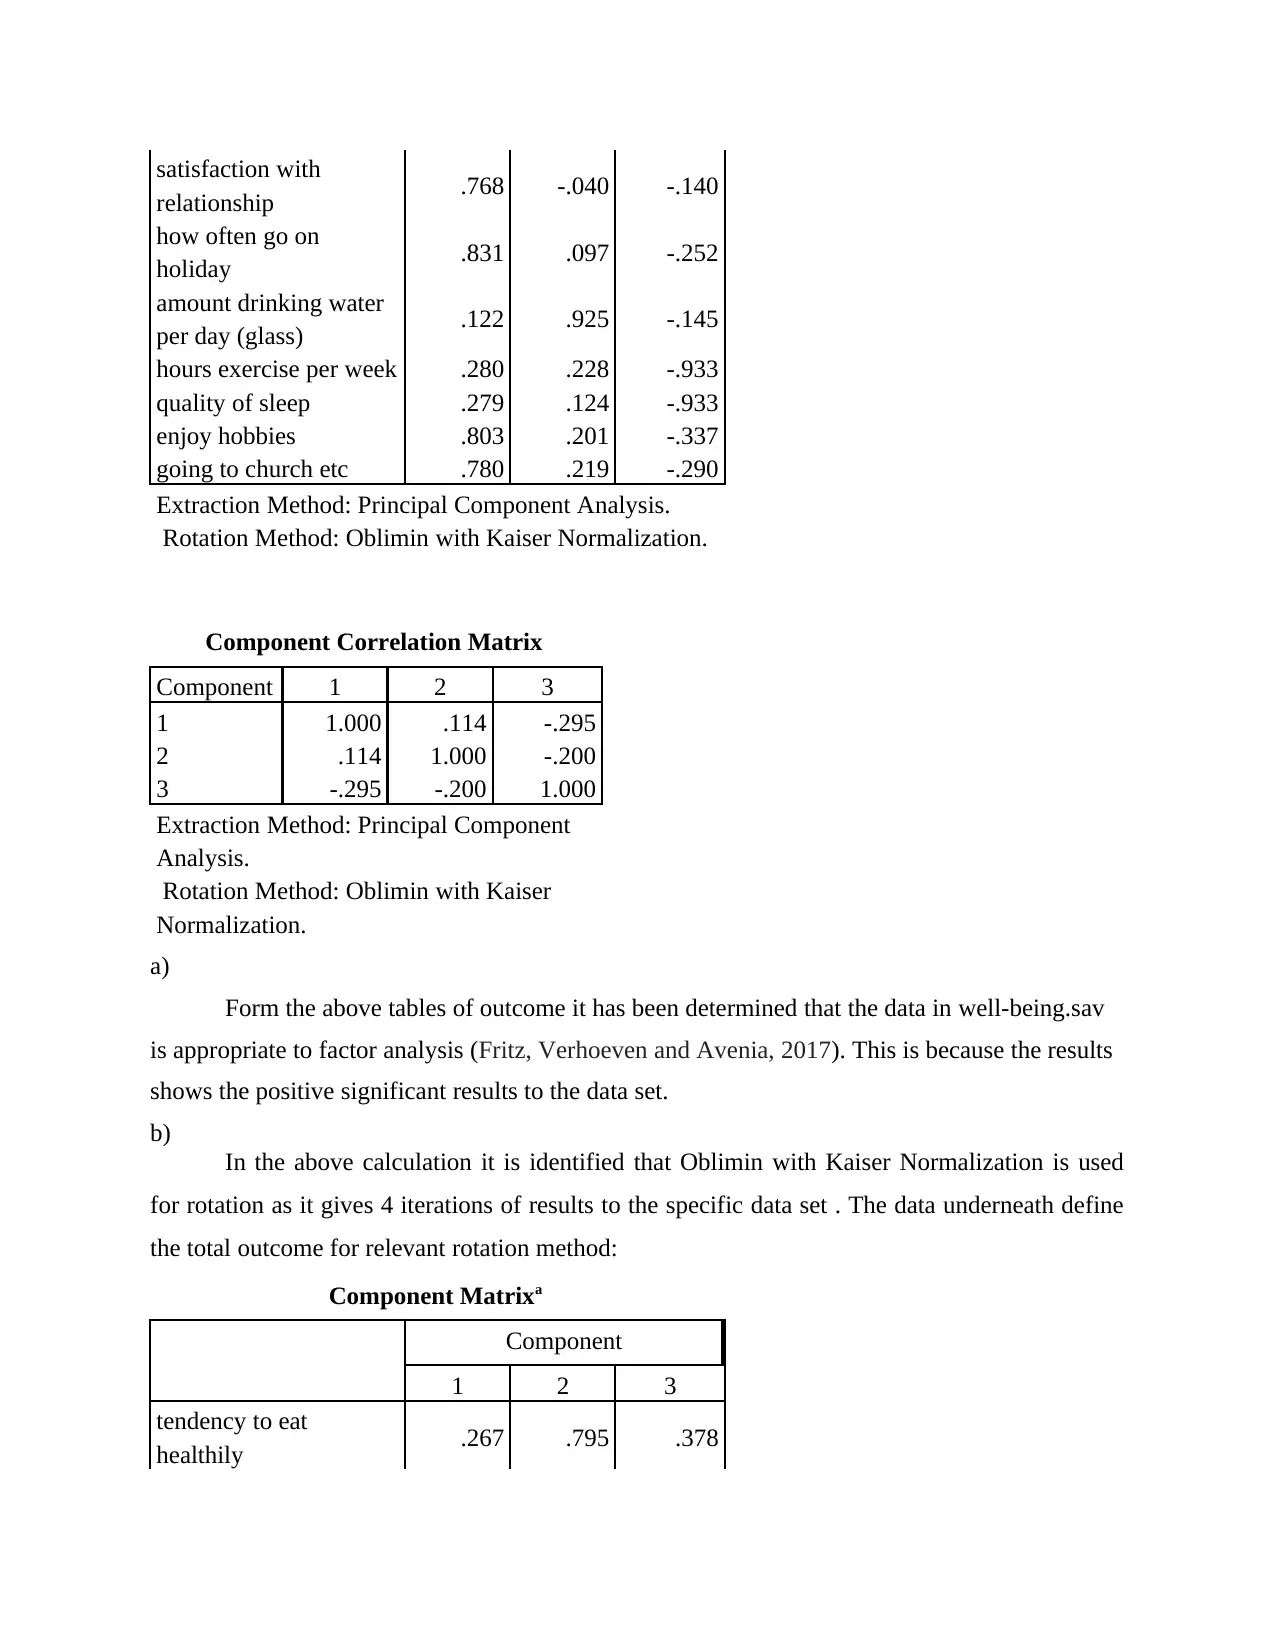
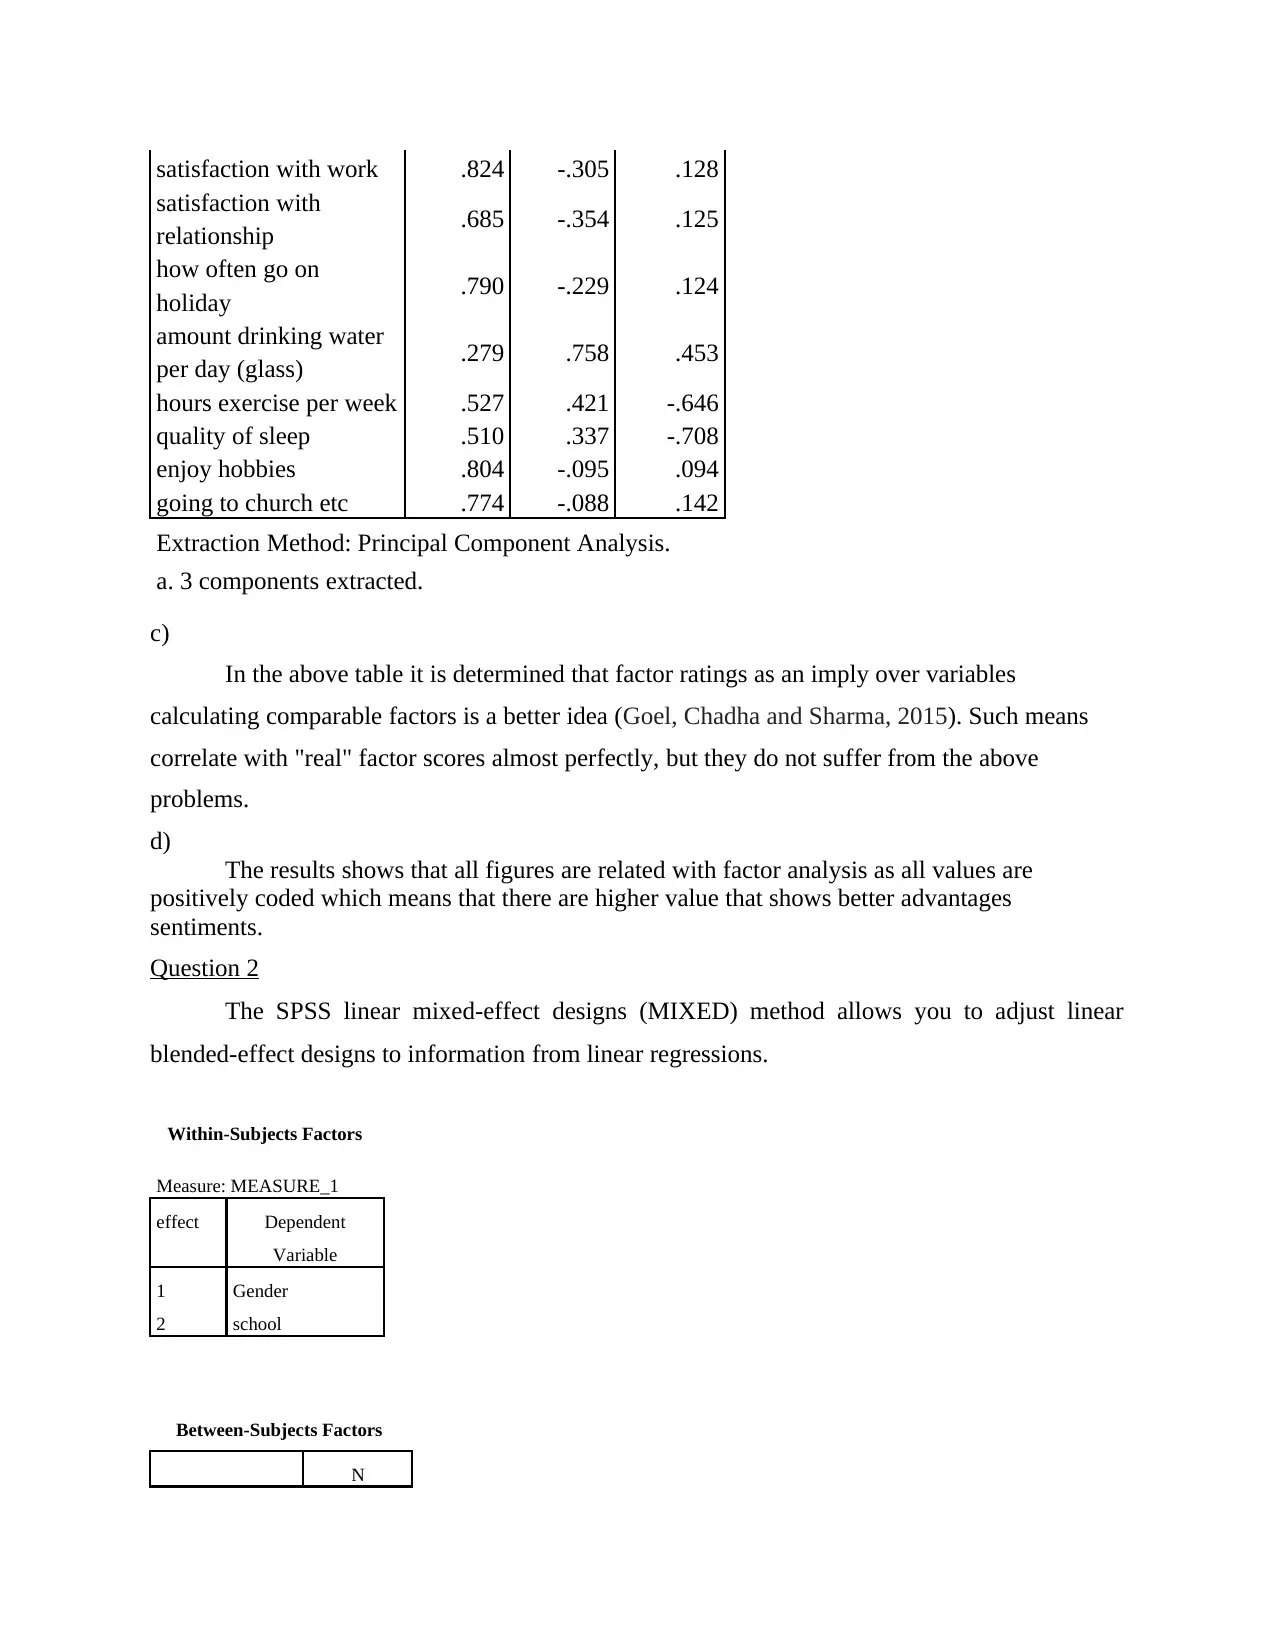
This assignment presents a comprehensive factor analysis of well-being data using SPSS, addressing the latent structure of the data collected from a questionnaire. The analysis begins with an assessment of the dataset's appropriateness for factor analysis, supported by statistical measures like the Kaiser-Meyer-Olkin (KMO) measure and Bartlett's test of sphericity. The study then determines the number of factors to retain, explaining the choice of rotation method (Oblimin with Kaiser Normalization) and the rationale behind it. The results detail which questionnaire items load onto each factor, followed by an interpretation of these factors in terms of the underlying structure of well-being, encompassing aspects like eating habits, work satisfaction, and social interactions. The analysis concludes with an assessment of the reliability of each identified factor, providing reliability figures for each subscale to determine internal consistency. The assignment covers the various statistical tests, data interpretation, and the overall conclusions derived from the factor analysis.
Document Page
Advanced Quantitative
Methods
tabler-icon-diamond-filled.svg

Paraphrase This Document

Need a fresh take? Get an instant paraphrase of this document with our AI Paraphraser
Document Page
Table of Contents
Question 1...................................................................................................................................4
Question 2.................................................................................................................................10
Question 3.................................................................................................................................20
Question 4.................................................................................................................................22
Question 5.................................................................................................................................23
REFERENCES .............................................................................................................................26
Document Page
Question 1
Factor analysis: this is consider to be an effective statistical tool which is used in
determining the underlying variables that are computed with more number of recorded variables
(Arianti, 2018).
RESULTS
Correlation Matrixa
tendenc
y to eat
healthil
y
satisfacti
on with
work
satisfacti
on with
relations
hip
how
often
go on
holid
ay
amou
nt
drinki
ng
water
per
day
(glass)
hours
exercis
e per
week
quali
ty of
sleep
enjoy
hobbi
es
goi
ng
to
chu
rch
etc
Correlati
on
tendency
to eat
healthily
1.000 .060 .005 .085 .721 .217 .151 .138 .12
8
satisfacti
on with
work
.060 1.000 .743 .727 .077 .254 .227 .545 .54
1
satisfacti
on with
relations
hip
.005 .743 1.000 .530 .021 .144 .184 .446 .36
8
how
often go
on
holiday
.085 .727 .530 1.000 .106 .228 .254 .557 .54
7
amount
drinking
water per
day
(glass)
.721 .077 .021 .106 1.000 .183 .090 .150 .17
6
hours
exercise
per week
.217 .254 .144 .228 .183 1.000 .749 .303 .26
0
Document Page
quality of
sleep .151 .227 .184 .254 .090 .749 1.000 .278 .23
6
enjoy
hobbies .138 .545 .446 .557 .150 .303 .278 1.000 .77
5
going to
church
etc
.128 .541 .368 .547 .176 .260 .236 .775 1.0
00
Sig. (1-
tailed)
tendency
to eat
healthily
.172 .466 .090 .000 .000 .008 .014 .02
2
satisfacti
on with
work
.172 .000 .000 .114 .000 .000 .000 .00
0
satisfacti
on with
relations
hip
.466 .000 .000 .368 .011 .002 .000 .00
0
how
often go
on
holiday
.090 .000 .000 .046 .000 .000 .000 .00
0
amount
drinking
water per
day
(glass)
.000 .114 .368 .046 .002 .078 .009 .00
3
hours
exercise
per week
.000 .000 .011 .000 .002 .000 .000 .00
0
quality of
sleep .008 .000 .002 .000 .078 .000 .000 .00
0
enjoy
hobbies .014 .000 .000 .000 .009 .000 .000 .00
0
going to
church
etc
.022 .000 .000 .000 .003 .000 .000 .000
a. Determinant = .008
KMO and Bartlett's Test
tabler-icon-diamond-filled.svg

Paraphrase This Document

Need a fresh take? Get an instant paraphrase of this document with our AI Paraphraser
Document Page
Kaiser-Meyer-Olkin Measure of Sampling
Adequacy. .699
Bartlett's Test of
Sphericity
Approx. Chi-Square 1174.214
df 36
Sig. .000
Communalities
Initial Extraction
tendency to eat
healthily 1.000 .847
satisfaction with work 1.000 .787
satisfaction with
relationship 1.000 .610
how often go on
holiday 1.000 .691
amount drinking water
per day (glass) 1.000 .858
hours exercise per week 1.000 .872
quality of sleep 1.000 .875
enjoy hobbies 1.000 .664
going to church etc 1.000 .628
Extraction Method: Principal Component
Analysis.
Total Variance Explained
Compone
nt
Initial Eigenvalues Extraction Sums of Squared
Loadings
Rotation Sums of
Squared Loadingsa
Tota
l
% of
Variance
Cumulativ
e %
Tota
l
% of
Variance
Cumulativ
e %
Total
1 3.70
4 41.155 41.155 3.70
4 41.155 41.155 3.496
2 1.78
6 19.845 61.000 1.78
6 19.845 61.000 1.870
3 1.34
3 14.923 75.923 1.34
3 14.923 75.923 2.143
4 .803 8.919 84.842
5 .433 4.813 89.655
Document Page
6 .286 3.179 92.834
7 .257 2.855 95.689
8 .226 2.510 98.199
9 .162 1.801 100.000
Extraction Method: Principal Component Analysis.
a. When components are correlated, sums of squared loadings cannot be added to obtain a total
variance.
Component Matrixa
Component
1 2 3
tendency to eat
healthily .267 .795 .378
satisfaction with work .824 -.305 .128
satisfaction with
relationship .685 -.354 .125
how often go on
holiday .790 -.229 .124
Document Page
amount drinking water
per day (glass) .279 .758 .453
hours exercise per week .527 .421 -.646
quality of sleep .510 .337 -.708
enjoy hobbies .804 -.095 .094
going to church etc .774 -.088 .142
Extraction Method: Principal Component Analysis.
a. 3 components extracted.
Pattern Matrixa
Component
1 2 3
tendency to eat
healthily -.025 .916 -.032
satisfaction with work .897 -.054 .018
satisfaction with
relationship .802 -.117 .073
how often go on
holiday .829 .001 -.007
amount drinking water
per day (glass) .031 .931 .050
hours exercise per week .003 .043 -.924
quality of sleep .008 -.066 -.944
enjoy hobbies .765 .096 -.093
going to church etc .753 .125 -.042
Extraction Method: Principal Component Analysis.
Rotation Method: Oblimin with Kaiser Normalization.
a. Rotation converged in 4 iterations.
Structure Matrix
Component
1 2 3
tendency to eat
healthily .089 .920 -.209
satisfaction with work .885 .044 -.236
tabler-icon-diamond-filled.svg

Paraphrase This Document

Need a fresh take? Get an instant paraphrase of this document with our AI Paraphraser
Document Page
satisfaction with
relationship .768 -.040 -.140
how often go on
holiday .831 .097 -.252
amount drinking water
per day (glass) .122 .925 -.145
hours exercise per week .280 .228 -.933
quality of sleep .279 .124 -.933
enjoy hobbies .803 .201 -.337
going to church etc .780 .219 -.290
Extraction Method: Principal Component Analysis.
Rotation Method: Oblimin with Kaiser Normalization.
Component Correlation Matrix
Component 1 2 3
1 1.000 .114 -.295
2 .114 1.000 -.200
3 -.295 -.200 1.000
Extraction Method: Principal Component
Analysis.
Rotation Method: Oblimin with Kaiser
Normalization.
a)
Form the above tables of outcome it has been determined that the data in well-being.sav
is appropriate to factor analysis (Fritz, Verhoeven and Avenia, 2017). This is because the results
shows the positive significant results to the data set.
b)
In the above calculation it is identified that Oblimin with Kaiser Normalization is used
for rotation as it gives 4 iterations of results to the specific data set . The data underneath define
the total outcome for relevant rotation method:
Component Matrixa
Component
1 2 3
tendency to eat
healthily .267 .795 .378
Document Page
satisfaction with work .824 -.305 .128
satisfaction with
relationship .685 -.354 .125
how often go on
holiday .790 -.229 .124
amount drinking water
per day (glass) .279 .758 .453
hours exercise per week .527 .421 -.646
quality of sleep .510 .337 -.708
enjoy hobbies .804 -.095 .094
going to church etc .774 -.088 .142
Extraction Method: Principal Component Analysis.
a. 3 components extracted.
c)
In the above table it is determined that factor ratings as an imply over variables
calculating comparable factors is a better idea (Goel, Chadha and Sharma, 2015). Such means
correlate with "real" factor scores almost perfectly, but they do not suffer from the above
problems.
d)
The results shows that all figures are related with factor analysis as all values are
positively coded which means that there are higher value that shows better advantages
sentiments.
Question 2
The SPSS linear mixed-effect designs (MIXED) method allows you to adjust linear
blended-effect designs to information from linear regressions.
Within-Subjects Factors
Measure: MEASURE_1
effect Dependent
Variable
1 Gender
2 school
Between-Subjects Factors
N
Document Page
mark 14 1
19 1
23 1
24 2
25 3
26 2
27 2
28 1
29 2
30 6
31 4
32 5
33 3
34 5
35 13
36 8
37 6
38 8
39 6
40 10
41 13
42 14
43 11
44 18
45 7
46 12
47 17
48 14
49 14
50 13
51 16
52 15
53 9
54 15
55 22
56 19
57 21
58 17
tabler-icon-diamond-filled.svg

Paraphrase This Document

Need a fresh take? Get an instant paraphrase of this document with our AI Paraphraser
Document Page
59 25
60 17
61 23
62 17
63 28
64 20
65 14
66 21
67 20
68 8
69 13
70 12
71 17
72 21
73 14
74 23
75 12
76 17
77 8
78 13
79 8
80 13
81 7
82 11
83 5
84 13
85 2
86 4
87 4
88 4
89 3
90 4
91 3
92 6
93 2
94 2
95 2
Document Page
Descriptive Statistics
mark Mean Std. Deviation N
Gender 14 2.00 . 1
19 2.00 . 1
23 2.00 . 1
24 1.00 .000 2
25 1.67 .577 3
26 1.50 .707 2
27 2.00 .000 2
28 1.00 . 1
29 2.00 .000 2
30 1.83 .408 6
31 1.75 .500 4
32 1.40 .548 5
33 1.67 .577 3
34 1.40 .548 5
35 1.85 .376 13
36 1.50 .535 8
37 1.83 .408 6
38 1.75 .463 8
39 1.33 .516 6
40 1.50 .527 10
41 1.54 .519 13
42 1.57 .514 14
43 1.45 .522 11
44 1.39 .502 18
45 1.43 .535 7
46 1.33 .492 12
47 1.24 .437 17
48 1.50 .519 14
49 1.29 .469 14
50 1.31 .480 13
51 1.50 .516 16
52 1.27 .458 15
53 1.11 .333 9
chevron_up_icon
1 out of 26
circle_padding
hide_on_mobile
zoom_out_icon
[object Object]