Factors Influencing Gross Domestic Product in the United States
VerifiedAdded on 2021/06/16
|20
|5515
|50
Report
AI Summary
This report provides an in-depth analysis of the factors affecting the Gross Domestic Product (GDP) in the United States. It examines the relationship between GDP and several key economic indicators including the Consumer Price Index (CPI), real interest rates, and broad money supply. The study utilizes secondary data from the World Bank spanning from 1961 to 2016 to investigate the trends and correlations of these variables. The research employs statistical tools such as regression analysis, descriptive statistics (mean, standard deviation, maximum, and minimum) to identify the dependencies of GDP on the independent variables, with the goal of testing hypotheses about the nature and significance of these relationships. The report includes graphical representations of data trends and a comprehensive discussion of the findings, offering insights into the dynamics of the US economy over the specified period. This report is available on Desklib, a platform offering AI-powered study tools for students.
Factors affecting the GDP in the United States 1
Factors affecting the GDP in the United States
Students name:
Students ID:
Institution:
Factors affecting the GDP in the United States
Students name:
Students ID:
Institution:
Secure Best Marks with AI Grader
Need help grading? Try our AI Grader for instant feedback on your assignments.
Factors affecting the GDP in the United States 2
1. Introduction
The GDP is the main indicator of the growth of any economy [1]. Countries around the globe
work to improve their GDP since it is the type of indicator that shows what the overall state of
the economic affairs is. Thus, GDP is the worth of all the finished goods and services in
monetary terms which are produced or manufactured within the country. The gross domestic
product normally provides advancement in all the fields in a particular country. GDP usually
grows faster when business within the country take more labor and in turn give the people more
money to spend thereby leading to an increase in demand. Contrary, if there is no economic
growth within an economy, business will become stagnant and will be forced to downsize.
Therefore, employment will become inactive or shrink and the demand the standards of living of
the people will become affected adversely. The economic activity of a country experiences
growth periods and contractions at various levels and the fluctuation forms the business cycle.
As a result, the gross domestic product is usually higher I developed countries compared to
undeveloped countries where the gross domestic product is usually low.
2. Background
The effects of the global financial crisis began to be felt in the middle of 2007 and 2008 since the
world stock market fell and large financial institutions collapsed and began to be bought out by
the government in wealthier nations [2]. The nations offered rescue packages and bailouts to the
financial system.
The United States is outstandingly the world largest economy nominally. It has a nominal GDP
of $14.2 trillion as of 2009 which was about times three of the 2nd largest economy in the world,
Japan [3]. Consequently, its GDP by the Purchasing Power Parity (PPP) was almost as twice as
China’s [4]. from this, it is evident that the economy of the United States maintains a very high
Factors affecting the GDP in the United States 3
level of output per individual. However, the United States gross domestic product declined in
2009 due to the negative contribution from the fixed investment which was nonresidential,
private investment and exports [5].
The United States gross domestic product has four components [6]. The first component is the
personal consumption expenditure which can be classified as all the goods and services which
are produced for the use by the households. Personal consumption expenditures account for
almost 70 percent of the total gross domestic product [7]. The second component is a business
investment. Business investment entails the goods and services which are purchased by the
private sector [8]. The next component, government spending, entails all the federal, state and
local government. Finally, the gross domestic product component is net exports. The net exports
are the dollar value of total imports differentiated from the total exports [9].
3. Problem statement
The following study aims at comparing gross domestic product determinants in the US. It
involves the analysis of statistical data of the United States GDP and other factors like consumer
price index, real interest rate, and broad money. The research aims to identify the dependence of
the above-mentioned factors on the gross domestic product as the dependent variable and the
other three factors as the independent variables.
4. Hypothesis
H1: There is a positive and significant relationship between Gross Domestic Product and
Consumer Price Index
H2: There is a positive and significant relationship between Gross Domestic product and real
interest rate
Factors affecting the GDP in the United States 4
H3: There is a positive and significant relationship between Gross Domestic Product and Broad
Money
5. Parameters and the sample population
The parameters identified for analysis are gross domestic product, consumer price index, interest
rate, and broad money.
a. Gross Domestic Product (GDP)
The Gross Domestic Product can be termed as the value n monetary terms that are attached to all
finished goods and services that are manufactured within a particular state’s border in a specific
time period [10]. In the United States, the GDP is calculated on a quarterly basis and then
annualized for annualized for each quarter [11]. The Gross Domestic Product is, therefore, a
broad measurement of the overall economic activity of a nation thereby earning the nickname,
the godfather of the indicator world. The Gross Domestic Product is very important in that it is
used to gauge the standard of living in a particular country [12]. The uniformity of the Gross
domestic product has enabled the economic indicator to be used in comparing the productivity of
the numerous nations with an accuracy of the highest degree [13]. GDP is tracked over a long
span of time and is used in gauging the economic decline or growth of a nation [14]. As a result,
it is an important tool that can be used in determining whether or not a country is in recession.
The GDP can be determined primarily using three methods, expenditure approach, the output
approach, and the income approach.
b. Consumer Price Index
The consumer price index (CPI) scrutinizes the weighted average of prices of a basket of
consumer services and goods [15]. The CPI is measured by taking the variations in the price of
Secure Best Marks with AI Grader
Need help grading? Try our AI Grader for instant feedback on your assignments.
Factors affecting the GDP in the United States 5
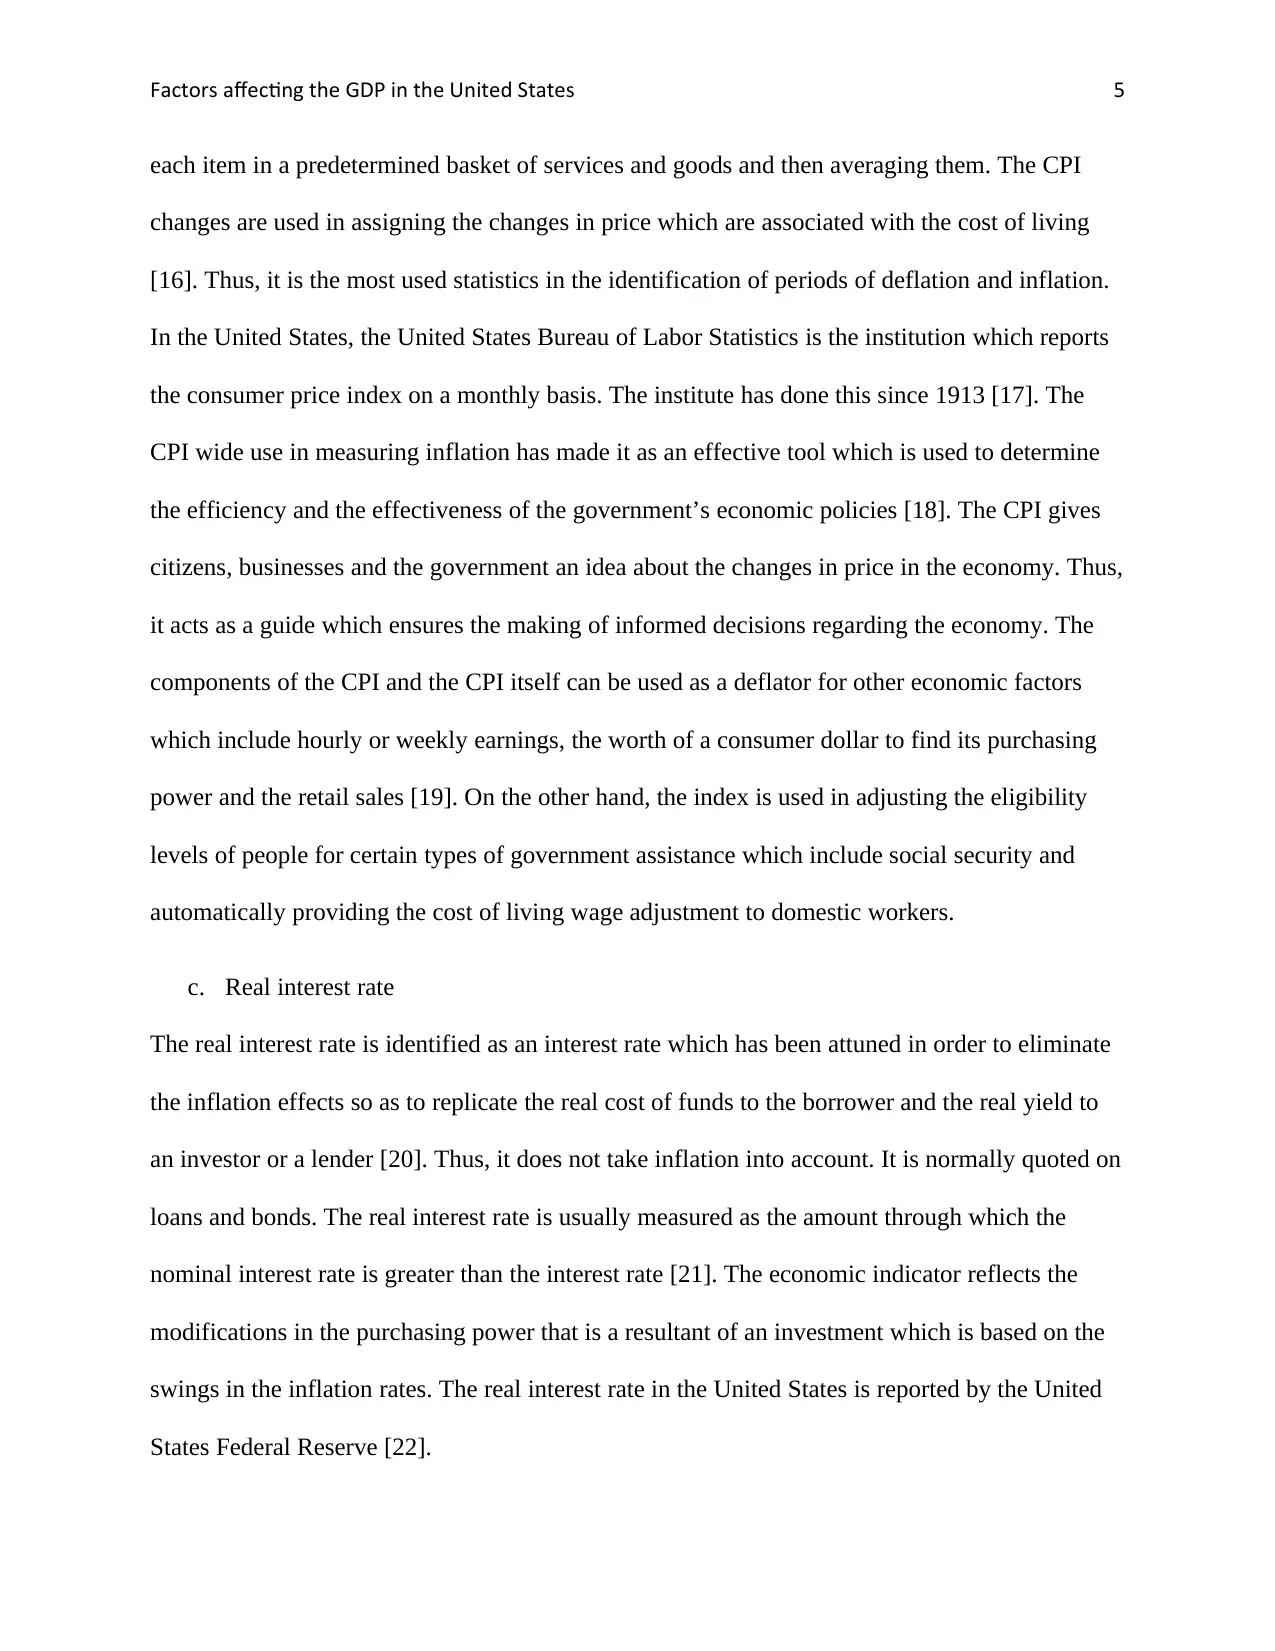
each item in a predetermined basket of services and goods and then averaging them. The CPI
changes are used in assigning the changes in price which are associated with the cost of living
[16]. Thus, it is the most used statistics in the identification of periods of deflation and inflation.
In the United States, the United States Bureau of Labor Statistics is the institution which reports
the consumer price index on a monthly basis. The institute has done this since 1913 [17]. The
CPI wide use in measuring inflation has made it as an effective tool which is used to determine
the efficiency and the effectiveness of the government’s economic policies [18]. The CPI gives
citizens, businesses and the government an idea about the changes in price in the economy. Thus,
it acts as a guide which ensures the making of informed decisions regarding the economy. The
components of the CPI and the CPI itself can be used as a deflator for other economic factors
which include hourly or weekly earnings, the worth of a consumer dollar to find its purchasing
power and the retail sales [19]. On the other hand, the index is used in adjusting the eligibility
levels of people for certain types of government assistance which include social security and
automatically providing the cost of living wage adjustment to domestic workers.
c. Real interest rate
The real interest rate is identified as an interest rate which has been attuned in order to eliminate
the inflation effects so as to replicate the real cost of funds to the borrower and the real yield to
an investor or a lender [20]. Thus, it does not take inflation into account. It is normally quoted on
loans and bonds. The real interest rate is usually measured as the amount through which the
nominal interest rate is greater than the interest rate [21]. The economic indicator reflects the
modifications in the purchasing power that is a resultant of an investment which is based on the
swings in the inflation rates. The real interest rate in the United States is reported by the United
States Federal Reserve [22].
Factors affecting the GDP in the United States 6
d. Broad money
Broad money is classified as the most inclusive method that is used in measuring the money
supply of a given country [23]. Broad money is the money supply which is the entirety of assets
which households and businesses use to make payment or hold as a short-term investment. Broad
money does not only include coins and notes but also savings accounts, and deposits in savings
accounts [24]. Moreover, broad money may include gilts and treasury bills. Such financial
securities are observed as near money since they are more illiquid compared to instant saving
accounts and cash. However, broad money does not include assists such as shares and long-term
dated securities. Though they can be sold, they are not included since they fall into the category
of assets rather than money. Thus, broad money includes M2, M3, and M4 [25].
6. Collected data
The nature of the research's data that was used was secondary. The data was acquired from an
existing source, that is, the World Bank. Though the data was freely available on the internet, the
ownership of the original data had to be acknowledged. Moreover, the data obtained from World
Bank was checked to ensure that the data is adequate and relevant. Consequently, it was
evaluated through the methodology of data collection, period of data collection, accuracy, the
aim of collecting the data, and the data content.
Data collected on the gross domestic product, consumer price index, real interest rate and broad
money was quantitative in nature. Moreover, the data was also time series, that is, the data
covered a spread of time course (1961 to 2016).
The following are the trends of the collected data.
Factors affecting the GDP in the United States 7
a. GDP
1961
1963
1965
1967
1969
1971
1973
1975
1977
1979
1981
1983
1985
1987
1989
1991
1993
1995
1997
1999
2001
2003
2005
2007
2009
2011
2013
2015
0
2000
4000
6000
8000
10000
12000
14000
16000
18000
20000
GDP (current US$ in Billions)
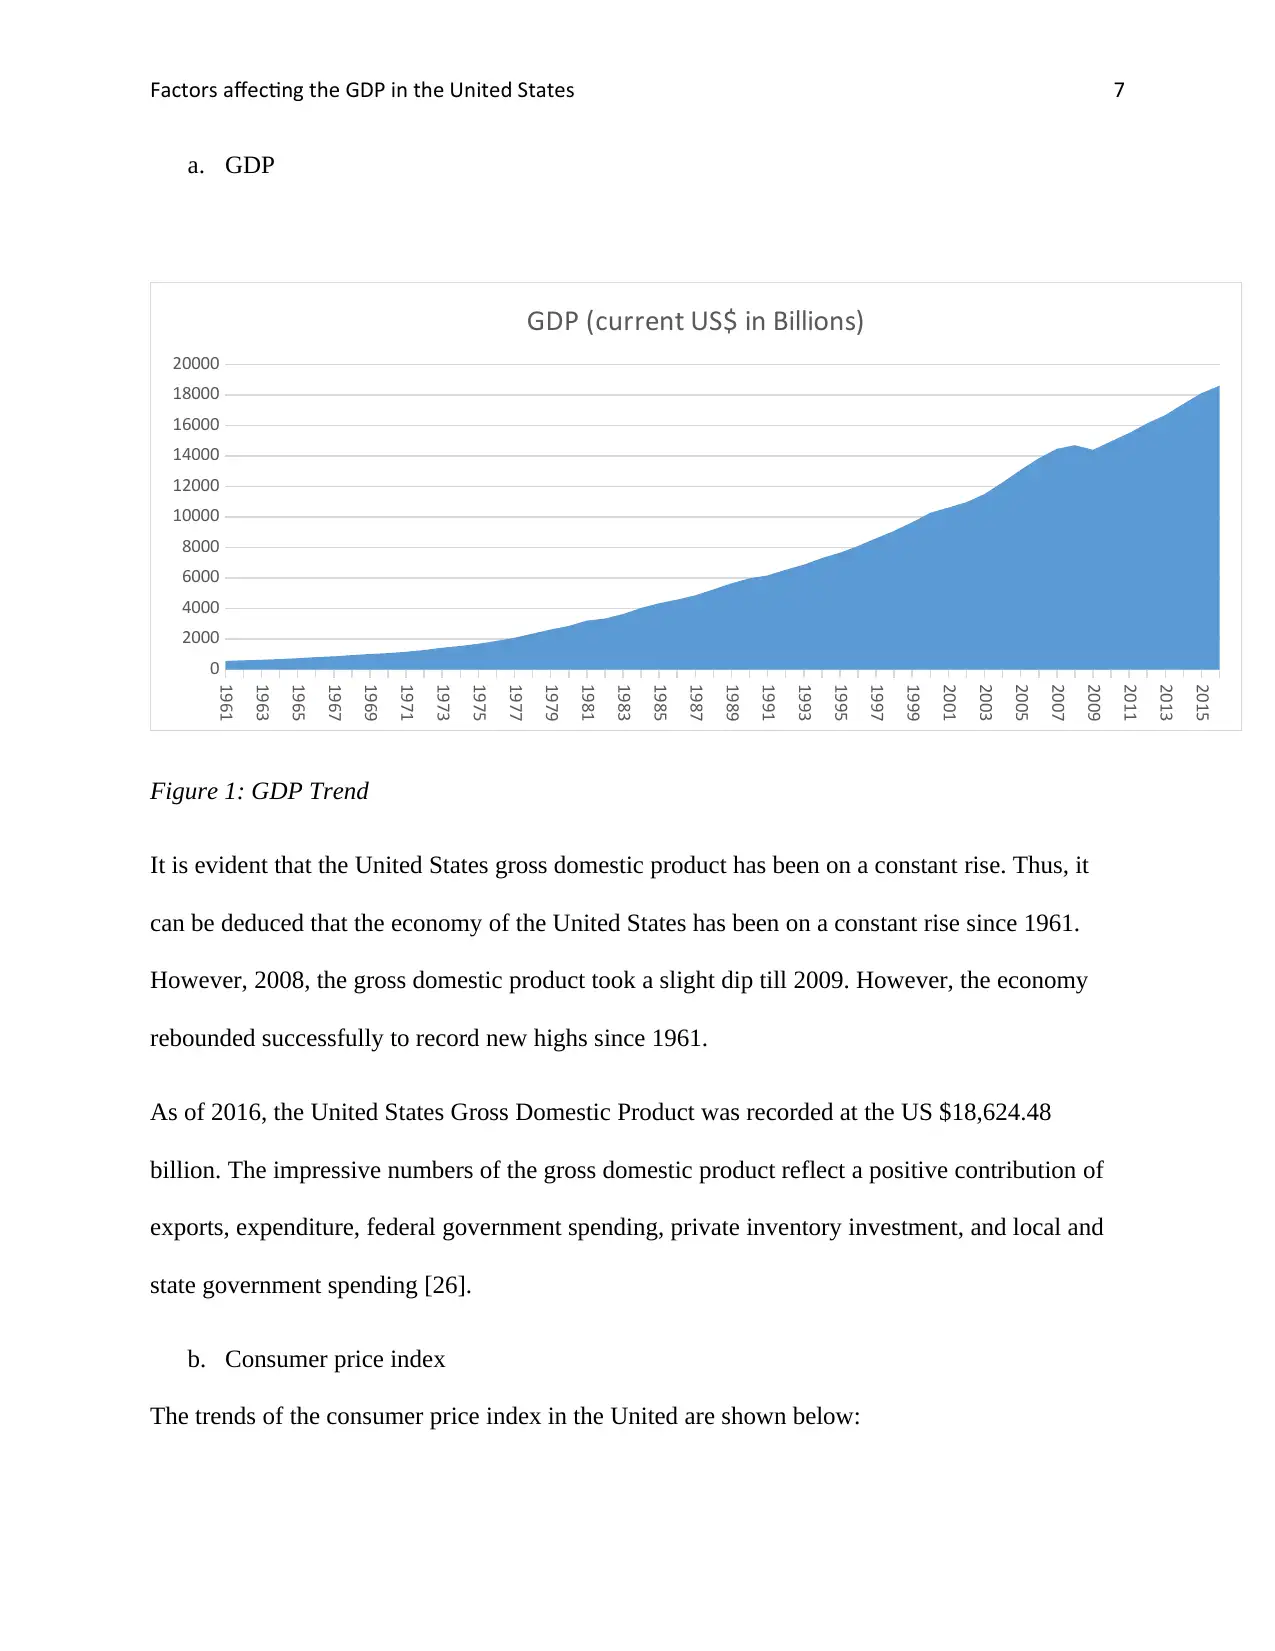
Figure 1: GDP Trend
It is evident that the United States gross domestic product has been on a constant rise. Thus, it
can be deduced that the economy of the United States has been on a constant rise since 1961.
However, 2008, the gross domestic product took a slight dip till 2009. However, the economy
rebounded successfully to record new highs since 1961.
As of 2016, the United States Gross Domestic Product was recorded at the US $18,624.48
billion. The impressive numbers of the gross domestic product reflect a positive contribution of
exports, expenditure, federal government spending, private inventory investment, and local and
state government spending [26].
b. Consumer price index
The trends of the consumer price index in the United are shown below:
a. GDP
1961
1963
1965
1967
1969
1971
1973
1975
1977
1979
1981
1983
1985
1987
1989
1991
1993
1995
1997
1999
2001
2003
2005
2007
2009
2011
2013
2015
0
2000
4000
6000
8000
10000
12000
14000
16000
18000
20000
GDP (current US$ in Billions)
Figure 1: GDP Trend
It is evident that the United States gross domestic product has been on a constant rise. Thus, it
can be deduced that the economy of the United States has been on a constant rise since 1961.
However, 2008, the gross domestic product took a slight dip till 2009. However, the economy
rebounded successfully to record new highs since 1961.
As of 2016, the United States Gross Domestic Product was recorded at the US $18,624.48
billion. The impressive numbers of the gross domestic product reflect a positive contribution of
exports, expenditure, federal government spending, private inventory investment, and local and
state government spending [26].
b. Consumer price index
The trends of the consumer price index in the United are shown below:
Paraphrase This Document
Need a fresh take? Get an instant paraphrase of this document with our AI Paraphraser
Factors affecting the GDP in the United States 8
1961
1963
1965
1967
1969
1971
1973
1975
1977
1979
1981
1983
1985
1987
1989
1991
1993
1995
1997
1999
2001
2003
2005
2007
2009
2011
2013
2015
0.00
20.00
40.00
60.00
80.00
100.00
120.00
Consumer price index
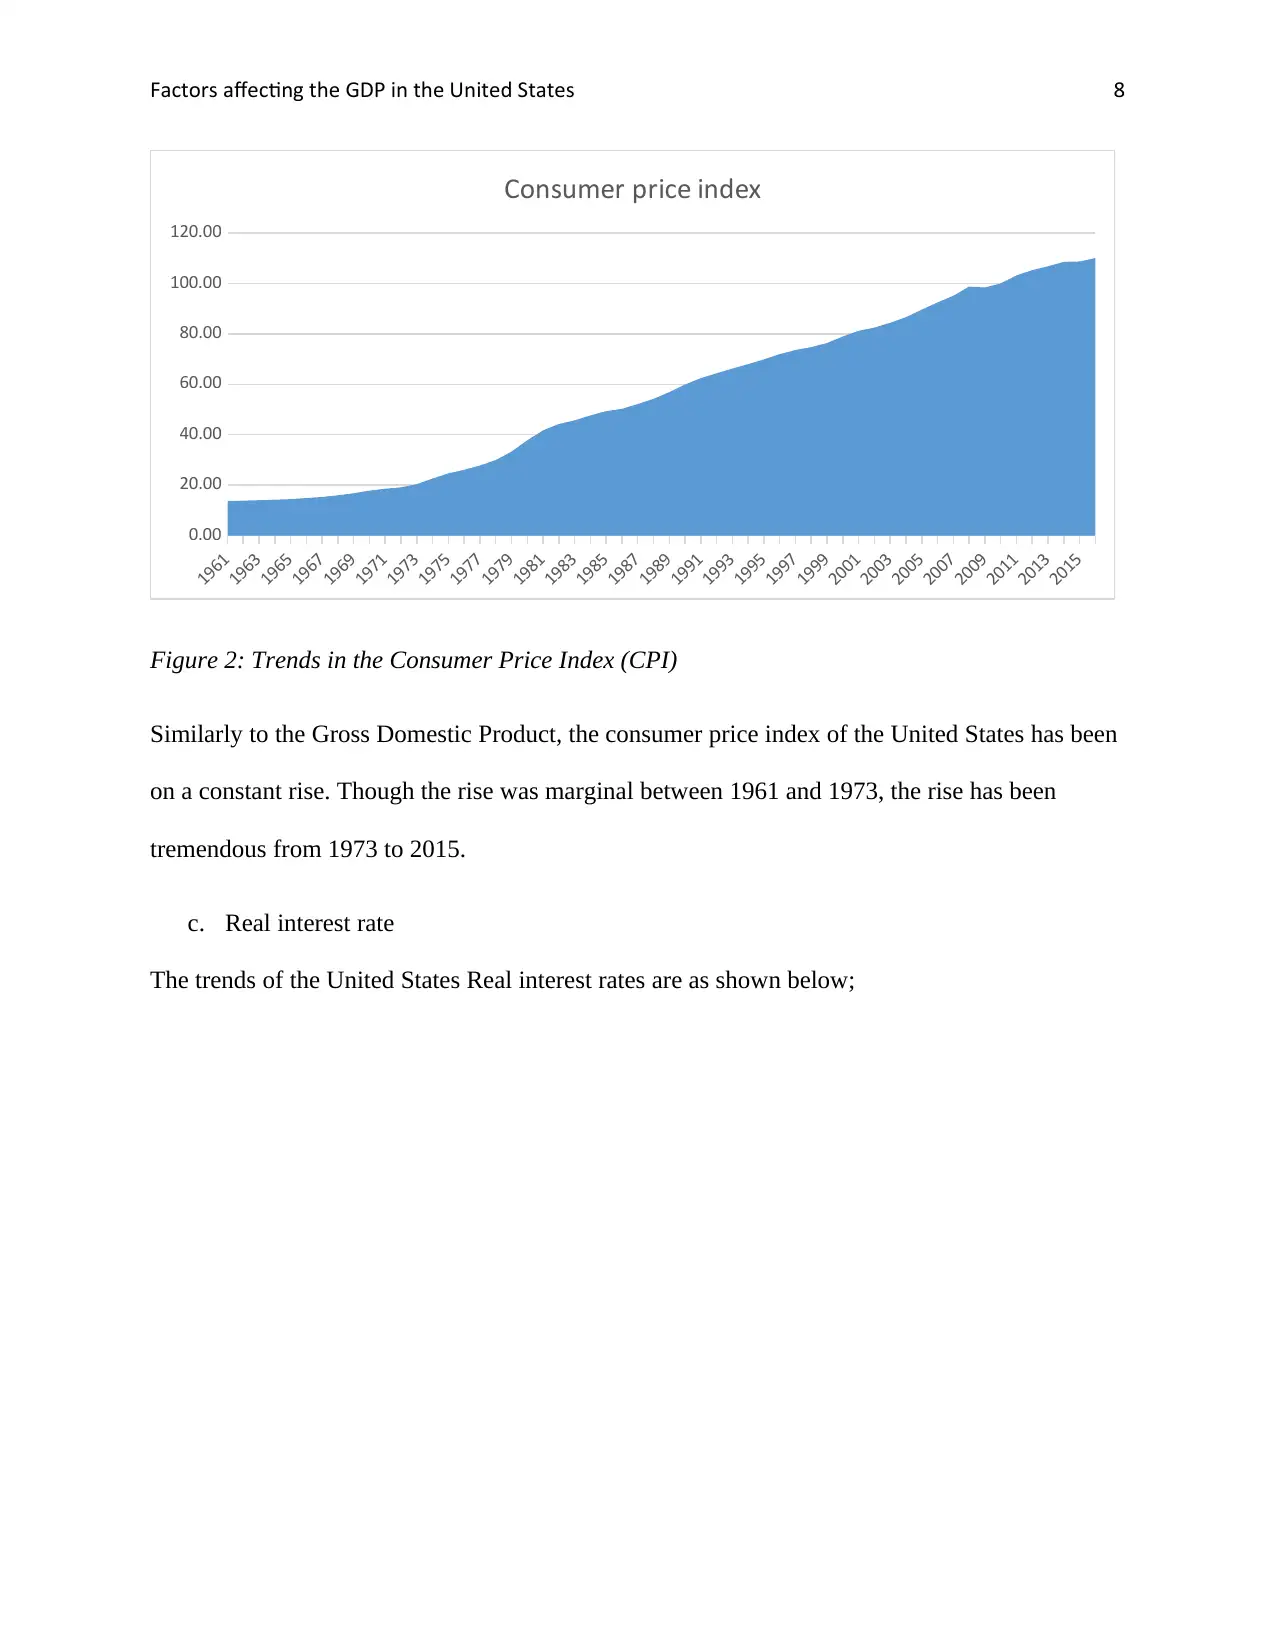
Figure 2: Trends in the Consumer Price Index (CPI)
Similarly to the Gross Domestic Product, the consumer price index of the United States has been
on a constant rise. Though the rise was marginal between 1961 and 1973, the rise has been
tremendous from 1973 to 2015.
c. Real interest rate
The trends of the United States Real interest rates are as shown below;
1961
1963
1965
1967
1969
1971
1973
1975
1977
1979
1981
1983
1985
1987
1989
1991
1993
1995
1997
1999
2001
2003
2005
2007
2009
2011
2013
2015
0.00
20.00
40.00
60.00
80.00
100.00
120.00
Consumer price index
Figure 2: Trends in the Consumer Price Index (CPI)
Similarly to the Gross Domestic Product, the consumer price index of the United States has been
on a constant rise. Though the rise was marginal between 1961 and 1973, the rise has been
tremendous from 1973 to 2015.
c. Real interest rate
The trends of the United States Real interest rates are as shown below;
Factors affecting the GDP in the United States 9
1961
1963
1965
1967
1969
1971
1973
1975
1977
1979
1981
1983
1985
1987
1989
1991
1993
1995
1997
1999
2001
2003
2005
2007
2009
2011
2013
2015
-2.00
0.00
2.00
4.00
6.00
8.00
10.00
Real interest rate (%)
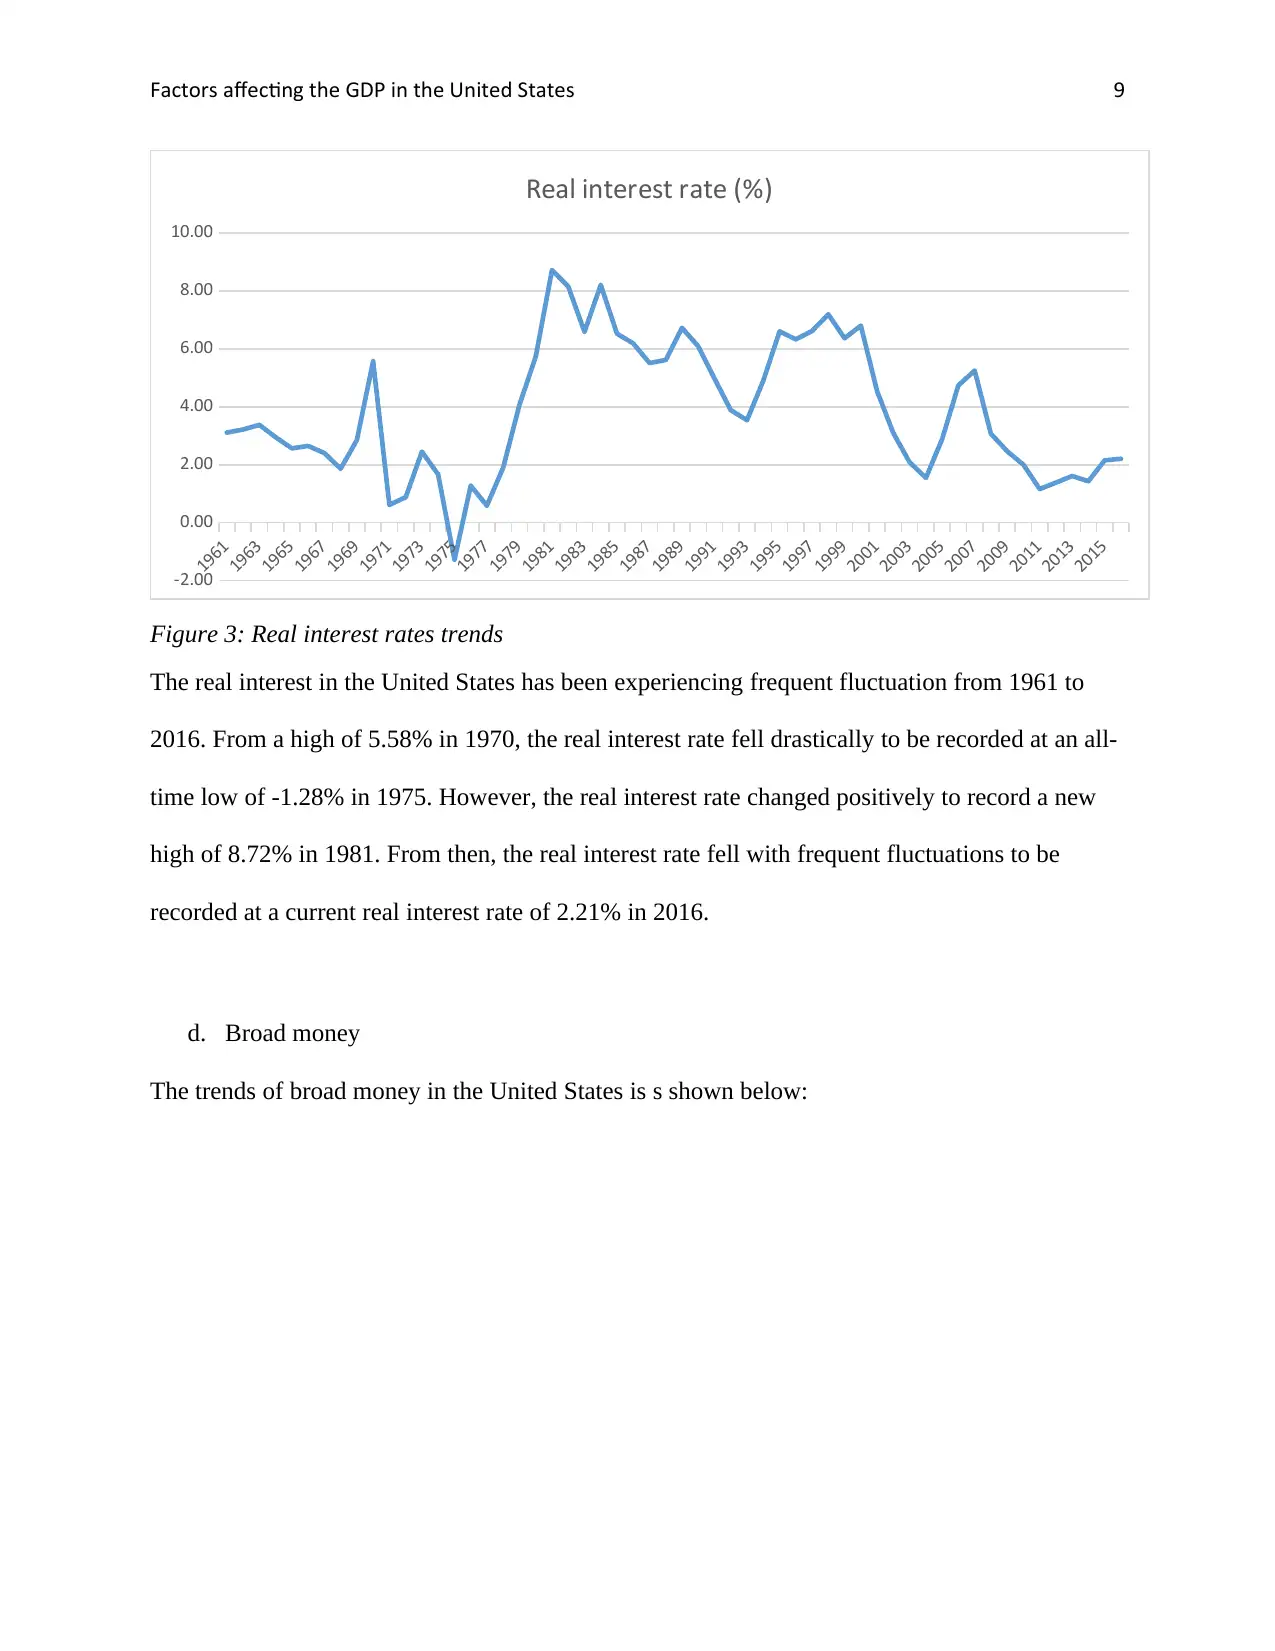
Figure 3: Real interest rates trends
The real interest in the United States has been experiencing frequent fluctuation from 1961 to
2016. From a high of 5.58% in 1970, the real interest rate fell drastically to be recorded at an all-
time low of -1.28% in 1975. However, the real interest rate changed positively to record a new
high of 8.72% in 1981. From then, the real interest rate fell with frequent fluctuations to be
recorded at a current real interest rate of 2.21% in 2016.
d. Broad money
The trends of broad money in the United States is s shown below:
1961
1963
1965
1967
1969
1971
1973
1975
1977
1979
1981
1983
1985
1987
1989
1991
1993
1995
1997
1999
2001
2003
2005
2007
2009
2011
2013
2015
-2.00
0.00
2.00
4.00
6.00
8.00
10.00
Real interest rate (%)
Figure 3: Real interest rates trends
The real interest in the United States has been experiencing frequent fluctuation from 1961 to
2016. From a high of 5.58% in 1970, the real interest rate fell drastically to be recorded at an all-
time low of -1.28% in 1975. However, the real interest rate changed positively to record a new
high of 8.72% in 1981. From then, the real interest rate fell with frequent fluctuations to be
recorded at a current real interest rate of 2.21% in 2016.
d. Broad money
The trends of broad money in the United States is s shown below:
Factors affecting the GDP in the United States 10
1961
1963
1965
1967
1969
1971
1973
1975
1977
1979
1981
1983
1985
1987
1989
1991
1993
1995
1997
1999
2001
2003
2005
2007
2009
2011
2013
2015
0.00
10.00
20.00
30.00
40.00
50.00
60.00
70.00
80.00
90.00
100.00
Broad money (% of GDP)
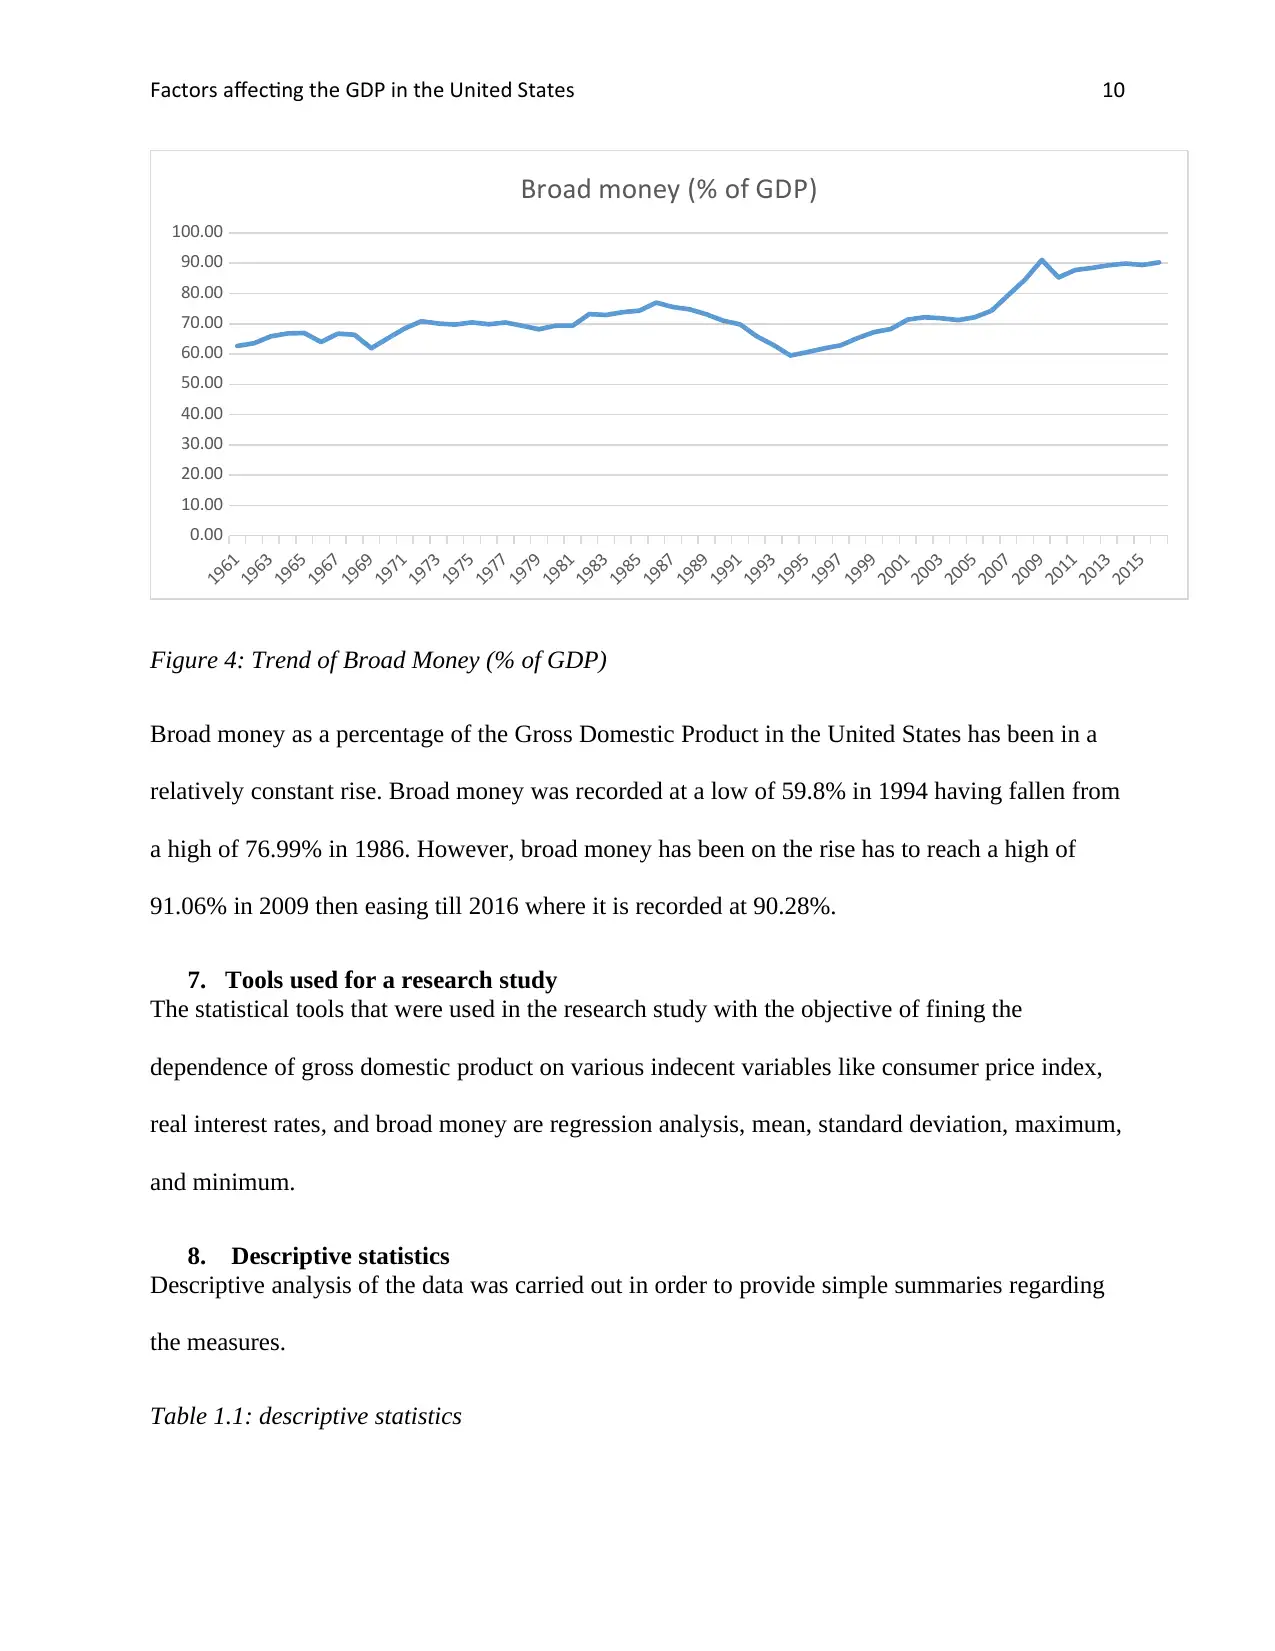
Figure 4: Trend of Broad Money (% of GDP)
Broad money as a percentage of the Gross Domestic Product in the United States has been in a
relatively constant rise. Broad money was recorded at a low of 59.8% in 1994 having fallen from
a high of 76.99% in 1986. However, broad money has been on the rise has to reach a high of
91.06% in 2009 then easing till 2016 where it is recorded at 90.28%.
7. Tools used for a research study
The statistical tools that were used in the research study with the objective of fining the
dependence of gross domestic product on various indecent variables like consumer price index,
real interest rates, and broad money are regression analysis, mean, standard deviation, maximum,
and minimum.
8. Descriptive statistics
Descriptive analysis of the data was carried out in order to provide simple summaries regarding
the measures.
Table 1.1: descriptive statistics
1961
1963
1965
1967
1969
1971
1973
1975
1977
1979
1981
1983
1985
1987
1989
1991
1993
1995
1997
1999
2001
2003
2005
2007
2009
2011
2013
2015
0.00
10.00
20.00
30.00
40.00
50.00
60.00
70.00
80.00
90.00
100.00
Broad money (% of GDP)
Figure 4: Trend of Broad Money (% of GDP)
Broad money as a percentage of the Gross Domestic Product in the United States has been in a
relatively constant rise. Broad money was recorded at a low of 59.8% in 1994 having fallen from
a high of 76.99% in 1986. However, broad money has been on the rise has to reach a high of
91.06% in 2009 then easing till 2016 where it is recorded at 90.28%.
7. Tools used for a research study
The statistical tools that were used in the research study with the objective of fining the
dependence of gross domestic product on various indecent variables like consumer price index,
real interest rates, and broad money are regression analysis, mean, standard deviation, maximum,
and minimum.
8. Descriptive statistics
Descriptive analysis of the data was carried out in order to provide simple summaries regarding
the measures.
Table 1.1: descriptive statistics
Secure Best Marks with AI Grader
Need help grading? Try our AI Grader for instant feedback on your assignments.
Factors affecting the GDP in the United States 11
Observatio
ns
Minimu
m
Maximu
m
Mean Std.
Deviation
GDP (current US$ in
Billions)
56 563.30 18624.48 6885.2516 5656.74970
Consumer price index 56 13.72 110.07 56.6341 32.31029
Real interest rate (%) 56 -1.28 8.72 3.8500 2.30184
Broad money (% of
GDP)
56 59.48 91.06 72.0454 8.38451
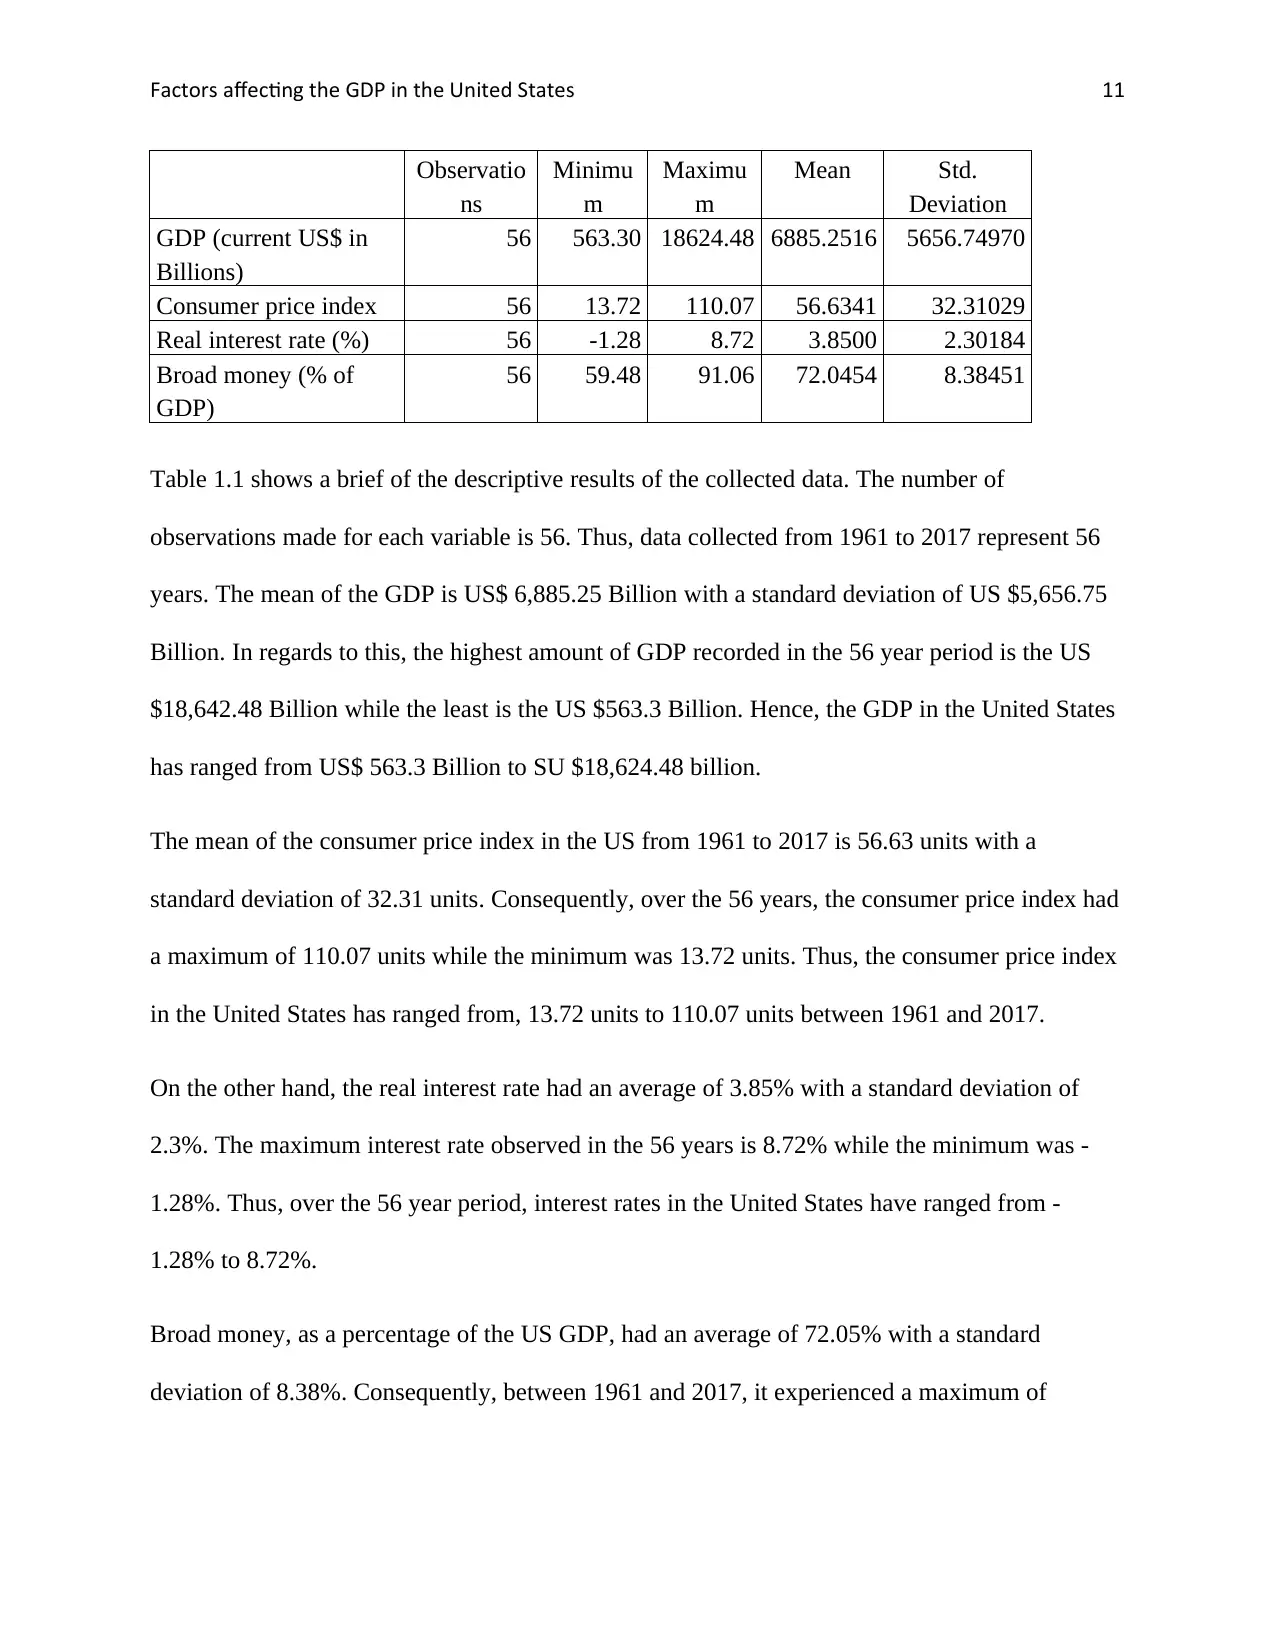
Table 1.1 shows a brief of the descriptive results of the collected data. The number of
observations made for each variable is 56. Thus, data collected from 1961 to 2017 represent 56
years. The mean of the GDP is US$ 6,885.25 Billion with a standard deviation of US $5,656.75
Billion. In regards to this, the highest amount of GDP recorded in the 56 year period is the US
$18,642.48 Billion while the least is the US $563.3 Billion. Hence, the GDP in the United States
has ranged from US$ 563.3 Billion to SU $18,624.48 billion.
The mean of the consumer price index in the US from 1961 to 2017 is 56.63 units with a
standard deviation of 32.31 units. Consequently, over the 56 years, the consumer price index had
a maximum of 110.07 units while the minimum was 13.72 units. Thus, the consumer price index
in the United States has ranged from, 13.72 units to 110.07 units between 1961 and 2017.
On the other hand, the real interest rate had an average of 3.85% with a standard deviation of
2.3%. The maximum interest rate observed in the 56 years is 8.72% while the minimum was -
1.28%. Thus, over the 56 year period, interest rates in the United States have ranged from -
1.28% to 8.72%.
Broad money, as a percentage of the US GDP, had an average of 72.05% with a standard
deviation of 8.38%. Consequently, between 1961 and 2017, it experienced a maximum of
Observatio
ns
Minimu
m
Maximu
m
Mean Std.
Deviation
GDP (current US$ in
Billions)
56 563.30 18624.48 6885.2516 5656.74970
Consumer price index 56 13.72 110.07 56.6341 32.31029
Real interest rate (%) 56 -1.28 8.72 3.8500 2.30184
Broad money (% of
GDP)
56 59.48 91.06 72.0454 8.38451
Table 1.1 shows a brief of the descriptive results of the collected data. The number of
observations made for each variable is 56. Thus, data collected from 1961 to 2017 represent 56
years. The mean of the GDP is US$ 6,885.25 Billion with a standard deviation of US $5,656.75
Billion. In regards to this, the highest amount of GDP recorded in the 56 year period is the US
$18,642.48 Billion while the least is the US $563.3 Billion. Hence, the GDP in the United States
has ranged from US$ 563.3 Billion to SU $18,624.48 billion.
The mean of the consumer price index in the US from 1961 to 2017 is 56.63 units with a
standard deviation of 32.31 units. Consequently, over the 56 years, the consumer price index had
a maximum of 110.07 units while the minimum was 13.72 units. Thus, the consumer price index
in the United States has ranged from, 13.72 units to 110.07 units between 1961 and 2017.
On the other hand, the real interest rate had an average of 3.85% with a standard deviation of
2.3%. The maximum interest rate observed in the 56 years is 8.72% while the minimum was -
1.28%. Thus, over the 56 year period, interest rates in the United States have ranged from -
1.28% to 8.72%.
Broad money, as a percentage of the US GDP, had an average of 72.05% with a standard
deviation of 8.38%. Consequently, between 1961 and 2017, it experienced a maximum of
Factors affecting the GDP in the United States 12
91.06% and a minimum of 59.48%. Therefore, broad money as a percentage of the GDP ranged
from 59.48% to 91.06%.
9. Correlation
A correlation analysis was also adopted. The method is a statistical evaluation which is aimed at
determining the strength of a relationship between two continuous variables which are
numerically measured [27]. Through the correlation analysis, the researcher gets to know
whether it is possible to establish a connection between variables.
Table 1.2: Correlation
GDP (current
US$ in
Billions)
Consumer
price index
Real interest
rate (%)
Broad
money (%
of GDP)
GDP (current US$ in
Billions)
Pearson Correlation 1
Sig. (2-tailed)
Consumer price
index
Pearson Correlation .980** 1
Sig. (2-tailed) .000
Real interest rate
(%)
Pearson Correlation -.083 .055 1
Sig. (2-tailed) .544 .687
Broad money (% of
GDP)
Pearson Correlation .730** .667** -.269* 1
Sig. (2-tailed) .000 .000 .045
**. Correlation is significant at the 0.01 level (2-tailed).
*. Correlation is significant at the 0.05 level (2-tailed).
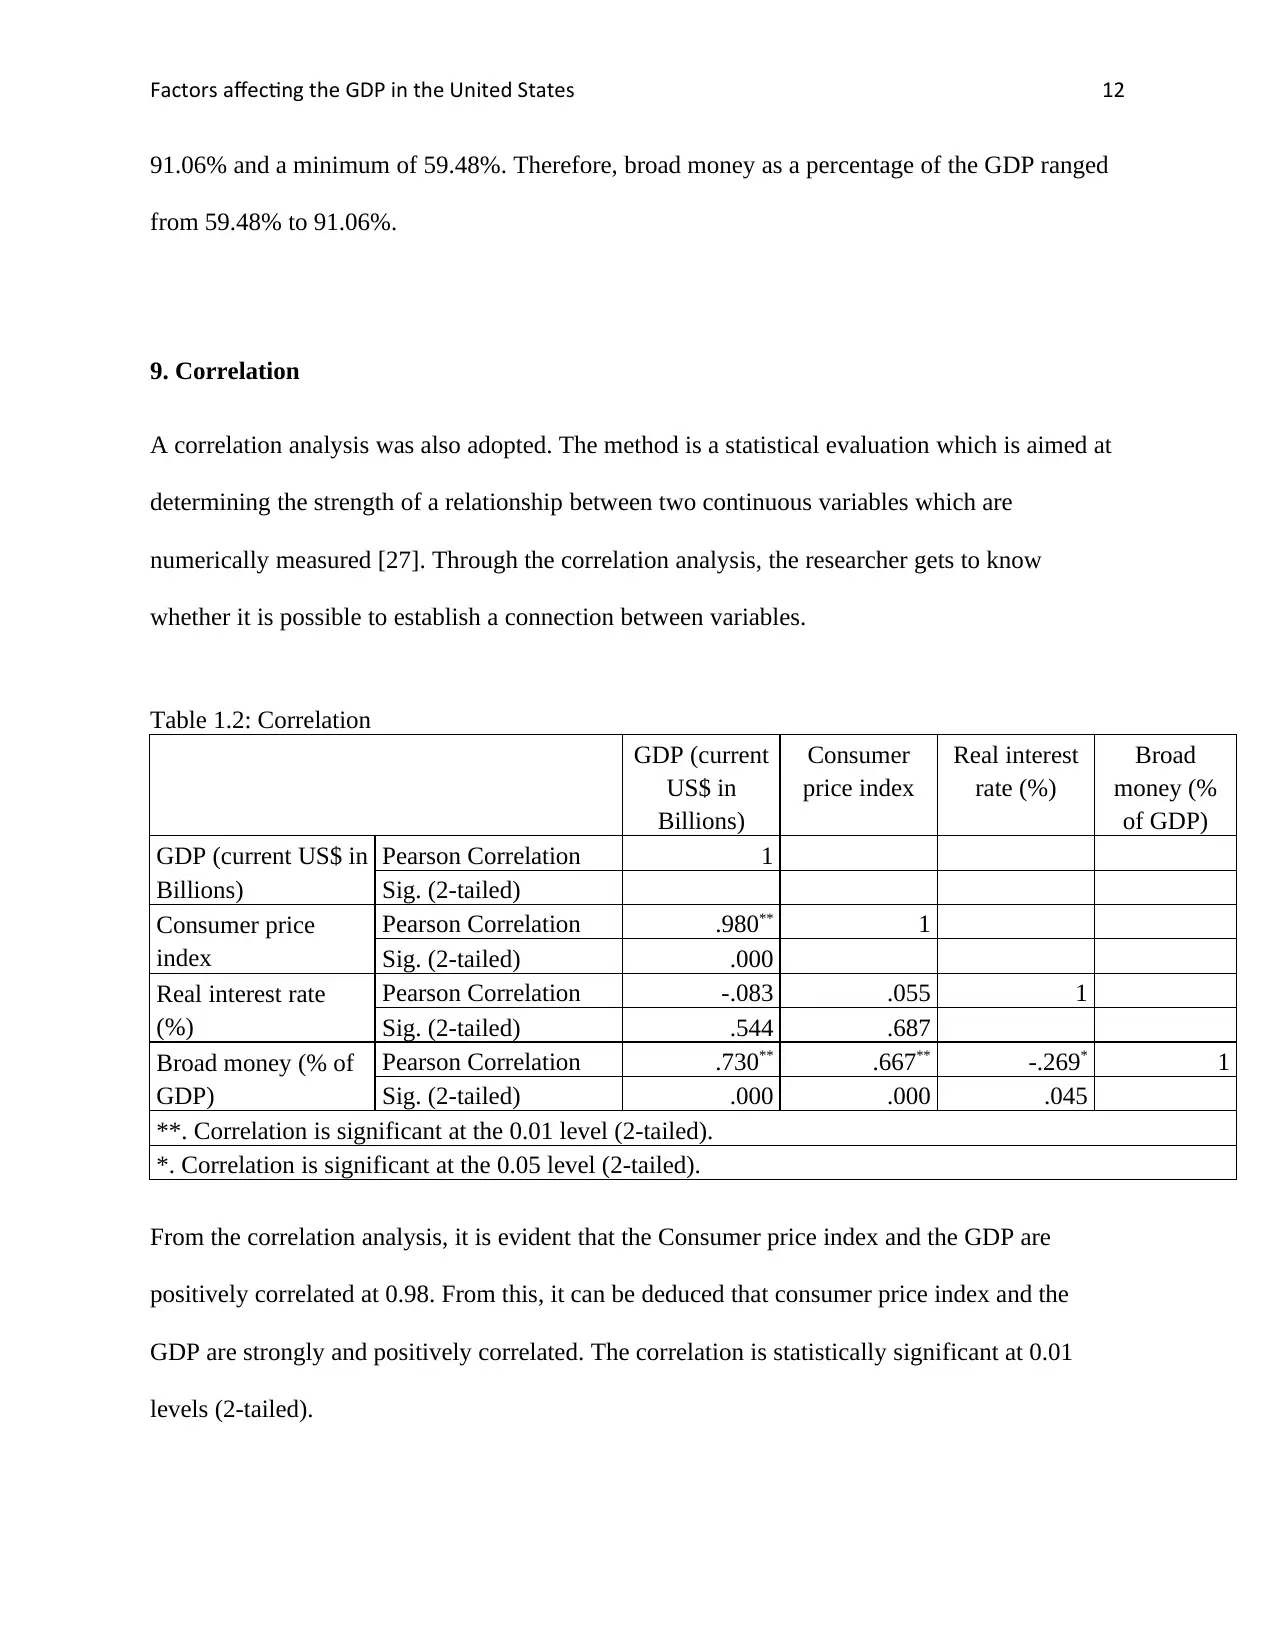
From the correlation analysis, it is evident that the Consumer price index and the GDP are
positively correlated at 0.98. From this, it can be deduced that consumer price index and the
GDP are strongly and positively correlated. The correlation is statistically significant at 0.01
levels (2-tailed).
91.06% and a minimum of 59.48%. Therefore, broad money as a percentage of the GDP ranged
from 59.48% to 91.06%.
9. Correlation
A correlation analysis was also adopted. The method is a statistical evaluation which is aimed at
determining the strength of a relationship between two continuous variables which are
numerically measured [27]. Through the correlation analysis, the researcher gets to know
whether it is possible to establish a connection between variables.
Table 1.2: Correlation
GDP (current
US$ in
Billions)
Consumer
price index
Real interest
rate (%)
Broad
money (%
of GDP)
GDP (current US$ in
Billions)
Pearson Correlation 1
Sig. (2-tailed)
Consumer price
index
Pearson Correlation .980** 1
Sig. (2-tailed) .000
Real interest rate
(%)
Pearson Correlation -.083 .055 1
Sig. (2-tailed) .544 .687
Broad money (% of
GDP)
Pearson Correlation .730** .667** -.269* 1
Sig. (2-tailed) .000 .000 .045
**. Correlation is significant at the 0.01 level (2-tailed).
*. Correlation is significant at the 0.05 level (2-tailed).
From the correlation analysis, it is evident that the Consumer price index and the GDP are
positively correlated at 0.98. From this, it can be deduced that consumer price index and the
GDP are strongly and positively correlated. The correlation is statistically significant at 0.01
levels (2-tailed).
Factors affecting the GDP in the United States 13
The real interest rate is weakly and negatively correlated with the GDP, -0.083 correlation.
However, the correlation is neither significant at the 0.01 level and the 0.05 level (2-tail). Broad
money as a percentage of the GDP is strongly and positively correlated with GDP, 0.73
correlations. On the other hand, the correlation between broad money and GDP can be seen to be
significant at the 0.01 level (2-tail).
10. Statistical model
The study aimed to establish a relationship between dependent variables, which are Gross
Domestic Product (GDP), an independent variable, which is the interest rates, consumer price
index, and broad money as a percentage of gross domestic products. Thus, Gross Domestic
Product= f (interest rates, consumer price index, broad money).
Thus, GDP = β0 - β1r +β2CPI + β3Bm
β 0 is assumed to be positive and about the same size as last year's GDP. β 2 and β3 are
also assumed to be positive since it is assumed that CPI and broad money are an increasing
factor of GDP.
On the other hand, β1 should be negative since gross domestic product goes down as interest
rates go up.
11. Statistical Results
A regression analysis was carried out as seen in the subsequent tables.
a. Regression Results
Table 1.3: Model summary
Paraphrase This Document
Need a fresh take? Get an instant paraphrase of this document with our AI Paraphraser
Factors affecting the GDP in the United States 14
Model R R Square Adjusted R
Square
Std. Error of the Estimate
1 .991a .982 .981 774.85627
a. Predictors: (Constant), Broad money (% of GDP), Real interest rate (%),
Consumer price index
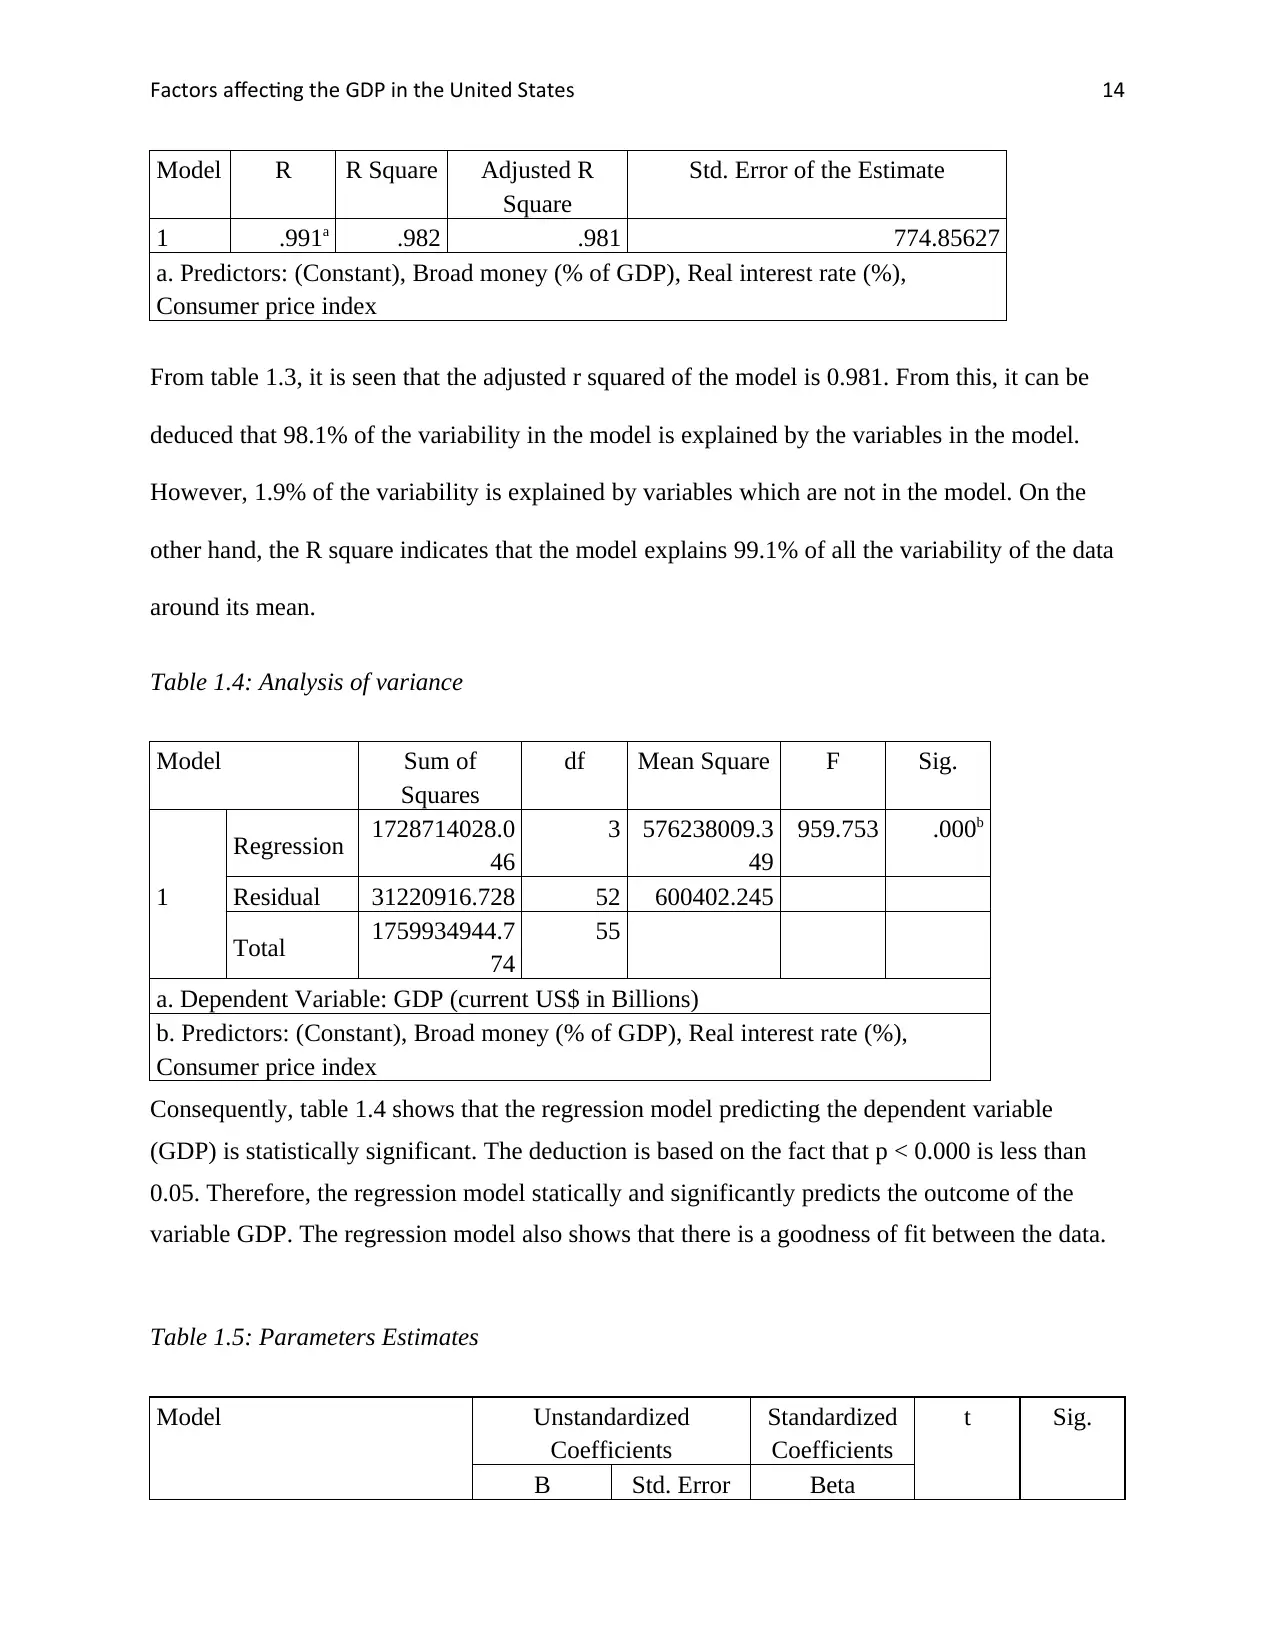
From table 1.3, it is seen that the adjusted r squared of the model is 0.981. From this, it can be
deduced that 98.1% of the variability in the model is explained by the variables in the model.
However, 1.9% of the variability is explained by variables which are not in the model. On the
other hand, the R square indicates that the model explains 99.1% of all the variability of the data
around its mean.
Table 1.4: Analysis of variance
Model Sum of
Squares
df Mean Square F Sig.
1
Regression 1728714028.0
46
3 576238009.3
49
959.753 .000b
Residual 31220916.728 52 600402.245
Total 1759934944.7
74
55
a. Dependent Variable: GDP (current US$ in Billions)
b. Predictors: (Constant), Broad money (% of GDP), Real interest rate (%),
Consumer price index
Consequently, table 1.4 shows that the regression model predicting the dependent variable
(GDP) is statistically significant. The deduction is based on the fact that p < 0.000 is less than
0.05. Therefore, the regression model statically and significantly predicts the outcome of the
variable GDP. The regression model also shows that there is a goodness of fit between the data.
Table 1.5: Parameters Estimates
Model Unstandardized
Coefficients
Standardized
Coefficients
t Sig.
B Std. Error Beta
Model R R Square Adjusted R
Square
Std. Error of the Estimate
1 .991a .982 .981 774.85627
a. Predictors: (Constant), Broad money (% of GDP), Real interest rate (%),
Consumer price index
From table 1.3, it is seen that the adjusted r squared of the model is 0.981. From this, it can be
deduced that 98.1% of the variability in the model is explained by the variables in the model.
However, 1.9% of the variability is explained by variables which are not in the model. On the
other hand, the R square indicates that the model explains 99.1% of all the variability of the data
around its mean.
Table 1.4: Analysis of variance
Model Sum of
Squares
df Mean Square F Sig.
1
Regression 1728714028.0
46
3 576238009.3
49
959.753 .000b
Residual 31220916.728 52 600402.245
Total 1759934944.7
74
55
a. Dependent Variable: GDP (current US$ in Billions)
b. Predictors: (Constant), Broad money (% of GDP), Real interest rate (%),
Consumer price index
Consequently, table 1.4 shows that the regression model predicting the dependent variable
(GDP) is statistically significant. The deduction is based on the fact that p < 0.000 is less than
0.05. Therefore, the regression model statically and significantly predicts the outcome of the
variable GDP. The regression model also shows that there is a goodness of fit between the data.
Table 1.5: Parameters Estimates
Model Unstandardized
Coefficients
Standardized
Coefficients
t Sig.
B Std. Error Beta
Factors affecting the GDP in the United States 15
1
(Constant) -4960.196 1245.093 -3.984 .000
Consumer price index 163.975 4.591 .937 35.716 .000
Real interest rate (%) -281.030 49.866 -.114 -5.636 .000
Broad money (% of
GDP)
50.535 18.342 .075 2.755 .008
a. Dependent Variable: GDP (current US$ in Billions)
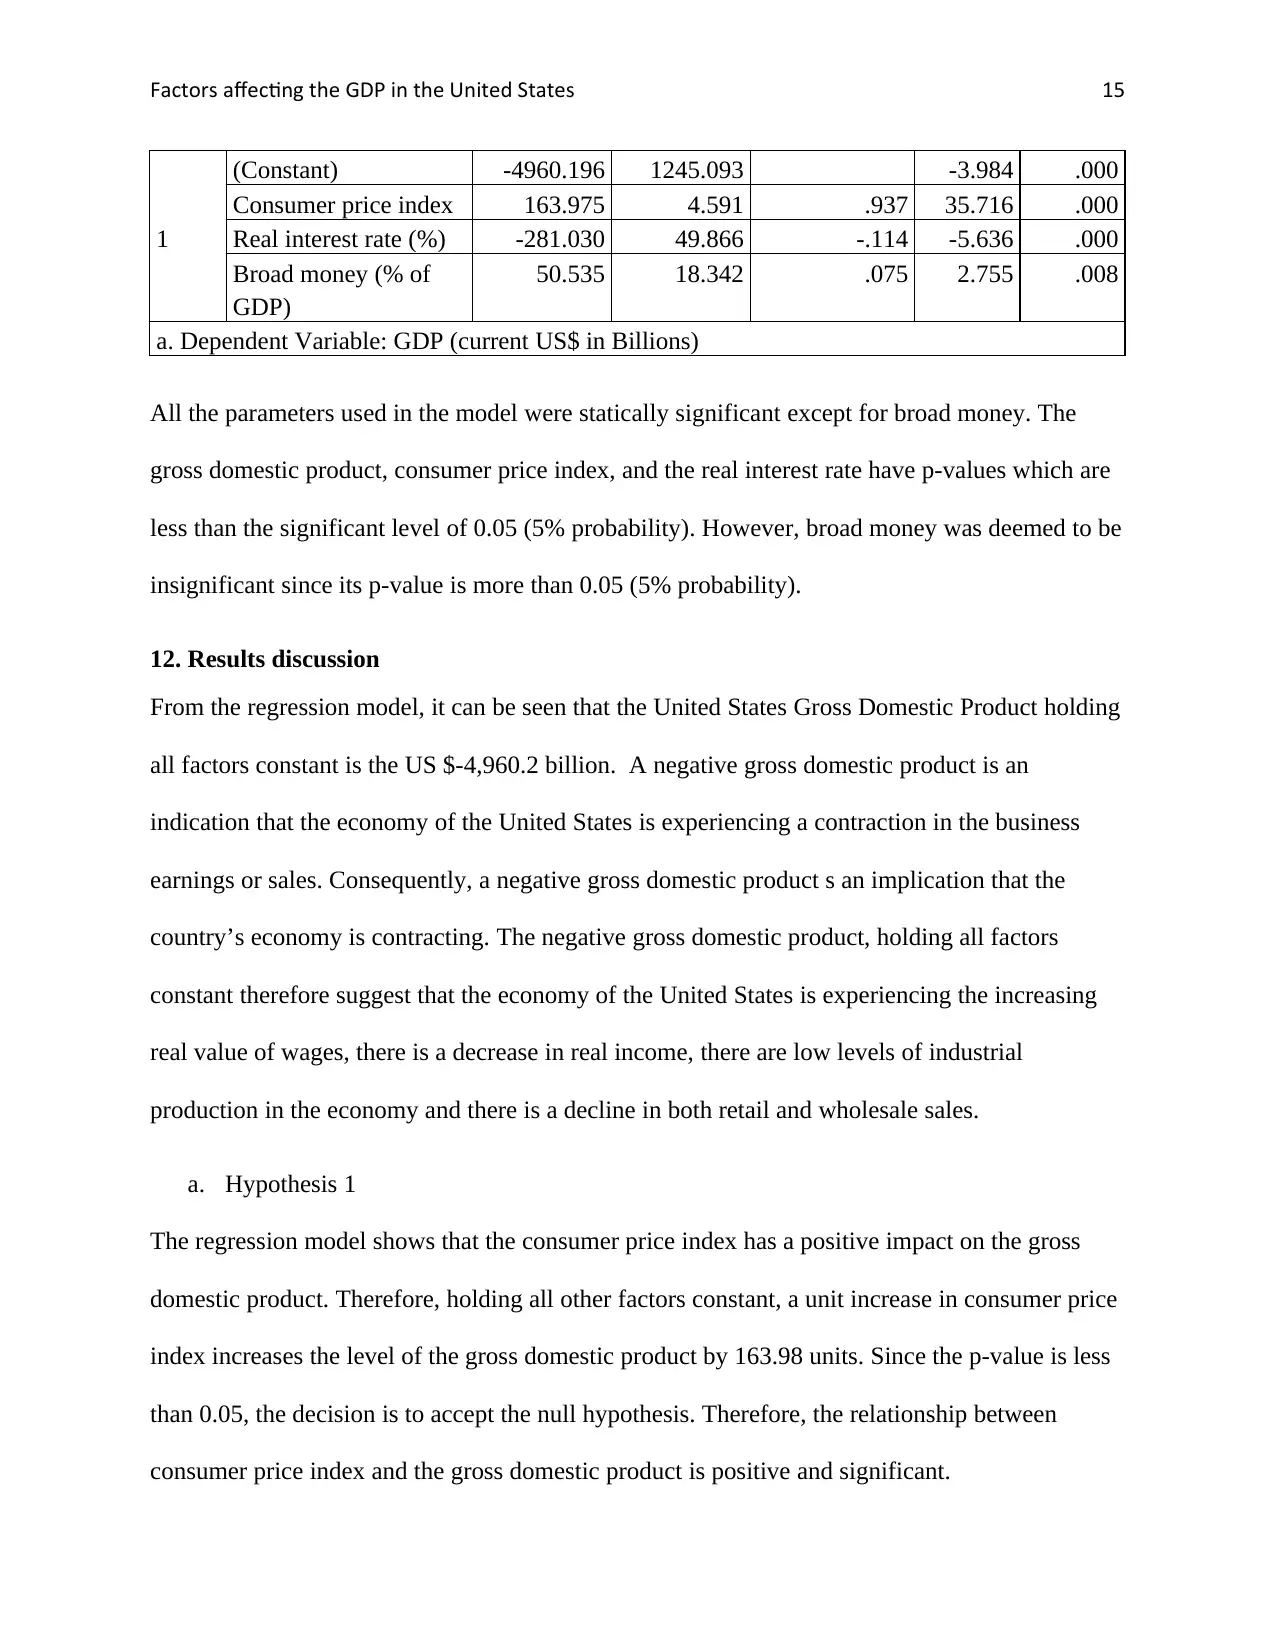
All the parameters used in the model were statically significant except for broad money. The
gross domestic product, consumer price index, and the real interest rate have p-values which are
less than the significant level of 0.05 (5% probability). However, broad money was deemed to be
insignificant since its p-value is more than 0.05 (5% probability).
12. Results discussion
From the regression model, it can be seen that the United States Gross Domestic Product holding
all factors constant is the US $-4,960.2 billion. A negative gross domestic product is an
indication that the economy of the United States is experiencing a contraction in the business
earnings or sales. Consequently, a negative gross domestic product s an implication that the
country’s economy is contracting. The negative gross domestic product, holding all factors
constant therefore suggest that the economy of the United States is experiencing the increasing
real value of wages, there is a decrease in real income, there are low levels of industrial
production in the economy and there is a decline in both retail and wholesale sales.
a. Hypothesis 1
The regression model shows that the consumer price index has a positive impact on the gross
domestic product. Therefore, holding all other factors constant, a unit increase in consumer price
index increases the level of the gross domestic product by 163.98 units. Since the p-value is less
than 0.05, the decision is to accept the null hypothesis. Therefore, the relationship between
consumer price index and the gross domestic product is positive and significant.
1
(Constant) -4960.196 1245.093 -3.984 .000
Consumer price index 163.975 4.591 .937 35.716 .000
Real interest rate (%) -281.030 49.866 -.114 -5.636 .000
Broad money (% of
GDP)
50.535 18.342 .075 2.755 .008
a. Dependent Variable: GDP (current US$ in Billions)
All the parameters used in the model were statically significant except for broad money. The
gross domestic product, consumer price index, and the real interest rate have p-values which are
less than the significant level of 0.05 (5% probability). However, broad money was deemed to be
insignificant since its p-value is more than 0.05 (5% probability).
12. Results discussion
From the regression model, it can be seen that the United States Gross Domestic Product holding
all factors constant is the US $-4,960.2 billion. A negative gross domestic product is an
indication that the economy of the United States is experiencing a contraction in the business
earnings or sales. Consequently, a negative gross domestic product s an implication that the
country’s economy is contracting. The negative gross domestic product, holding all factors
constant therefore suggest that the economy of the United States is experiencing the increasing
real value of wages, there is a decrease in real income, there are low levels of industrial
production in the economy and there is a decline in both retail and wholesale sales.
a. Hypothesis 1
The regression model shows that the consumer price index has a positive impact on the gross
domestic product. Therefore, holding all other factors constant, a unit increase in consumer price
index increases the level of the gross domestic product by 163.98 units. Since the p-value is less
than 0.05, the decision is to accept the null hypothesis. Therefore, the relationship between
consumer price index and the gross domestic product is positive and significant.
Factors affecting the GDP in the United States 16
b. Hypothesis 2
Conversely, the real interest rate is observed to have a negative influence on the gross domestic
product. Thus, a unit increase in real interest rate decreases the level of gross domestic product in
the US economy by 281.03 units ceteris peribus. However, the real interest rate coefficient is
seen to be significant. Thus, we choose to accept the null hypothesis that real interest rate and the
gross domestic product is negatively and significantly related.
c. Hypothesis 3
Finally, broad money as a percentage of the GDP is seen to have a positive impact on the gross
domestic product. Hence, a unit increase in broad money leads to 50.53 increase in the gross
domestic product in the United States. Since the p-value is more than 0.05, we choose to reject
the null hypothesis. Thus, the relationship between broad money and the gross domestic product
is not positively and significantly significant.
Thus,
GDP = -4,960.196 + 163.975CPI + 50.535Bm – 281.03r
The consumer price index and the gross domestic product are the two most vital features of a
healthy country [28]. From the research, it is evident that the consumer price index positively
and significantly affects the gross domestic product. Thus, a steady growth of the consumer price
index offsets the negative impacts on the gross domestic product. When consumer price
increases, wages eventually increases since the consumer price index is adapted to adjust
income. Adjustment of the consumer price index to adjust tax brackets, retirement benefits,
wages, and other important economic indicator is done by the Bureau of Labor and Statistics
(BLS) [29]. On the contrary, if the government is slow compared to the market, the gross
domestic product will grow fast and the government will not be in a position to make
Secure Best Marks with AI Grader
Need help grading? Try our AI Grader for instant feedback on your assignments.
Factors affecting the GDP in the United States 17
adjustments that the people require to uphold a good quality of life since the cost of living has
augmented too fast.
An increase in demand for real goods and services will necessitate more production of real goods
and services, therefore, pushing up the gross domestic product of the United States [30]. An
increase in demand warrants an increase in money supply and also a decrease in real interest
rates. As a result, the gross domestic level of the United States will begin to slowly expand.
Therefore, in tandem with the research findings, the decrease in interest rate will lead to an
increase in the gross domestic product. Conversely, an increase in broad money will also lead to
an increase in the United States gross domestic product.
13. Conclusions and recommendations
The research has proved that consumer price index and broad money are all increasing factors of
gross domestic demand. On the other hand, the real interest rate was a decreasing factor for the
gross domestic product. Therefore, an upsurge in the real interest rate leads to a decline in gross
domestic demand while a deterioration in the real interest rate leads to an improvement in the
gross domestic demand.
Since low-interest rates and an increasing money supply causes inflation, policymakers in the
United States should ensure that the two are sustained so far to support the growth of the gross
domestic product. Anything in excess will result in an increase in the levels of price without
actually adding any economic value.
14. Future researchers
The research carried out ha proved all the assumption which the researcher had regarding the
factors which determine gross domestic product in the United States. However, more research
Factors affecting the GDP in the United States 18
needs to be carried out in order to improve the research. Future researchers can carry out
researchers which include more variables which were not included in the regression analysis.
Consequently, they should consider other countries and regions in order to ensure that the results
are similar across the globe.
Factors affecting the GDP in the United States 19
Reference
[1] U. Soytas and S. Ramazan. "Energy consumption and GDP: causality relationship in G-7
countries and emerging markets." Energy economics 25, no. 1, 2003: 33-37.
[2] S. V. Dunaway. Global imbalances and the financial crisis. No. 44. Council on Foreign Relations,
2009.
[3] F. Krausmann, G. Simone, E. Nina, E. Karl-Heinz, H. Helmut, and F. Marina. "Growth in global
materials use, GDP and population during the 20th century." Ecological Economics 68, no. 10,
2009: 2696-2705.
[4] W. E. Shafer, F. Kyoko, and M. L. Grace. "Values and the perceived importance of ethics and
social responsibility: The US versus China." Journal of Business Ethics 70, no. 3, 2007: 265-284.
[5] F. Canova, and G. Luca. "Structural changes in the US economy: Is there a role for monetary
policy?." Journal of Economic dynamics and control 33, no. 2, 2009: 477-490.
[6] A.B. Martin, L. David, W. Benjamin, C. Aaron, and National Health Expenditure Accounts Team.
"Growth in US health spending remained slow in 2010; health share of gross domestic product
was unchanged from 2009." Health Affairs 31, no. 1, 2012: 208-219.
[7] T. I. Garner, J. George, P. William, P. Laura, and V. Mark. "The Consumer Expenditure Survey in
comparison: focus on personal consumption expenditures." In Federal Economic Statistics
Advisory Committee Meeting, March, vol. 17. 2003.
[8] J. Warda. "Tax Treatment of Business Investments in Intellectual Assets." 2006.
[9] A. Raffo. "Net exports, consumption volatility and international business cycle models." Journal of
International Economics 75, no. 1, 2008: 14-29.
[10] Y. Konchitchki and N. P. Panos. "Accounting earnings and gross domestic product." Journal of
Accounting and Economics 57, no. 1, 2014: 76-88.
[11] K. Bolt, M. Mampite, and C. Michael. "Manual for calculating adjusted net savings." Environment
Department, World Bank, 2002: 1-23.
[12] O. H. Grytten. "The gross domestic product for Norway, 1830'2003." Norges Bank: Occasional
Papers 1, 2004: 241.
[13] D. Gollin. "Getting income shares right." Journal of political Economy 110, no. 2, 2002: 458-474.
[14] K. Chauhan. "Innovation and Development in Finnish Construction Industry." Industrial
Engineering and Management, 2016.
[15] J. Hausman. "Sources of bias and solutions to bias in the consumer price index." Journal of
Economic Perspectives 17, no. 1, 2003: 23-44.
[16] J. E Triplett. "Should the Cost‐of‐living Index Provide the Conceptual Framework for a Consumer
Price Index?." The Economic Journal 111, no. 472, 2001: 311-334.
[17] P. E. Greenberg, C. K. Ronald, G.B. Howard, A. L. Stephanie, W. L. Sarah, B. A. Patricia, and K.
C. Patricia. "The economic burden of depression in the United States: how did it change between
1990 and 2000?." Journal of clinical psychiatry 64, no. 12, 2003: 1465-1475.
[18] B. W. Hamilton. "Using Engel's Law to estimate CPI bias." American Economic Review 91, no. 3,
2001: 619-630.
Paraphrase This Document
Need a fresh take? Get an instant paraphrase of this document with our AI Paraphraser
Factors affecting the GDP in the United States 20
[19] D. E. Lebow and B. R. Jeremy. "Measurement error in the consumer price index: where do we
stand?." Journal of economic literature 41, no. 1, 2003: 159-201.
[20] J. C. Cox, , E. I. Jonathan, and A.R. Stephen. "A theory of the term structure of interest rates."
In Theory of Valuation, pp. 129-164. 2005.
[21] W. M. Blankenau, M. A. Kose, and K. Yi. "Can world real interest rates explain business cycles in
a small open economy?." Journal of Economic Dynamics and Control 25, no. 6-7 , 2001: 867-
889.
[22] P. Gabriel, and J. Sicilia. "Is the European Central Bank (and the United States Federal Reserve)
predictable?." 2002.
[23] N. Jean-Claude. A cointegration analysis of broad money demand in Cameroon. No. 1-26.
International Monetary Fund, 2001.
[24] T. Timo, and A. Eliasson. "Non‐linear error correction and the UK demand for broad money,
1878–1993." Journal of Applied Econometrics 16, no. 3, 2001: 277-288.
[25] J. Louis, and S.H. Williamson. "What was the US GDP then?." MeasuringWorth. Com, 2011.
[26] B. Jacob, J. Chen, Y. Huang, and I. Cohen. "Pearson correlation coefficient." In Noise reduction
in speech processing, pp. 1-4. Springer Berlin Heidelberg, 2009.
[27] L. D. Willia. "The real price of housing and money supply shocks: time series evidence and
theoretical simulations." Journal of Housing Economics 11, no. 1, 2002: 40-74.
[28] M. B. Anne, D. Lassman, B. Washington, A. Catlin, and National Health Expenditure Accounts
Team. "Growth in US health spending remained slow in 2010; health share of gross domestic
product was unchanged from 2009." Health Affairs 31, no. 1, 2012: 208-219.
[29] Statistics, Labor. "US Department of Labor." Dostępne w internecie: http://www. msha. gov.
Dostęp w dniu 10, 2014.
[30] M. B. Anne, D. Lassman, B. Washington, A. Catlin, and National Health Expenditure Accounts
Team. "Growth in US health spending remained slow in 2010; health share of gross domestic
product was unchanged from 2009." Health Affairs 31, no. 1, 2012: 208-219.
1 out of 20
Related Documents


Your All-in-One AI-Powered Toolkit for Academic Success.
+13062052269
info@desklib.com
Available 24*7 on WhatsApp / Email
![[object Object]](/_next/static/media/star-bottom.7253800d.svg)
Unlock your academic potential
© 2024 | Zucol Services PVT LTD | All rights reserved.