Price Elasticity of Demand and Impact of Trump’s Policies on Economy
VerifiedAdded on 2023/05/28
|11
|2793
|280
Essay
AI Summary
This essay provides a detailed analysis of price elasticity of demand, exploring factors such as the nature of a commodity, availability of substitutes, consumer income levels, seasonality, proportion of income allocated, and consumer habits. It further examines the potential benefits of President Trump's protectionist policies for the Australian economy, particularly in light of the trade war between the United States and China. The essay highlights how Australia has capitalized on tariffs imposed by both countries, increasing exports of coal, steel, agricultural products like wine and tree nuts, and other commodities. It suggests that continued trade tensions could further enhance Australia's export performance, especially in sectors where it competes directly with the United States.
Running Head: ECONOMICS 1
ECONOMICS
Student Name
Institutional Affiliation
Facilitator
Course
Date
ECONOMICS
Student Name
Institutional Affiliation
Facilitator
Course
Date
Paraphrase This Document
Need a fresh take? Get an instant paraphrase of this document with our AI Paraphraser
ECONOMICS 2
Question1
Price elasticity of demand generally refers to an economic measure which indicates the
extent to which the demand for a given commodity reacts to an alteration of the commodity’s
price (Anderson et al, 2012).
Factors determining price elasticity of demand
The price elasticity of demand is determined by various factors which include:
a. The nature of a commodity
The price elasticity of demand of a given commodity is determined by its nature. A
person may view a given commodity as either luxurious, a comfort or a necessity (Kemp, 2010).
Generally the demand for a luxurious commodity is more elastic than that of the necessities and
comforts. For example, a car is viewed as a luxury by many people. People have the alternative
of using public transport. If the price of cars rises, this may lead to a drastic change in their
demand as people boycott purchasing them to use public transport. If a commodity is viewed as a
comfort by the consumer for example a refrigerator, its demand is elastic. If the prices for such
commodities rise, then consumers may decide to postpone their consumption to sometime in
future. If a commodity is viewed as a necessity by the consumer, then its demand is obvious
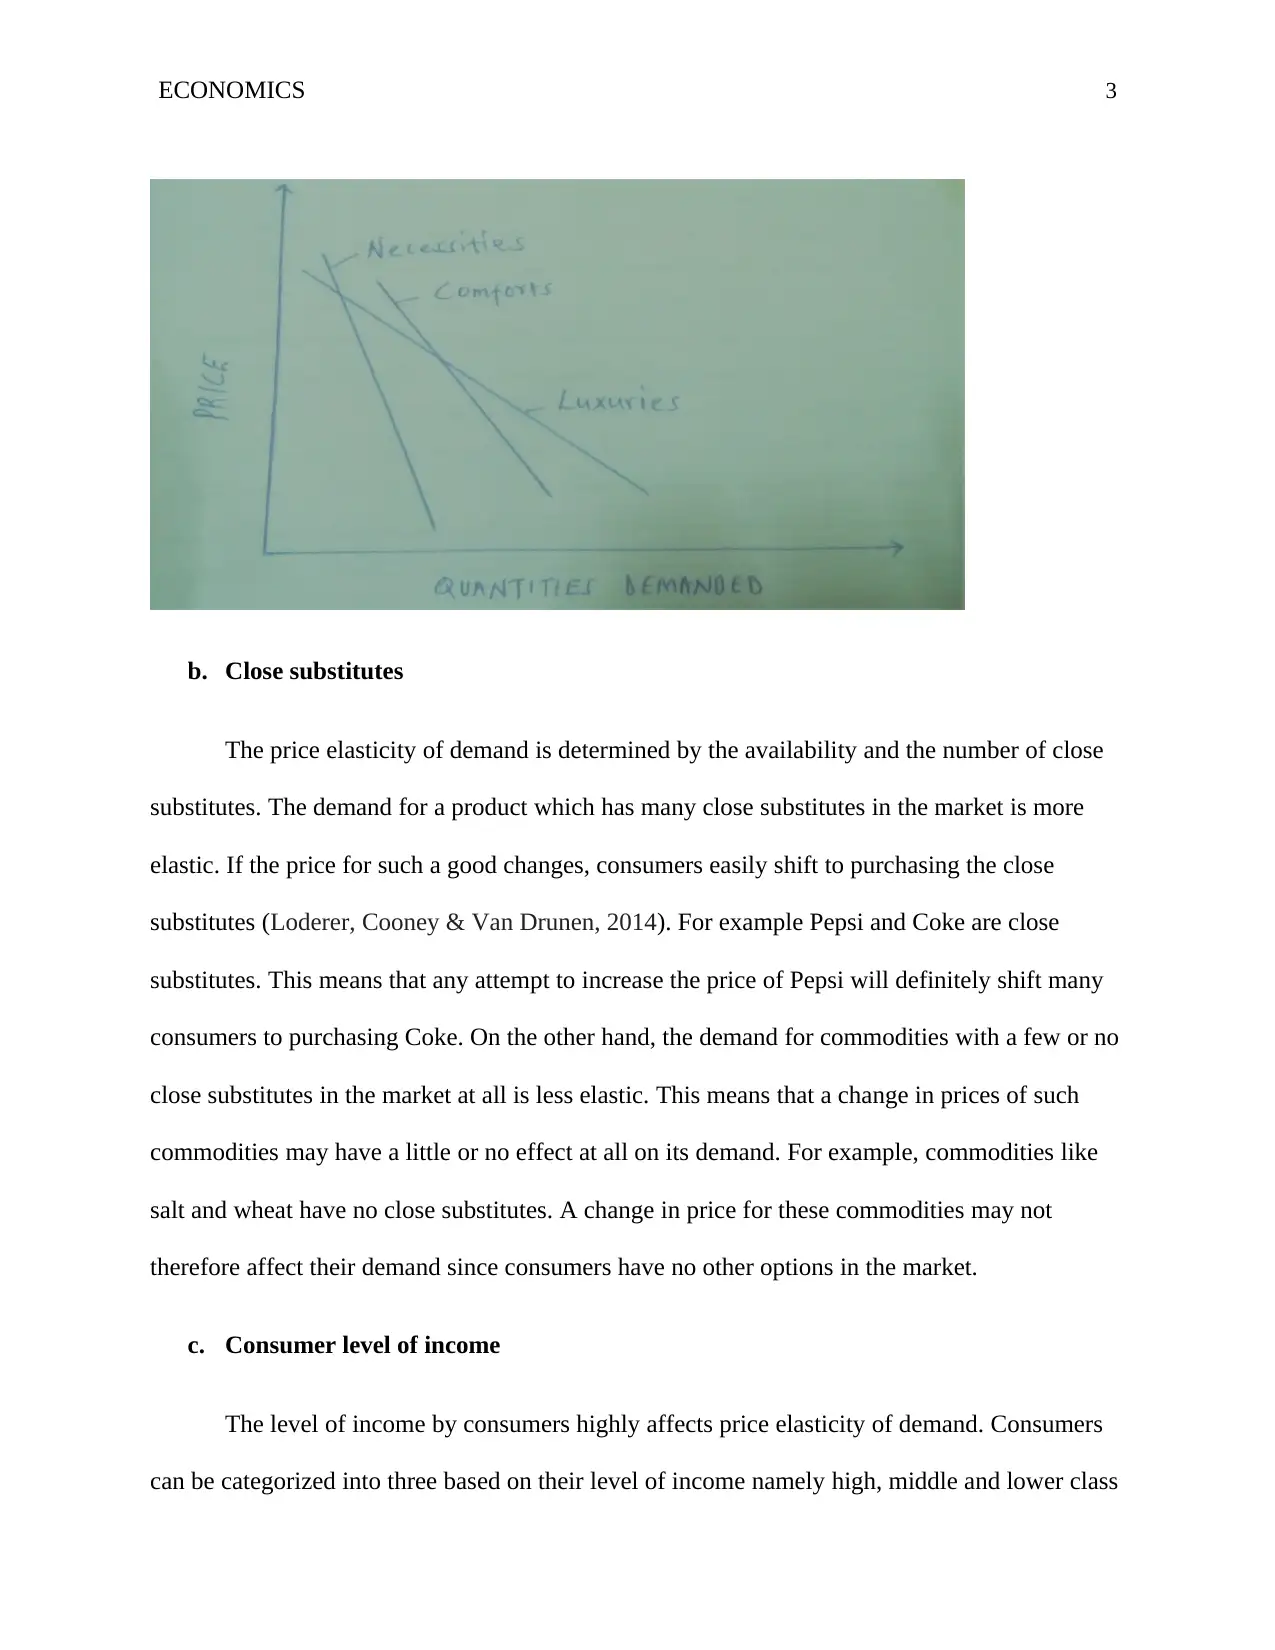
inelastic. An example is foods like vegetables and medicine. Necessities are generally required
for consumers to survive and no matter how much their prices change consumers must at long
last purchase them for their survival hence the change in prices for necessities has a little impact
on their demand. The demand curve for necessities is steeper whilst that of luxuries tends to be
more flat. The curves are shown below:
Question1
Price elasticity of demand generally refers to an economic measure which indicates the
extent to which the demand for a given commodity reacts to an alteration of the commodity’s
price (Anderson et al, 2012).
Factors determining price elasticity of demand
The price elasticity of demand is determined by various factors which include:
a. The nature of a commodity
The price elasticity of demand of a given commodity is determined by its nature. A
person may view a given commodity as either luxurious, a comfort or a necessity (Kemp, 2010).
Generally the demand for a luxurious commodity is more elastic than that of the necessities and
comforts. For example, a car is viewed as a luxury by many people. People have the alternative
of using public transport. If the price of cars rises, this may lead to a drastic change in their
demand as people boycott purchasing them to use public transport. If a commodity is viewed as a
comfort by the consumer for example a refrigerator, its demand is elastic. If the prices for such
commodities rise, then consumers may decide to postpone their consumption to sometime in
future. If a commodity is viewed as a necessity by the consumer, then its demand is obvious
inelastic. An example is foods like vegetables and medicine. Necessities are generally required
for consumers to survive and no matter how much their prices change consumers must at long
last purchase them for their survival hence the change in prices for necessities has a little impact
on their demand. The demand curve for necessities is steeper whilst that of luxuries tends to be
more flat. The curves are shown below:
ECONOMICS 3
b. Close substitutes
The price elasticity of demand is determined by the availability and the number of close
substitutes. The demand for a product which has many close substitutes in the market is more
elastic. If the price for such a good changes, consumers easily shift to purchasing the close
substitutes (Loderer, Cooney & Van Drunen, 2014). For example Pepsi and Coke are close
substitutes. This means that any attempt to increase the price of Pepsi will definitely shift many
consumers to purchasing Coke. On the other hand, the demand for commodities with a few or no
close substitutes in the market at all is less elastic. This means that a change in prices of such
commodities may have a little or no effect at all on its demand. For example, commodities like
salt and wheat have no close substitutes. A change in price for these commodities may not
therefore affect their demand since consumers have no other options in the market.
c. Consumer level of income
The level of income by consumers highly affects price elasticity of demand. Consumers
can be categorized into three based on their level of income namely high, middle and lower class
⊘ This is a preview!⊘
Do you want full access?
Subscribe today to unlock all pages.
Trusted by 1+ million students worldwide
ECONOMICS 4
(Lancaster, 2013). Consumers with higher levels of income have an inelastic demand. This is due
to the fact that wealth people do not consider price of commodities that much as money is
adequate for all their needs. Middle consumers with medium level of income have elastic
demand as they can postpone their consumption to sometimes in future. Consumers with lower
level of income have more elastic demand as the price increase of commodities of interest makes
them unaffordable. This means that such consumers end up not purchasing the commodities at
the higher prices as they have little or no money at all to spend.
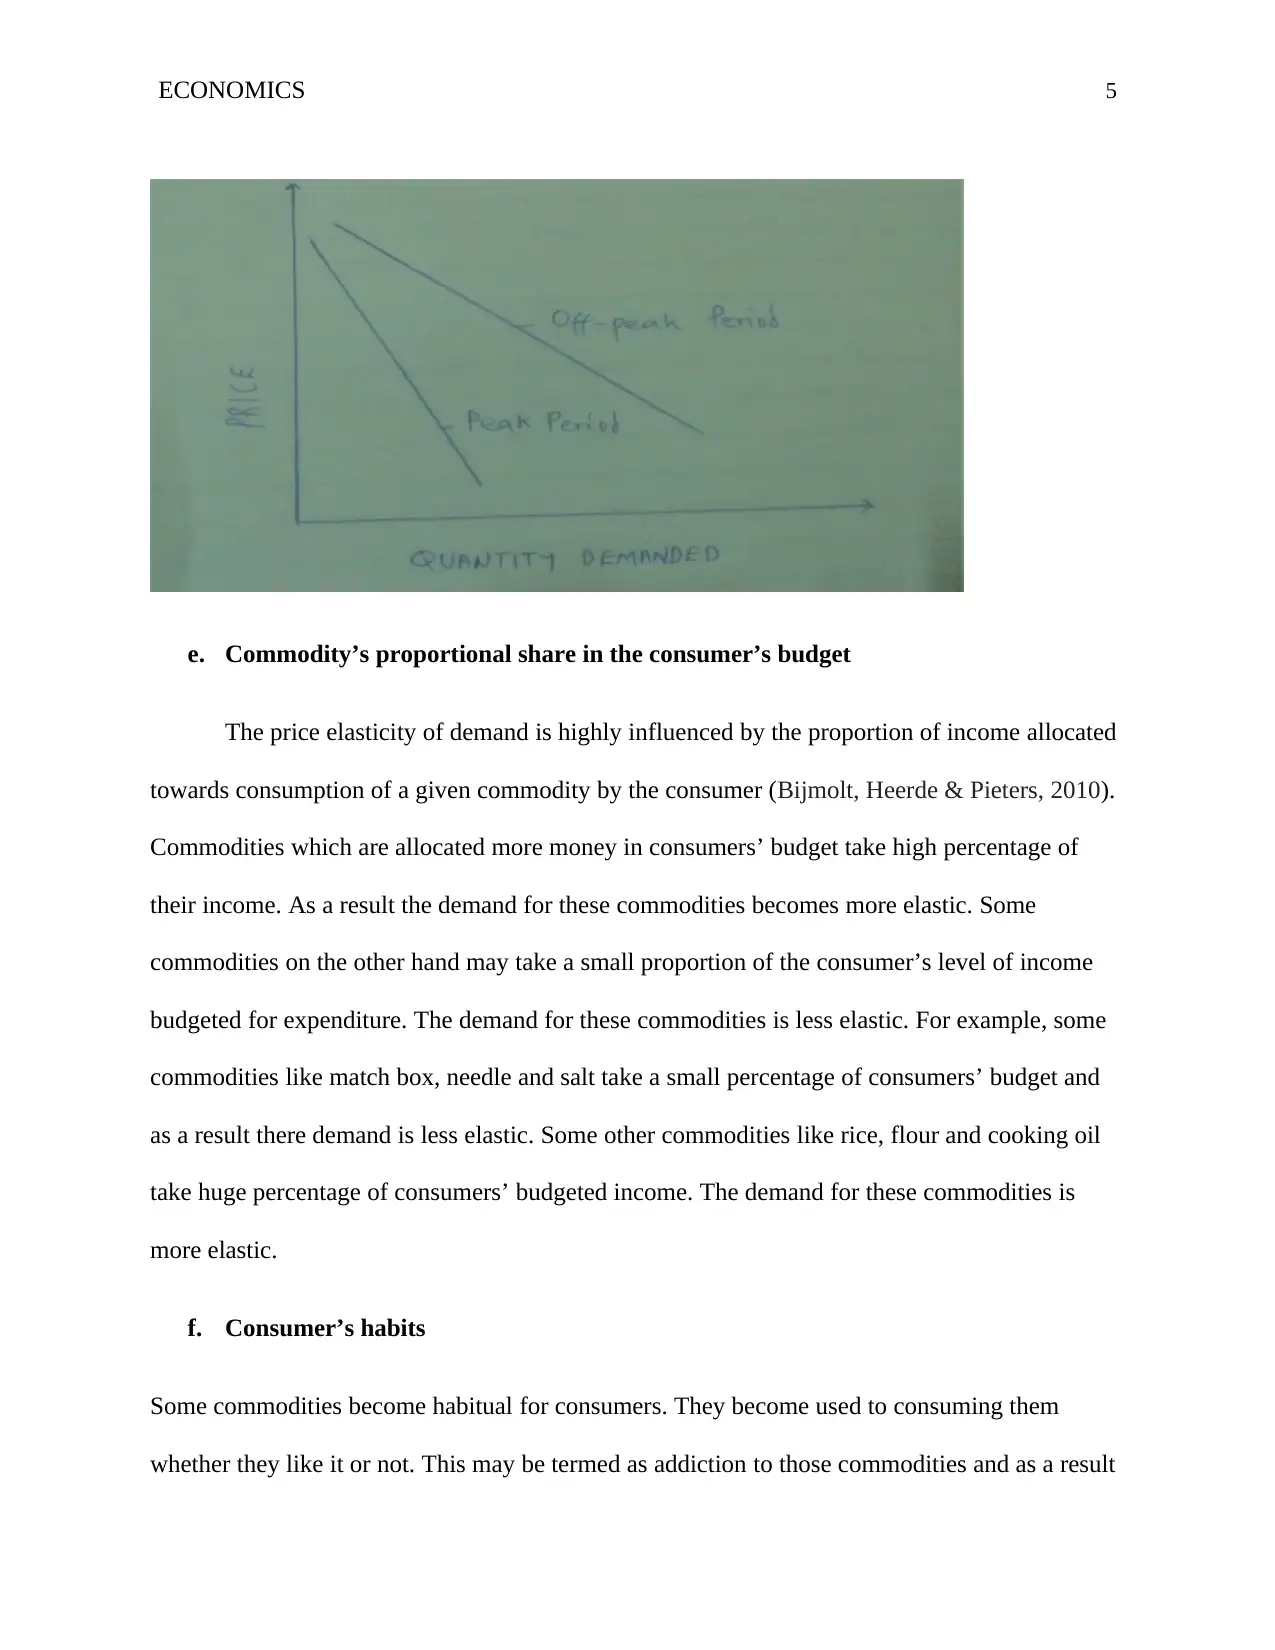
d. Seasonality
Seasonality in consumption brings about the issue of peak and off-peak periods. Peak
period occurs when the time for high consumption of a given commodity comes. Generally for
those commodities which undergo seasonality in their consumption, their demand will be
inelastic during the peak periods and more elastic during the off-peak periods. For example,
considering products like umbrellas and gum boots, their consumption is always high during the
rainy season. Much of their need is felt during the rainy season and consumers tend to purchase
them more irrespective of their price of their price changes. During the rainy period the demand
for these commodities will therefore be inelastic. During the summer period, the demand for
these commodities becomes more elastic as they are not highly needed. This is the off-peak
period and any price increase change may drastically reduce the demand for these commodities
as consumers may opt to survive without them. The demand curve during the peak period is
steeper while that of the off-peak period is a bit flat as shown below:
(Lancaster, 2013). Consumers with higher levels of income have an inelastic demand. This is due
to the fact that wealth people do not consider price of commodities that much as money is
adequate for all their needs. Middle consumers with medium level of income have elastic
demand as they can postpone their consumption to sometimes in future. Consumers with lower
level of income have more elastic demand as the price increase of commodities of interest makes
them unaffordable. This means that such consumers end up not purchasing the commodities at
the higher prices as they have little or no money at all to spend.
d. Seasonality
Seasonality in consumption brings about the issue of peak and off-peak periods. Peak
period occurs when the time for high consumption of a given commodity comes. Generally for
those commodities which undergo seasonality in their consumption, their demand will be
inelastic during the peak periods and more elastic during the off-peak periods. For example,
considering products like umbrellas and gum boots, their consumption is always high during the
rainy season. Much of their need is felt during the rainy season and consumers tend to purchase
them more irrespective of their price of their price changes. During the rainy period the demand
for these commodities will therefore be inelastic. During the summer period, the demand for
these commodities becomes more elastic as they are not highly needed. This is the off-peak
period and any price increase change may drastically reduce the demand for these commodities
as consumers may opt to survive without them. The demand curve during the peak period is
steeper while that of the off-peak period is a bit flat as shown below:
Paraphrase This Document
Need a fresh take? Get an instant paraphrase of this document with our AI Paraphraser
ECONOMICS 5
e. Commodity’s proportional share in the consumer’s budget
The price elasticity of demand is highly influenced by the proportion of income allocated
towards consumption of a given commodity by the consumer (Bijmolt, Heerde & Pieters, 2010).
Commodities which are allocated more money in consumers’ budget take high percentage of
their income. As a result the demand for these commodities becomes more elastic. Some
commodities on the other hand may take a small proportion of the consumer’s level of income
budgeted for expenditure. The demand for these commodities is less elastic. For example, some
commodities like match box, needle and salt take a small percentage of consumers’ budget and
as a result there demand is less elastic. Some other commodities like rice, flour and cooking oil
take huge percentage of consumers’ budgeted income. The demand for these commodities is
more elastic.
f. Consumer’s habits
Some commodities become habitual for consumers. They become used to consuming them
whether they like it or not. This may be termed as addiction to those commodities and as a result
ECONOMICS 6
they become necessities. This means that consumers can’t do without them and any stoppage of
their use requires time. The demand for such commodities becomes less elastic as consumers
must purchase them irrespective of their price change in order to satisfy their needs. A good
example of these commodities is cigarettes, alcohol and tobacco. In many countries the prices of
these commodities have been increased in order to discourage their consumption. Despite the
price increase, consumers continue consuming them. This is an indication that most of
consumers of these commodities have been addicted to using them and even if their prices are
increased they will still consume them. The demand for habitual commodities is therefore less
elastic.
In a nutshell, the price elasticity of demand of a given commodity is influenced by various
factors. The factors which influence the price elasticity of demand of a given commodity depend
on the market conditions at a given period of time.
Question2
Will the Australian economy benefit from President Trump's protectionist policies?
Introduction
Australia is among the richest nations in the Asia-Pacific region. It has been doing well in
terms of economic currently having an economic growth rate of 2.5 percent which is measured in
terms of the growth of the gross domestic product (Bryan & Rafferty, 2011). It has been ranked
position 4 out of the 43 nations in the Asia-Pacific region. Australia also embraces a free
economy where almost all its industries are open to competition. According to the 2018 index,
Australia has been ranked position 5 in terms of economic freedom with a score of 80.9. The
⊘ This is a preview!⊘
Do you want full access?
Subscribe today to unlock all pages.
Trusted by 1+ million students worldwide
ECONOMICS 7
overall economic performance of Australia is above the expected averages both at the region and
world levels.
Discussion
Australia embraces international trade and participates much in the export market. It
usually exports goods and services for which it has comparative advantage in producing. These
commodities are mainly agricultural products and minerals (Krause, 2014). They include gold,
iron ore, petroleum gases, wheat, fruits, sheep and goat meat, meslin and bovine among others.
The total exports for Australia exceed $200 billion. Its main exporters include China with 31.6
percent, Japan 13.9 percent, European Union 7.5 percent, South Korea 6.7 percent, United States
4.6 percent and others occupy 35.6 percent.
President Donald Trump’s protectionist policies will highly benefit Australia. The
protectionist policies implemented by President Donald Trump brought about trade war between
many nations the major ones being China and the European Union. The protectionist policies are
mainly in form of tariffs on certain targeted products from certain targeted nations. Australia
majorly benefits from the trade war between the two world biggest economies of the United
States and China.
President Donald Trump imposed tariffs on Chinese and other nations such as European
Region and Canada steel and aluminum of 25 percent and 10 percent respectively on May 2018.
Trump also imposed tariffs on Chinese cutting edge goods of more than $70 billion. Trump
imposed tariffs on the Chinese products claiming that Beijing heavily subsidized the production
of Chinese products such as Steel and Aluminum and this threatened the United States domestic
industries as these products were as if they were being dumped in United States (Shirk, 2017).
Paraphrase This Document
Need a fresh take? Get an instant paraphrase of this document with our AI Paraphraser
ECONOMICS 8
Australia was not targeted on the steel and aluminum tariffs. This is due to the fact the United
States has a surplus in terms of trade with Australia and may not target it anytime soon as most
of its exports to the United States are protected by the Free Trade Agreement between these two
nations. China highly imports coal to produce steel. Most of the imported coal comes from the
United States. Due to the trade war between these two nations, Australia has benefited much by
exporting much of its coal to China. It has also benefited much by exporting much of its steel to
the United States. This has led to improvement of the export sector of Australia.
Due to President Donald Trump’s imposed tariffs on the Chinese steel and aluminum,
China retaliated and imposed 25 percent tariffs on 128 agricultural products from the United
States. Some of these agricultural products include meat, fruits, soybeans and wines. As a result
of these tariffs, the Australian agricultural sector improved and has been improving in terms of
export performance (Brewewer, 2017). The imposed tariffs have led to a decline in the United
States wine exports to China. On the other hand, the Australian wine exports to China have
improved to 63 percent to $848 billion. According to the CNBC, Australia topped the wine
exports in the year 2017 as a result of the retaliatory China’s tariffs of the United States
agricultural products.
Australia is a stronger competitor to the United States in terms of agricultural products in
the export market. This is due to the fact that it has improved agricultural research and
development capabilities. Its agricultural systems of production are supported by its agronomy
capabilities and its agricultural science which is of a world-class level. Due to this, Australia
competes much with the United States in exporting fruits to China. Due to the imposed tariffs on
the United States agricultural products by China, the United States fruit exports to China decline
ECONOMICS 9
while those of Australia and Chile improved. By the end of 2017, more than 40 percent of the
Australian fruit exports were sold to China (Schandl & West, 2016). This shows that further
trade war between China and the United States will highly benefit Australia.
The Australian tree nut exports have also increased from the Trump’s protectionist
policies and the same trend is expected if the trade war is maintained. The Australian tree nut
exports have been increasing from the year 2011 to 2016. Estimates from the Australian Bureau
of Statistics show that the tree nuts exports especially to China have increased from $6 million to
$63 million from the year 2011 to 2016 respectively. With the Trump’s protectionist policies, the
Australian bureau of statistics has predicted a further increase in the tree nuts exports especially
to China to increase to $1 billion.
The retaliatory Chinese tariffs on the United States products have led to a decline in the
scrap aluminum which was being imported by China and melted in its furnaces to make
aluminum. This has seen the exports of waste materials from Australia to China increase. China
is the biggest trader of waste materials for Australia. According to the Australian Bureau of
Statistics, waste materials trade between Australia and China accounts for more than $602
million which is more than 31 percent of Australian waste materials (Kelly, 2014). This therefore
indicates that with the Trump protectionist policies, Australia stands a chance to expand its waste
materials exports not only to China but also to other nations such as the Europe Union and
Canada.
Conclusion
In a nutshell, Australia stands a chance to benefit much from the Trump’s protectionist
policies. Much of the benefits have of the benefits have already been noted as Australia has been
⊘ This is a preview!⊘
Do you want full access?
Subscribe today to unlock all pages.
Trusted by 1+ million students worldwide
ECONOMICS 10
benefiting much from the trade war between the United States and China. The Australian
agricultural sector has improved much from the Chinese retaliatory tariffs on the United States
agricultural products. It has increased many of its agricultural exports to china such as fruits and
wine. Its waste material and coal exports have also increased. To sum up, Australia stands to
benefit from Trump’s protectionist policies.
References
Anderson, P. L., McLellan, R. D., Overton, J. P., & Wolfram, G. L. (2012). Price elasticity of
demand. McKinac Center for Public Policy. Accessed October, 13, 2010.
Bijmolt, T. H., Heerde, H. J. V., & Pieters, R. G. (2010). New empirical generalizations on the
determinants of price elasticity. Journal of marketing research, 42(2), 141-156.
Brewewer, P. (2017). Psychic distance and Australian export market selection. Australian
Journal of Management, 32(1), 73-94.
Bryan, D., & Rafferty, M. (2011). The Global Economy in Australia: Global integration and
national economic policy. Allen & Unwin.
Lancaster, K. J. (2013). A new approach to consumer theory. Journal of political
economy, 74(2), 132-157.
Loderer, C., Cooney, J. W., & Van Drunen, L. D. (2014). The price elasticity of demand for
common stock. The Journal of Finance, 46(2), 621-651.
Kelly, G. (2014). Chinese rebalancing and Australian exports. Reserve Bank of Australia Bulletin
December Quarter, 2014, 23-29.
Paraphrase This Document
Need a fresh take? Get an instant paraphrase of this document with our AI Paraphraser
ECONOMICS 11
Kemp, S. (2010). Perceiving luxury and necessity. Journal of Economic Psychology, 19(5), 591-
606. Patrick, S. M. (2017). Trump and World Order: The Return of Self-Help. Foreign
Aff., 96, 52.
Krause, L. B. (2014). Australia's comparative advantage in international trade. The Australian
Economy: A View from the North, 275-311.
Schandl, H., & West, J. (2016). Material flows and material productivity in China, Australia, and
Japan. Journal of Industrial Ecology, 16(3), 352-364.
Shirk, S. (2017). Trump and China: Getting to Yes with Beijing. Foreign Aff., 96, 20.
1 out of 11
Related Documents


Your All-in-One AI-Powered Toolkit for Academic Success.
+13062052269
info@desklib.com
Available 24*7 on WhatsApp / Email
![[object Object]](/_next/static/media/star-bottom.7253800d.svg)
Unlock your academic potential
Copyright © 2020–2026 A2Z Services. All Rights Reserved. Developed and managed by ZUCOL.