Research Report: Factors Influencing Employee Engagement in HRM
VerifiedAdded on 2021/02/21
|26
|3464
|252
Report
AI Summary
This research report, conducted as part of a postgraduate HRM program, investigates the factors influencing employee engagement. The study employs an explanatory, qualitative, and descriptive research design, utilizing a cross-sectional survey with a questionnaire distributed online to 60 employees across various sectors. The questionnaire assessed variables such as teamwork, innovation, company management, and development opportunities. Data analysis involved descriptive statistics, correlation analysis, and regression using SPSS. The findings reveal significant positive correlations between teamwork, supervisory support, job satisfaction, and organizational commitment with employee engagement, while innovation showed a negative correlation. The research also explores gender differences and the impact of age and experience on employee engagement, offering recommendations for organizations to enhance employee engagement. The report includes detailed methodologies, data analysis, and statistical results, along with appendices containing the survey questionnaire and correlation tables. The research aims to provide insights into how organizations can foster a culture of higher employee engagement, leading to increased productivity and employee satisfaction.
POSTGRADUATE RESEARCH METHODOLOGY FOR HRM
7BSP1298-0901-2018
7BSP1298-0901-2018
Paraphrase This Document
Need a fresh take? Get an instant paraphrase of this document with our AI Paraphraser
Table of Contents
Abstract............................................................................................................................................4
INTRODUCTION...........................................................................................................................5
Research Objectives....................................................................................................................5
Research Questions.....................................................................................................................5
Research Hypothesis...................................................................................................................5
LITERATURE REVIEW ...............................................................................................................6
RESEARCH METHODOLOGY.....................................................................................................7
Research Design..........................................................................................................................7
Data Collection............................................................................................................................7
Participants..................................................................................................................................7
Resources and Instruments..........................................................................................................8
Procedure.....................................................................................................................................8
Qualitative method .....................................................................................................................8
DATA ANALYSIS AND FINDINGS ...........................................................................................9
Descriptive Statistics...................................................................................................................9
Correlation Analysis....................................................................................................................9
Team Work...........................................................................................................................12
Innovation.............................................................................................................................12
Supervisory Support.............................................................................................................12
Job Satisfaction.....................................................................................................................13
Organisation Commitment...................................................................................................13
Gender Differences...............................................................................................................13
Employee Engagement and Experience...............................................................................14
Employee Engagement and Age..........................................................................................15
Recommendations to Organisation................................................................................................16
References......................................................................................................................................17
Appendices.....................................................................................................................................18
Appendix 1: Survey Questionnaire...........................................................................................18
Appendix 2: Pearson Correlation..............................................................................................22

⊘ This is a preview!⊘
Do you want full access?
Subscribe today to unlock all pages.
Trusted by 1+ million students worldwide
Abstract
This research paper aims to examine the impact of various pre-identified factors from the
literature on employee engagement. A survey questionnaire was designed to assess the relation
of variables with employee engagement. The independent variables in this research include
teamwork, innovation, company management and development opportunities. The research
design is explanatory, qualitative and descriptive. The cross-sectional survey was used where the
questionnaire was sent using an online questionnaire. The questionnaire measured responses
using the Likert scale and consists of 5 questions which were further divided into 5 subsections
having 21 items to measure the variables influencing employee engagement. The 60
questionnaires were distributed online to the employees from various sectors. The data collected
were descriptively analysed and then correlation and regression were performed using the SPSS
analytical tool. The research revealed that these three variables have a significant effect on
employee engagement and are positively correlated.
Paraphrase This Document
Need a fresh take? Get an instant paraphrase of this document with our AI Paraphraser
INTRODUCTION
Employee engagement is considered an essential factor that leads to greater productivity,
quality of service, innovation and more employee satisfaction. Due to its multiple benefits, this is
considered as key priorities of the business resulting in more researches (Shuck and Wollard,
2010). There is a need for identifying various factors that help in increasing the employee
engagement so that business can create a culture of higher employee engagement.
Research Objectives
To analyse the impact of organisation teamwork on the employee engagement.
To analyse the effect of an organisation’s management on the engagement of employees.
The effect of the employee development on employee engagement.
Research Questions
The relationship between teamwork and employee engagement
The relationship between employee engagement and the organisation's management.
The relationship between employee development and employee engagement.
The relationship between innovation and employee engagement.
Research Hypothesis
H1= it is hypothesised that the organisations with more teamwork have higher employee
engagement.
H2= it is hypothesised that organisation with more supervisory support have higher
employee engagement.
H3= it is hypothesised that organisation with more innovation acceptance have higher
employee engagement.
H4: Significant difference between gender for employee engagement.
H5: there is significant difference in the employee engagement and age.
H6: there is significant difference in the employee engagement due to experience of the
employee.
LITERATURE REVIEW
There is an increase in the research on employee engagement and its antecedents and
precedents. Where many researchers focusing on the improvement in employee engagement
there was plenty of research which assesses the consequences of increased employee
engagement. Nailing the Evidence report on the engagement for success determined that greater
engagement leads to more innovation, less absenteeism and greater employee retention. The
study focused on the employees within the UK was conducted using the survey method where
the questionnaires were administered to the UK companies’ employees (Albrech, 2011). The
research suggested a high correlation between organisational productivity and employee
engagement. Further in some organisation where there was disengagement the productivity was
less. The method for data analysis was regression using statistical software (MacLeod and
Clarke, 2009).
Human resource society of the US also conducted research on the employee engagement
with a sample size of 600 employees. They assessed around 30 aspects of the organisation
engagement and 40 aspects of job satisfaction (Luthans and Peterson, 2002). Further concluded
the overall research into key essential areas; work environment, employee relations,
compensation, engagement behaviours, benefits and engagement opinions. The research
efficiently identified satisfaction and engagement causes, however, the outcomes associated both
were neglected.
⊘ This is a preview!⊘
Do you want full access?
Subscribe today to unlock all pages.
Trusted by 1+ million students worldwide
RESEARCH METHODOLOGY
Research Design
This study used a mixture of the descriptive and statistical approach to measure the
correlation between selected variables. The descriptive approach using a conceptual framework
will help to define the hypothesis and correlations using theoretical frameworks (Saks, 2006).
The statistical analysis will help in analysing the primary collected data using questionnaire
where the responses of the subjects will be measured against three independent variables using
correlation and regression analysis.
Data Collection
A quantitative method for data collection is used in this research. The selected method
that surveys will maximise the reliability, objectivity and will help in prediction (Harter, et.al.,
2002). This test avoids and human perceptions and biases because of the use of the quantitative
method. In addition to this, there will be statistical analyses which will increase the research
validity and reliability because the results will be numerical, objectives and easily measurable.
Further, the predictivity of the research will also be an advantage because of the numerical
results (Gruman and Saks, 2011). The questionnaire was administered online which decreased
the cost and increased the accessibility.
Participants
The sample size was selected using random sampling techniques within the public and
private sector of the UK business, where the employees were contacted based on university,
personal and social reference. Total numbers of a questionnaire sent were 60 where the received
questionnaire was 50. The sample characteristics include a mixed population and the number of
male and female was equal that is 24 female and 26 males. The surveyed individuals had 0 to 13
Paraphrase This Document
Need a fresh take? Get an instant paraphrase of this document with our AI Paraphraser
year of experience where around 40% have 1- 3 year of experience, 20% with 4-8 years and 20%
with 0-1 year and 10% with 13 years of experience.
The average age of the participants was 60% between 26-35, 20% between 18-25 and
remaining 10% between 36 to 45 and 44 to 55.
Resources and Instruments
Resources include questionnaires, internet, statistical software and access to sampling
participants. The survey includes 21 items. The first section measured the experience and
demographics of the sample. The second section included 5 questions on the Likert scale which
measured the innovation and reward for new ideas. The third section included the questions
related to organisation management and the fourth section included questions related to
employee development. The last section tried to measure the teamwork within the organisation.
A Likert scale developed by Rensis Likert which is a psychometric scale used mostly in the
questionnaire where the responses are measured on a scale (Macey and Schneider, 2008).
Procedure
The procedure for conducting the survey include the online questionnaire which was sent
to the employees using the email link. Firstly, the email contact was received through personal
and social reference, after that each employee was contacted if they are willing to give a
response. Than the questionnaires were sent and on another day the remainder was left. The total
150 questionnaires were sent through this and 128 were received.
Qualitative method
The qualitative method uses the opinions and thoughts of the respondents while
conducting the research. It is exploratory research which uses the non- numerical data for the
conducting the research. It uses the thoughts and opinions of the authors and information
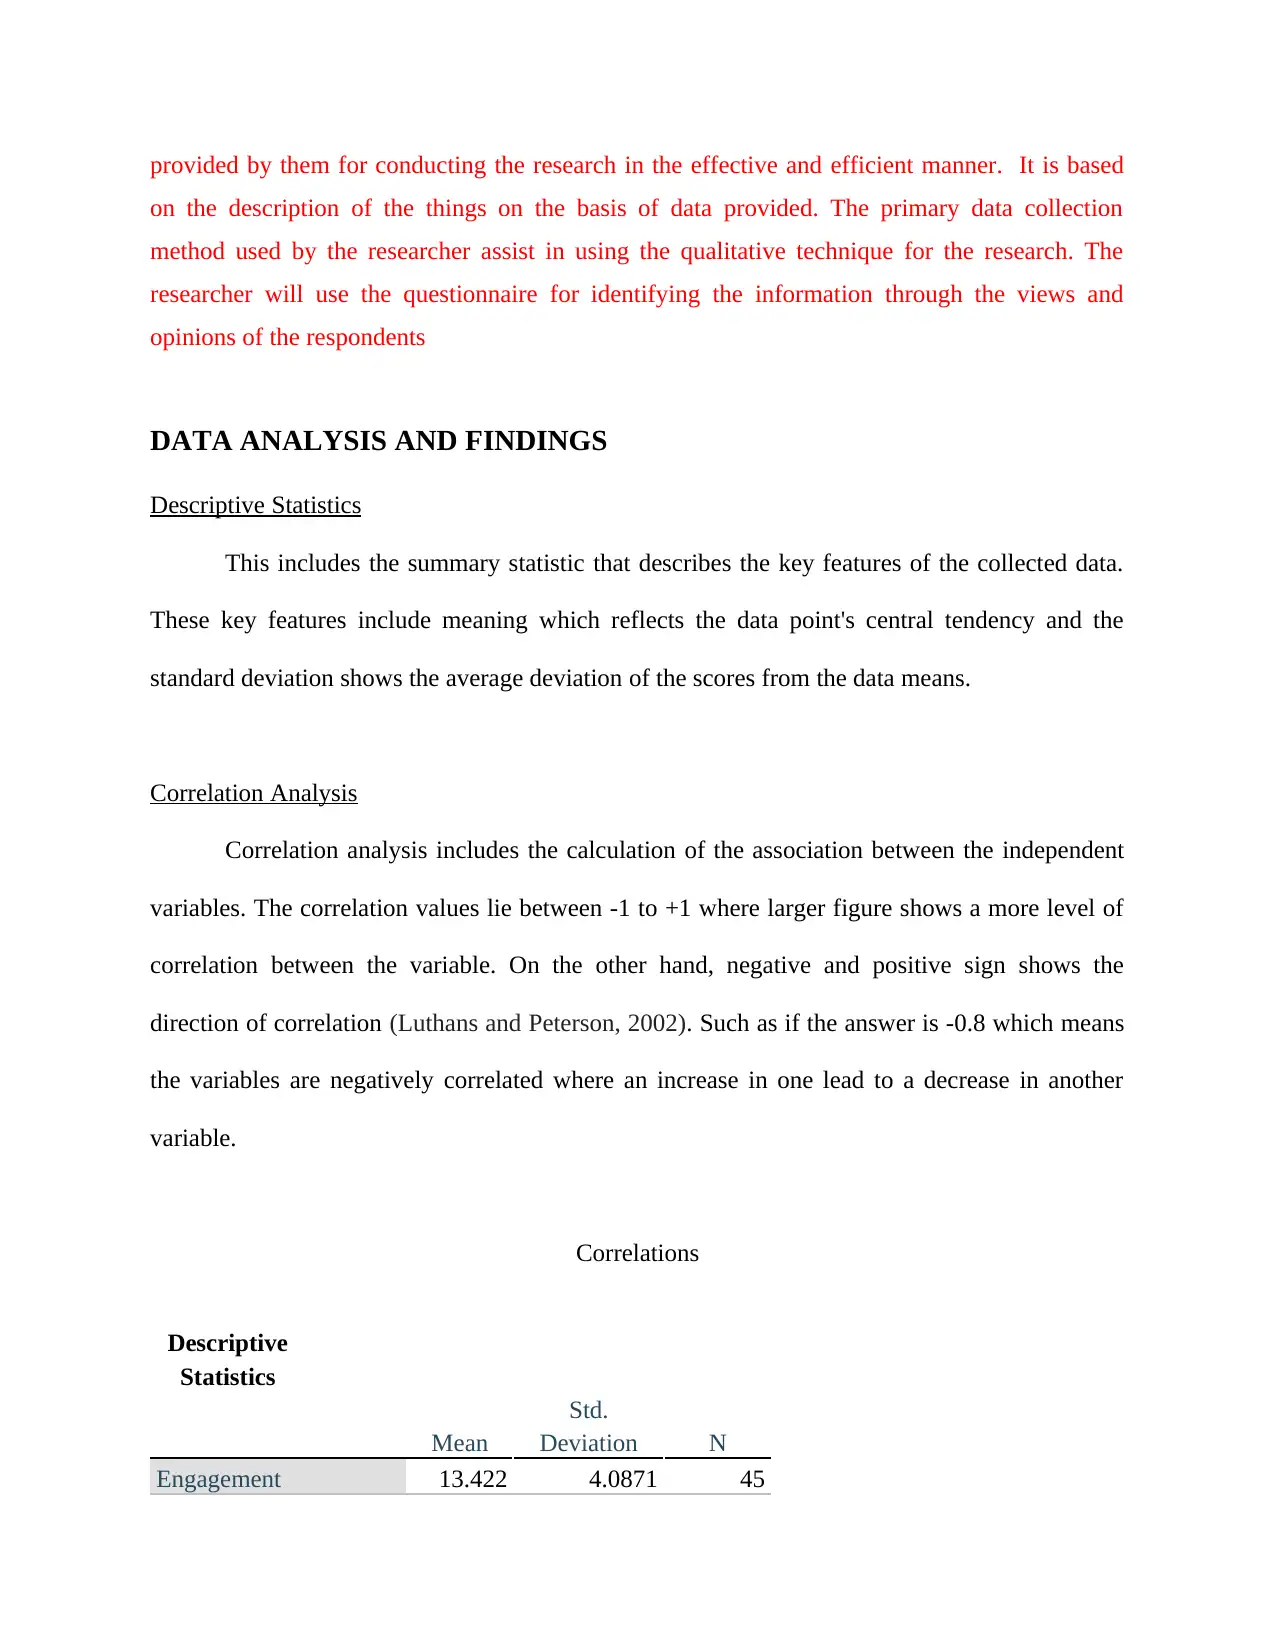
provided by them for conducting the research in the effective and efficient manner. It is based
on the description of the things on the basis of data provided. The primary data collection
method used by the researcher assist in using the qualitative technique for the research. The
researcher will use the questionnaire for identifying the information through the views and
opinions of the respondents
DATA ANALYSIS AND FINDINGS
Descriptive Statistics
This includes the summary statistic that describes the key features of the collected data.
These key features include meaning which reflects the data point's central tendency and the
standard deviation shows the average deviation of the scores from the data means.
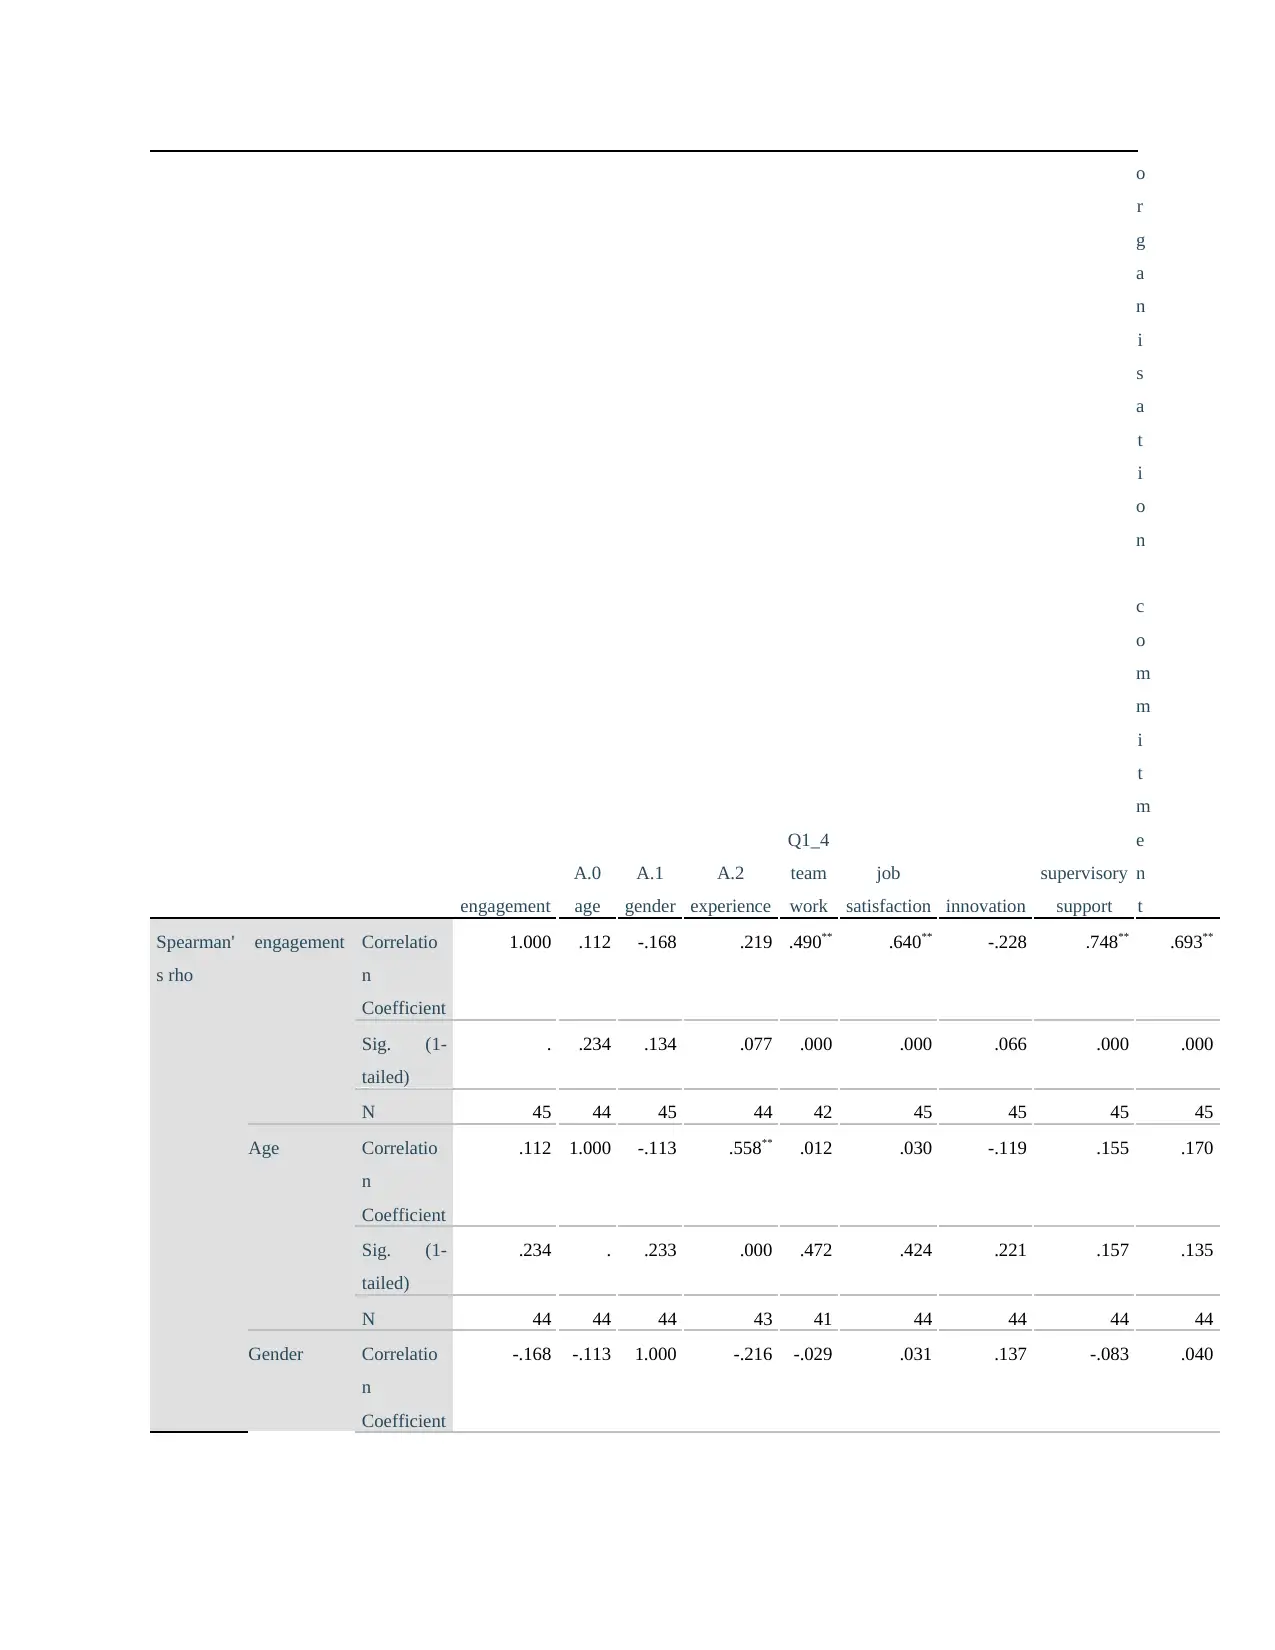
Correlation Analysis
Correlation analysis includes the calculation of the association between the independent
variables. The correlation values lie between -1 to +1 where larger figure shows a more level of
correlation between the variable. On the other hand, negative and positive sign shows the
direction of correlation (Luthans and Peterson, 2002). Such as if the answer is -0.8 which means
the variables are negatively correlated where an increase in one lead to a decrease in another
variable.
Correlations
Descriptive
Statistics
Mean
Std.
Deviation N
Engagement 13.422 4.0871 45
on the description of the things on the basis of data provided. The primary data collection
method used by the researcher assist in using the qualitative technique for the research. The
researcher will use the questionnaire for identifying the information through the views and
opinions of the respondents
DATA ANALYSIS AND FINDINGS
Descriptive Statistics
This includes the summary statistic that describes the key features of the collected data.
These key features include meaning which reflects the data point's central tendency and the
standard deviation shows the average deviation of the scores from the data means.
Correlation Analysis
Correlation analysis includes the calculation of the association between the independent
variables. The correlation values lie between -1 to +1 where larger figure shows a more level of
correlation between the variable. On the other hand, negative and positive sign shows the
direction of correlation (Luthans and Peterson, 2002). Such as if the answer is -0.8 which means
the variables are negatively correlated where an increase in one lead to a decrease in another
variable.
Correlations
Descriptive
Statistics
Mean
Std.
Deviation N
Engagement 13.422 4.0871 45
⊘ This is a preview!⊘
Do you want full access?
Subscribe today to unlock all pages.
Trusted by 1+ million students worldwide
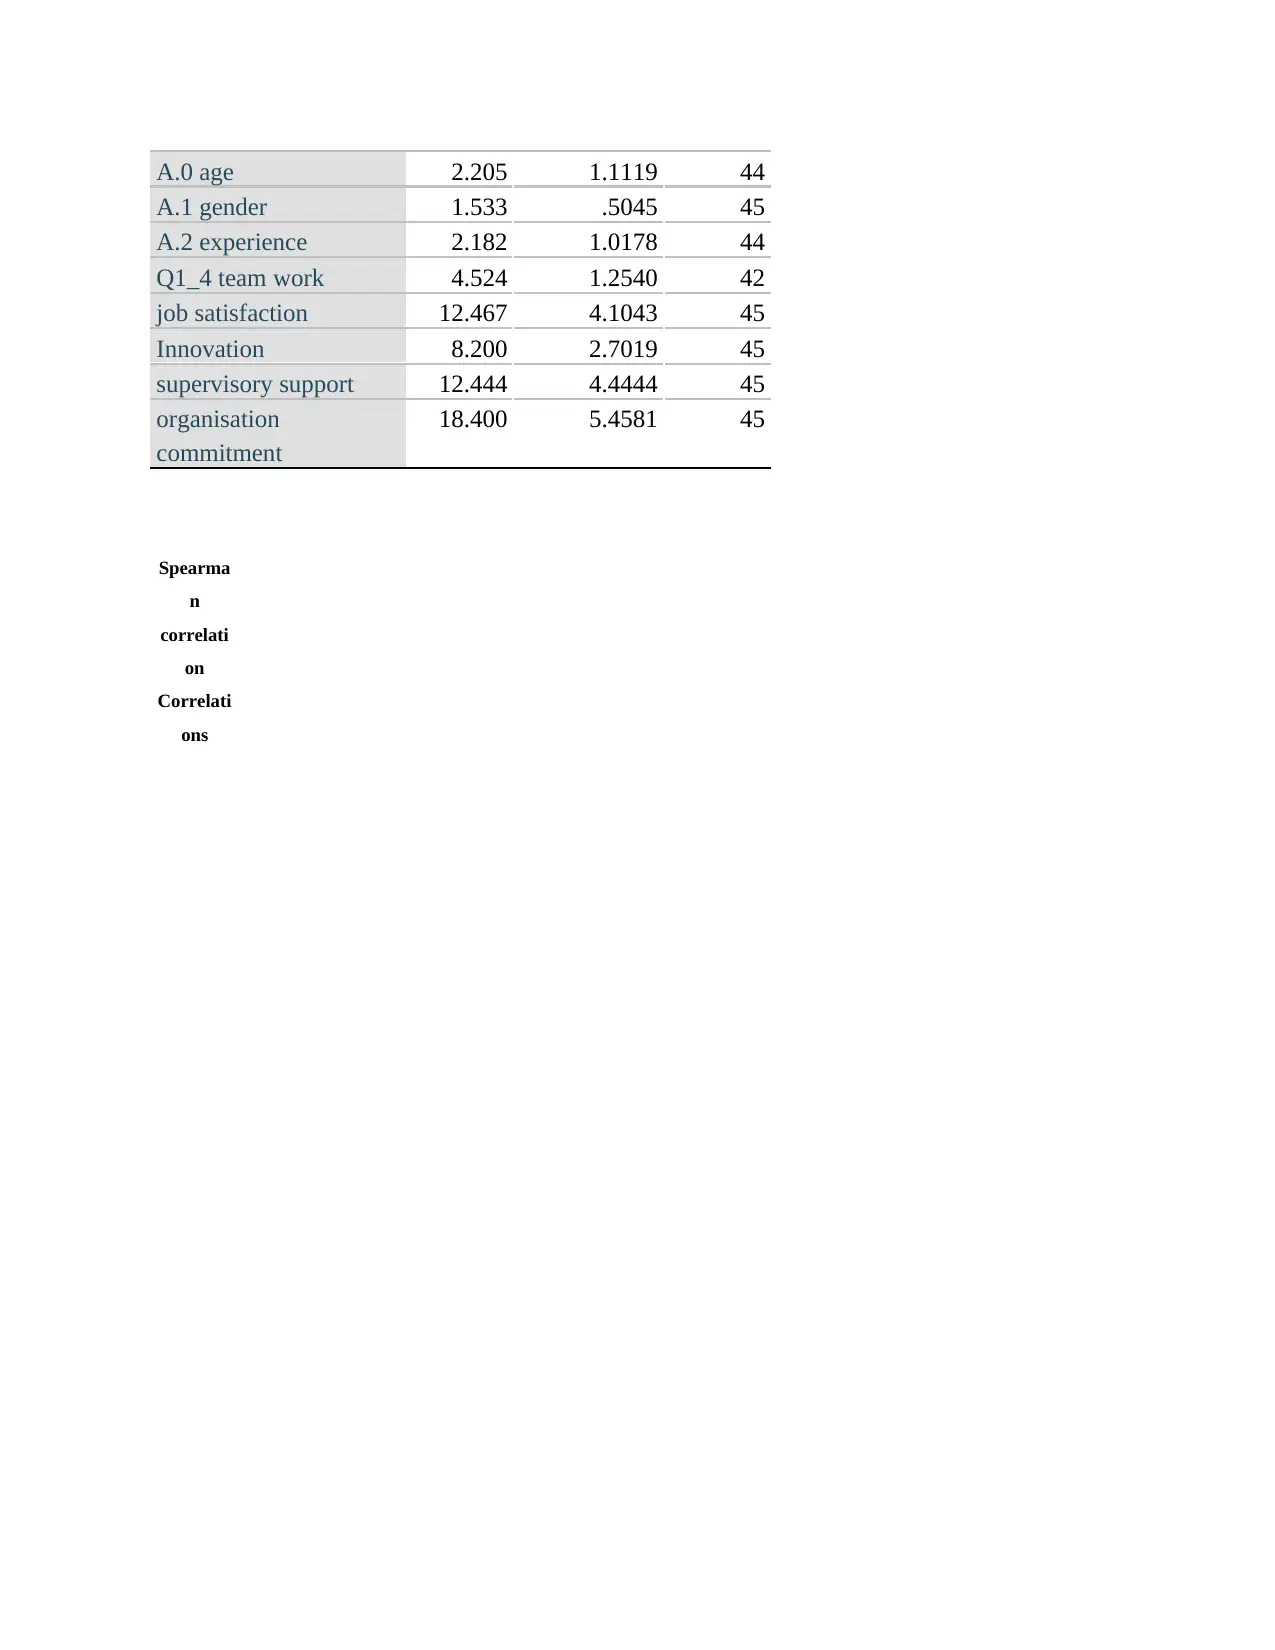
A.0 age 2.205 1.1119 44
A.1 gender 1.533 .5045 45
A.2 experience 2.182 1.0178 44
Q1_4 team work 4.524 1.2540 42
job satisfaction 12.467 4.1043 45
Innovation 8.200 2.7019 45
supervisory support 12.444 4.4444 45
organisation
commitment
18.400 5.4581 45
Spearma
n
correlati
on
Correlati
ons
A.1 gender 1.533 .5045 45
A.2 experience 2.182 1.0178 44
Q1_4 team work 4.524 1.2540 42
job satisfaction 12.467 4.1043 45
Innovation 8.200 2.7019 45
supervisory support 12.444 4.4444 45
organisation
commitment
18.400 5.4581 45
Spearma
n
correlati
on
Correlati
ons
Paraphrase This Document
Need a fresh take? Get an instant paraphrase of this document with our AI Paraphraser
engagement
A.0
age
A.1
gender
A.2
experience
Q1_4
team
work
job
satisfaction innovation
supervisory
support
o
r
g
a
n
i
s
a
t
i
o
n
c
o
m
m
i
t
m
e
n
t
Spearman'
s rho
engagement Correlatio
n
Coefficient
1.000 .112 -.168 .219 .490** .640** -.228 .748** .693**
Sig. (1-
tailed)
. .234 .134 .077 .000 .000 .066 .000 .000
N 45 44 45 44 42 45 45 45 45
Age Correlatio
n
Coefficient
.112 1.000 -.113 .558** .012 .030 -.119 .155 .170
Sig. (1-
tailed)
.234 . .233 .000 .472 .424 .221 .157 .135
N 44 44 44 43 41 44 44 44 44
Gender Correlatio
n
Coefficient
-.168 -.113 1.000 -.216 -.029 .031 .137 -.083 .040
Sig. (1-
tailed)
.134 .233 . .080 .429 .419 .185 .295 .398
N 45 44 45 44 42 45 45 45 45
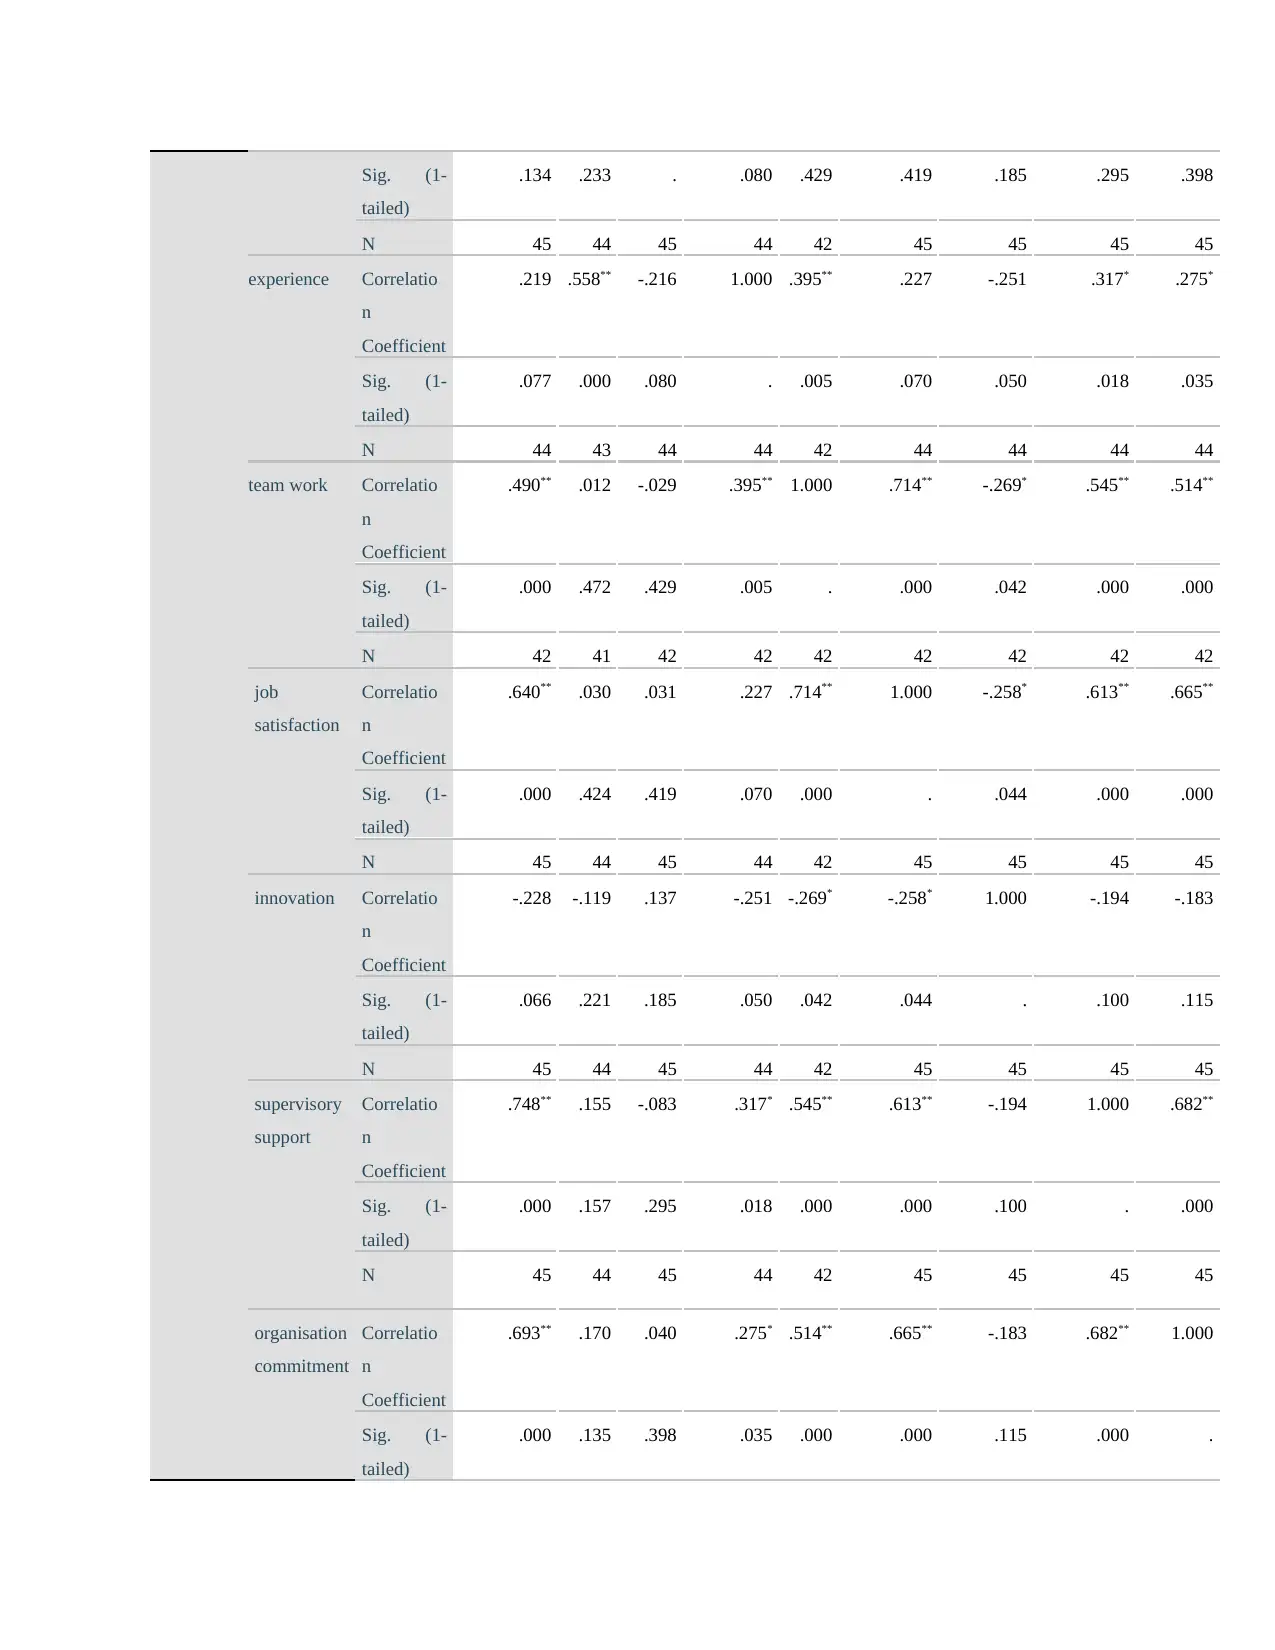
experience Correlatio
n
Coefficient
.219 .558** -.216 1.000 .395** .227 -.251 .317* .275*
Sig. (1-
tailed)
.077 .000 .080 . .005 .070 .050 .018 .035
N 44 43 44 44 42 44 44 44 44
team work Correlatio
n
Coefficient
.490** .012 -.029 .395** 1.000 .714** -.269* .545** .514**
Sig. (1-
tailed)
.000 .472 .429 .005 . .000 .042 .000 .000
N 42 41 42 42 42 42 42 42 42
job
satisfaction
Correlatio
n
Coefficient
.640** .030 .031 .227 .714** 1.000 -.258* .613** .665**
Sig. (1-
tailed)
.000 .424 .419 .070 .000 . .044 .000 .000
N 45 44 45 44 42 45 45 45 45
innovation Correlatio
n
Coefficient
-.228 -.119 .137 -.251 -.269* -.258* 1.000 -.194 -.183
Sig. (1-
tailed)
.066 .221 .185 .050 .042 .044 . .100 .115
N 45 44 45 44 42 45 45 45 45
supervisory
support
Correlatio
n
Coefficient
.748** .155 -.083 .317* .545** .613** -.194 1.000 .682**
Sig. (1-
tailed)
.000 .157 .295 .018 .000 .000 .100 . .000
N 45 44 45 44 42 45 45 45 45
organisation
commitment
Correlatio
n
Coefficient
.693** .170 .040 .275* .514** .665** -.183 .682** 1.000
Sig. (1-
tailed)
.000 .135 .398 .035 .000 .000 .115 .000 .
tailed)
.134 .233 . .080 .429 .419 .185 .295 .398
N 45 44 45 44 42 45 45 45 45
experience Correlatio
n
Coefficient
.219 .558** -.216 1.000 .395** .227 -.251 .317* .275*
Sig. (1-
tailed)
.077 .000 .080 . .005 .070 .050 .018 .035
N 44 43 44 44 42 44 44 44 44
team work Correlatio
n
Coefficient
.490** .012 -.029 .395** 1.000 .714** -.269* .545** .514**
Sig. (1-
tailed)
.000 .472 .429 .005 . .000 .042 .000 .000
N 42 41 42 42 42 42 42 42 42
job
satisfaction
Correlatio
n
Coefficient
.640** .030 .031 .227 .714** 1.000 -.258* .613** .665**
Sig. (1-
tailed)
.000 .424 .419 .070 .000 . .044 .000 .000
N 45 44 45 44 42 45 45 45 45
innovation Correlatio
n
Coefficient
-.228 -.119 .137 -.251 -.269* -.258* 1.000 -.194 -.183
Sig. (1-
tailed)
.066 .221 .185 .050 .042 .044 . .100 .115
N 45 44 45 44 42 45 45 45 45
supervisory
support
Correlatio
n
Coefficient
.748** .155 -.083 .317* .545** .613** -.194 1.000 .682**
Sig. (1-
tailed)
.000 .157 .295 .018 .000 .000 .100 . .000
N 45 44 45 44 42 45 45 45 45
organisation
commitment
Correlatio
n
Coefficient
.693** .170 .040 .275* .514** .665** -.183 .682** 1.000
Sig. (1-
tailed)
.000 .135 .398 .035 .000 .000 .115 .000 .
⊘ This is a preview!⊘
Do you want full access?
Subscribe today to unlock all pages.
Trusted by 1+ million students worldwide
1 out of 26