Ask a question from expert
Film and Theatre Assignment
21 Pages3131 Words331 Views
Added on 2019-12-04
Film and Theatre Assignment
Added on 2019-12-04
BookmarkShareRelated Documents
Have 3D films attracted audience or repelledthem in last 20 years?
TABLE OF CONTENTSChapter 4: Data Analysis......................................................................................................................14.1 Introduction............................................................................................................................14.2 Frequency Distribution..........................................................................................................14.3 Conclusion...........................................................................................................................144.4 Recommendation.................................................................................................................14
CHAPTER 4: DATA ANALYSIS4.1 IntroductionIn the present report, researcher focuses on evaluating whether 3D films attractedaudience or repelled them in last 20 years. In this regard, SPSS tool has been undertaken inwhich frequency distribution has been conducted to present the responses of respondents withpie charts so that recommendation can be made. 4.2 Frequency DistributionIn this, thematic analysis has been used in which different themes has been made on thebasis of questionnaire so that each and every aspect about the study can be analysedappropriately. Further, data gathered from primary and secondary both will be analysed to makerecommendation on future improvements in 3D films. Theme 1: People visits cinemaHow often do you go to the cinema?FrequencyPercentValid PercentCumulativePercentValidOnce a week99.09.09.0once a month2828.028.037.0every three months4141.041.078.0once a year2020.020.098.0never22.02.0100.0Total100100.0100.0Pie chart:1 | P a g e
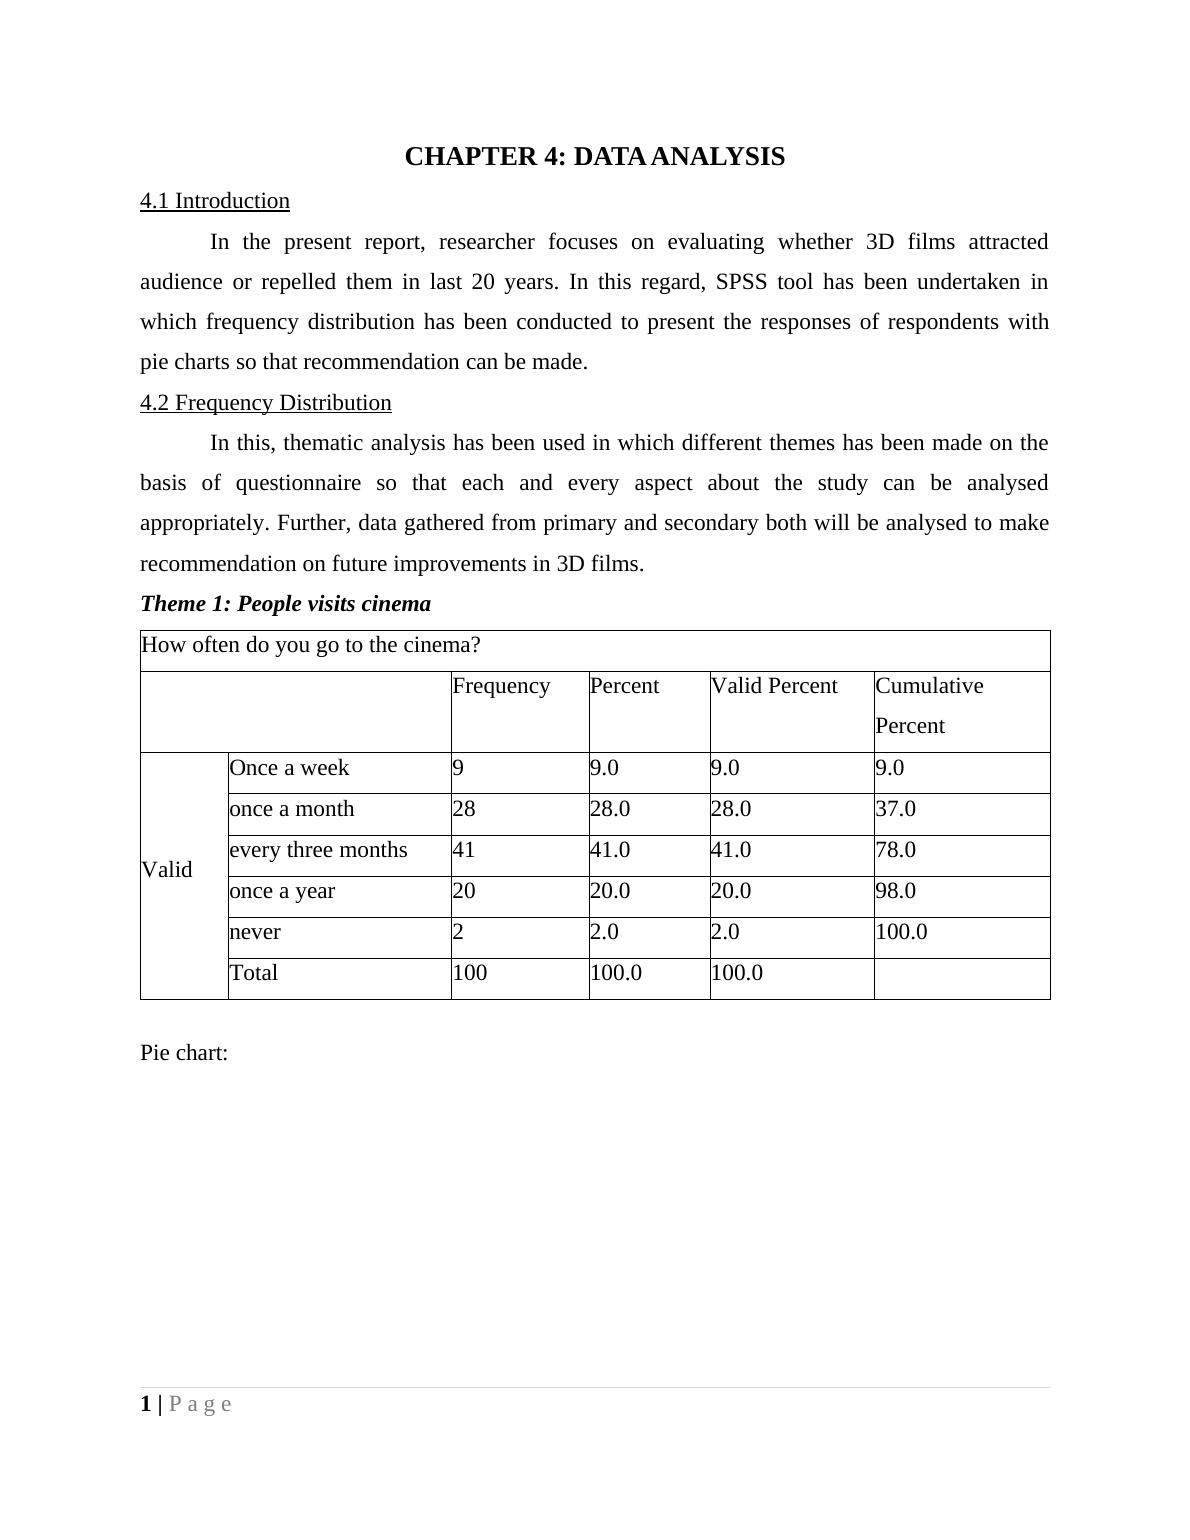
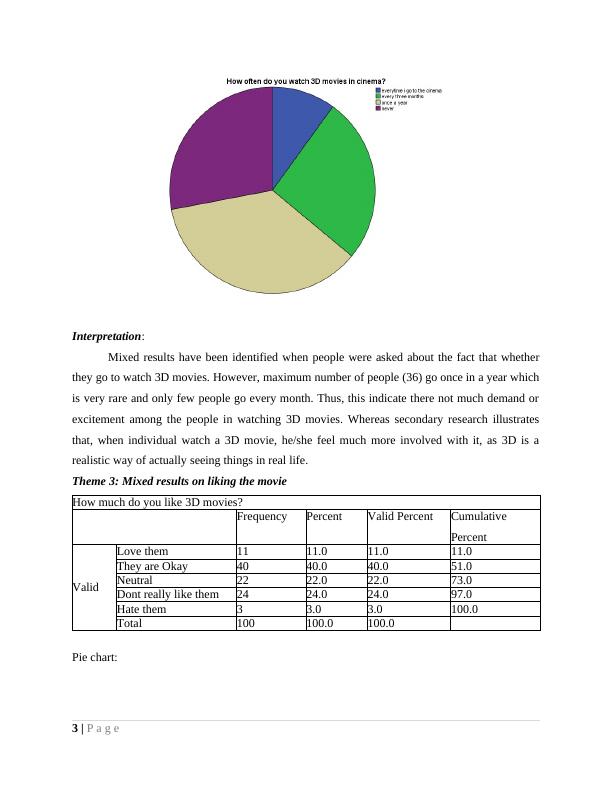
Interpretation:According to the responses identified, most of the respondents go to cinema in everythree months whereas some of them go once in a month. However, there are very low number ofpeople who go frequently as well as never go to cinema. The identified results can be because ofthe reason that, people perceives watching movies in cinema as a major source of entertainmentand in present hectic schedule they barely get the time to visit cinema. Theme 2: People watches 3D movie once in a whileHow often do you watch 3D movies in cinema?FrequencyPercentValid PercentCumulativePercentValidevery time I go to thecinema1010.010.010.0every three months2626.026.036.0once a year3636.036.072.0never2828.028.0100.0Total100100.0100.0Pie chart:2 | P a g e
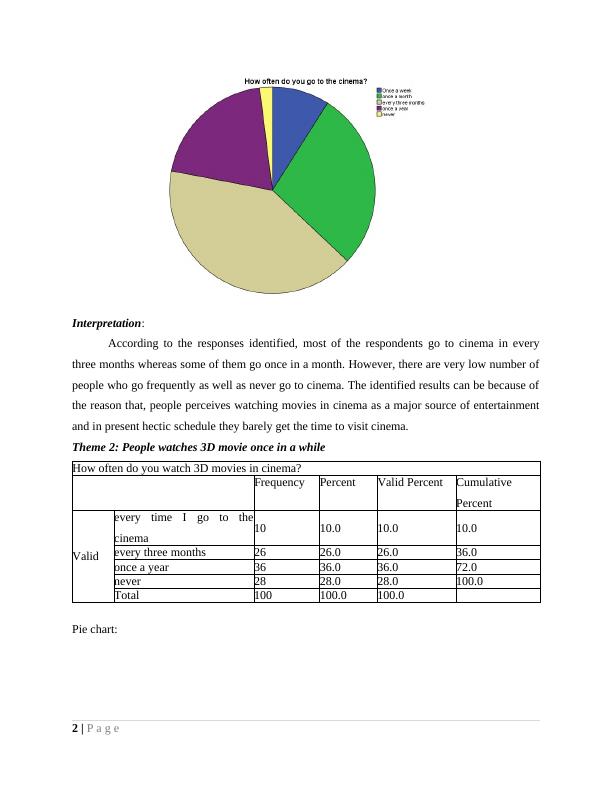
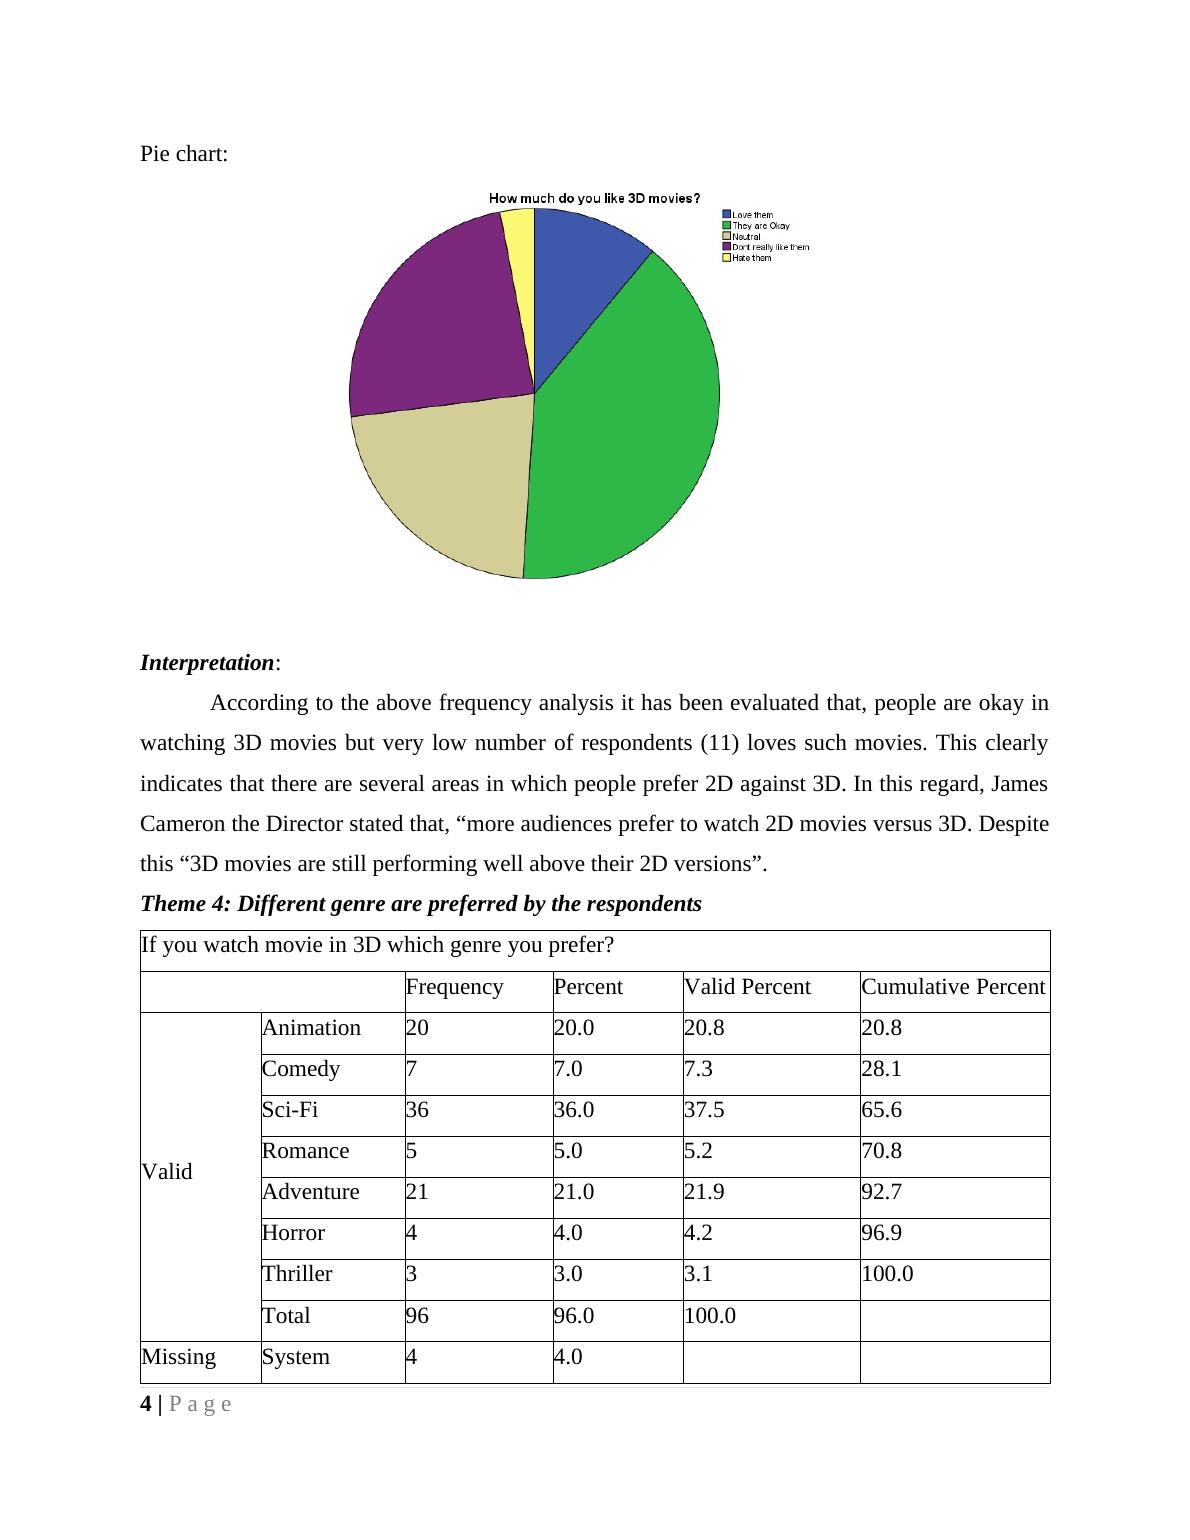
Interpretation:Mixed results have been identified when people were asked about the fact that whetherthey go to watch 3D movies. However, maximum number of people (36) go once in a year whichis very rare and only few people go every month. Thus, this indicate there not much demand orexcitement among the people in watching 3D movies. Whereas secondary research illustratesthat, when individual watch a 3D movie, he/she feel much more involved with it, as 3D is arealistic way of actually seeing things in real life.Theme 3: Mixed results on liking the movieHow much do you like 3D movies?FrequencyPercentValid PercentCumulativePercentValidLove them1111.011.011.0They are Okay4040.040.051.0Neutral2222.022.073.0Dont really like them2424.024.097.0Hate them33.03.0100.0Total100100.0100.0Pie chart:3 | P a g e
Interpretation:According to the above frequency analysis it has been evaluated that, people are okay inwatching 3D movies but very low number of respondents (11) loves such movies. This clearlyindicates that there are several areas in which people prefer 2D against 3D. In this regard, JamesCameron the Director stated that, “more audiences prefer to watch 2D movies versus 3D. Despitethis “3D movies are still performing well above their 2D versions”.Theme 4: Different genre are preferred by the respondentsIf you watch movie in 3D which genre you prefer?FrequencyPercentValid PercentCumulative PercentValidAnimation2020.020.820.8Comedy77.07.328.1Sci-Fi3636.037.565.6Romance55.05.270.8Adventure2121.021.992.7Horror44.04.296.9Thriller33.03.1100.0Total9696.0100.0MissingSystem44.0Total100100.0Pie chart:4 | P a g e
End of preview
Want to access all the pages? Upload your documents or become a member.
Related Documents
Data Analysis and Visualizationlg...
|16
|2350
|88
Data Analysis and Visualizationlg...
|16
|2397
|97
Data Analysis and Visualizationlg...
|16
|2415
|97
Analysis of Infection Rate of COVID-19 in White and BAME Patientslg...
|16
|2302
|76