FIN10002 Financial Statistics Assignment
19 Pages2553 Words358 Views
Random Sampling Technique (FIN10002)
Added on 2020-05-08
FIN10002 Financial Statistics Assignment
Random Sampling Technique (FIN10002)
Added on 2020-05-08
ShareRelated Documents
Running head: FINANCIAL STATISTICSFinancial StatisticsName of the studentName of the universityAuthor’s note
1FINANCIAL STATISTICSExecutive SummaryHerein, we present the analysis of office supply sales of Hardware and Garden Supplies.The analysis of the data provided by the organization shows that with increase in shipping costsas well as sales the number of orders decreases. The investigation shows that the orders havediverse consumer segments, shipping modes and priority levels. There is no difference in theshipping costs of critical and low priority orders. Moreover, there is no difference in the salesfrom eastern and western region. The investigation shows that most of the orders are shippedwithin 2 days of the orders being booked. Moreover, most of the orders for office supplies have acritical priority. In addition, most of the orders are shipped through regular air and are from theeastern region. The investigation shows that the highest number of customers is corporatecustomers and the least number are consumer. We also find that there is a weak relationshipbetween order quantity and sales.
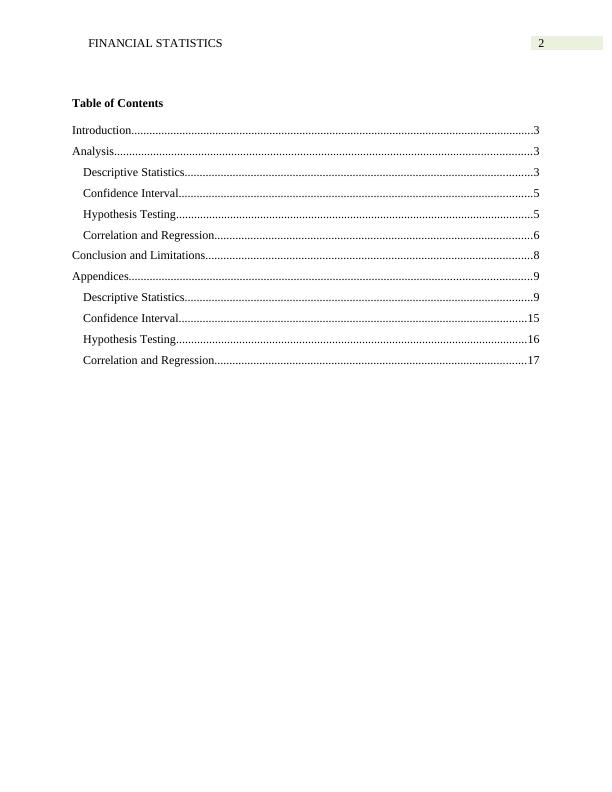
2FINANCIAL STATISTICSTable of ContentsIntroduction......................................................................................................................................3Analysis...........................................................................................................................................3Descriptive Statistics....................................................................................................................3Confidence Interval......................................................................................................................5Hypothesis Testing.......................................................................................................................5Correlation and Regression..........................................................................................................6Conclusion and Limitations.............................................................................................................8Appendices......................................................................................................................................9Descriptive Statistics....................................................................................................................9Confidence Interval....................................................................................................................15Hypothesis Testing.....................................................................................................................16Correlation and Regression........................................................................................................17
3FINANCIAL STATISTICSIntroduction In this assignment, we have analysed the office supply sales data provided by Hardwareand Garden Supplies The organization has provided information of office supplies for 2002orders. For simplicity of calculation 60 orders randomly selected were analysed. Office suppliesdata has provided information on different attributes. The various attributes for whichinformation is provided is order quantity, shipping costs as well as sales ($). Informationregarding the region from which the orders were generated, shipping mode along with the type ofcustomers and shipping priority was also provided. In this assignment, we have also comparedthe sales for home office customers with all the customers. In addition, we have also comparedthe shipping costs for the sample customers with the data of all the customers. The averageshipping costs for critical and low priority orders have been compared. The average sales fororders from eastern and western region have also been compared. We have also examined therelationship between order quantity and sales. AnalysisDescriptive StatisticsOrder IDThe variable represents a value through which the order can be tracked. Order PriorityHardware and Garden supplies prioritise the office supply sales in four major categories.From the sample of the data, we find that most of the orders have a critical priority (table 1). Thenumber of sales orders increases from a priority of Low (7) to Critical (17). There are also ordersfor which the order priority has not been specified (figure 2). Order QuantityThe average number of order quantity is 22.55 with a variation of 13.45 (table 2). Theorder quantity for 50% of the orders is below 23.5. The difference between the minimum andmaximum order quantity is 49. The order quantity for 50% of the orders lies within the range of22. There is a variation of 60% in order quantity.Sales
End of preview
Want to access all the pages? Upload your documents or become a member.
Related Documents
Financial Statistics : Assignmentlg...
|20
|2460
|92
FIN10002 Financial Statistics - Assignmentlg...
|15
|2418
|256
FIN10002 Random Sampling Technique Assignmentlg...
|9
|1767
|233
FIN10002 Financial Statisticslg...
|16
|1975
|129
Assignment Economics: Regression Analysislg...
|16
|2920
|220
Analyzing Orders Data for Desklib Online Librarylg...
|24
|4294
|260