Financial Analysis: BHP Billiton and Rio Tinto ASX Listed Companies
VerifiedAdded on 2023/04/20
|22
|4784
|402
Report
AI Summary
This report provides a comprehensive financial analysis of BHP Billiton and Rio Tinto, two major companies listed on the ASX. It begins with an overview of their operations and comparative advantages, followed by a detailed calculation and comparison of key performance ratios, including profitability ratios (Return on Assets, Return on Equity, Net Profit Margin), capital structure (leverage) ratios (Debt to Equity Ratio, Interest Coverage Ratio), and liquidity ratios (Current Ratio, Quick Ratio). The report also examines the share price movements of both companies and the factors affecting these movements, including beta values and dividend policies. Ultimately, the analysis aims to provide financial and investment advice based on the updated financial statements of the chosen companies, offering a recommendation based on their financial performance.

Running Head: FINANCE 0
Finance
Finance
Paraphrase This Document
Need a fresh take? Get an instant paraphrase of this document with our AI Paraphraser
FINANCE FOR MASTERS 1
Table of Contents
Introduction................................................................................................................................2
Operation and comparative advantages.....................................................................................2
BHP Billiton...........................................................................................................................2
Rio Tinto.................................................................................................................................2
Calculation of the performance ratios........................................................................................2
Profitability ratios...................................................................................................................3
Return on Assets.....................................................................................................................4
Return on Equity.....................................................................................................................5
Capital structure (leverage) ratios..........................................................................................5
Debt to Equity Ratio...............................................................................................................5
Interest Coverage Ratio..........................................................................................................6
Liquidity ratios.......................................................................................................................6
Current Ratio..........................................................................................................................7
Quick ratio..............................................................................................................................7
Share prices movements.............................................................................................................7
BHP Billiton...........................................................................................................................7
Rio Tinto.................................................................................................................................8
Factors affecting the share price................................................................................................9
BHP Billiton...........................................................................................................................9
Rio Tinto Limited...................................................................................................................9

FINANCE FOR MASTERS 2
Beta values.................................................................................................................................9
Dividend policies.....................................................................................................................10
Recommendation letter............................................................................................................11
Conclusion................................................................................................................................11
References................................................................................................................................12
⊘ This is a preview!⊘
Do you want full access?
Subscribe today to unlock all pages.
Trusted by 1+ million students worldwide
FINANCE FOR MASTERS 3
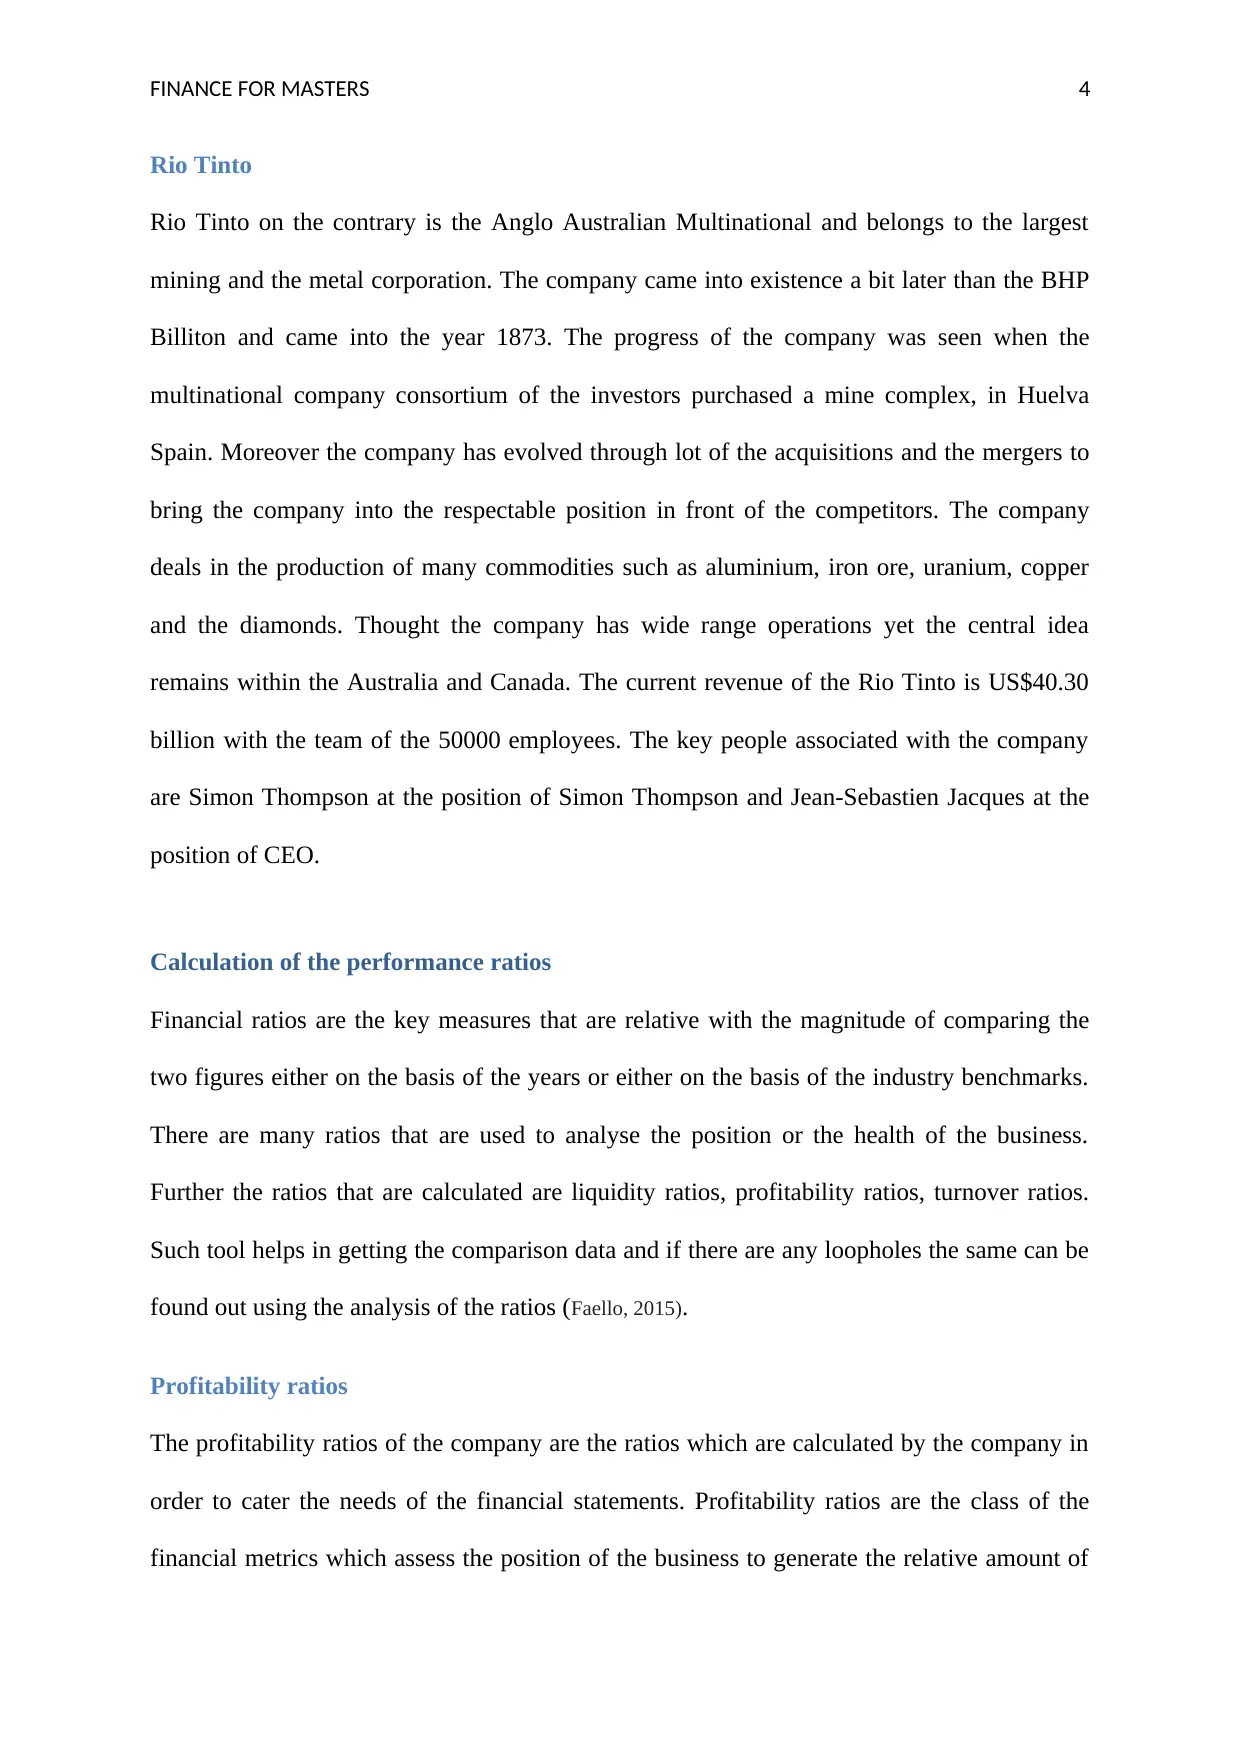
Introduction
The users of the financial statements are the management and the investors and in order to
fulfil the needs of the both the users the financial the statements shall be core accuracy. The
analysis of the financial statements is the most useful information which is beneficial if
comparison is made either against the years or against the company in the same industry. In
order to make the investment and the proposals in this report the proper analysis of the price
movements of the company have been disclosed the policy of the dividend as well. The
companies chosen for the purpose of the comparison is BHP Billiton and Rio Tinto (Gitman,
Juchau and Flanagan, 2015).
Operation and comparative advantages
BHP Billiton
BHP billiton known for the acquisition of the natural resources is the renowned company
registered under the Corporation Act 2001. The company is the Anglo-Australian
multinational corporation whose headquarters are presently in Melbourne. The company is
also involved in the business of the mining and petroleum. The company was founded in on
29th September 1860 and the primary role of the company is to acquire the natural resources.
On the basis of the market share and the market capitalisation the company came on the first
position as the largest mining company. BHP is listed on the London Stock Exchange and the
Australian Stock Exchange as well. There are almost 650 corporations and in the present
scenario the company is performing in more than 100 countries. The dividends listed by the
company for the shareholders are 118 US Cents and at the same time the earnings per share
of the company is more than 69.9 US cents.
Paraphrase This Document
Need a fresh take? Get an instant paraphrase of this document with our AI Paraphraser
FINANCE FOR MASTERS 4
Rio Tinto
Rio Tinto on the contrary is the Anglo Australian Multinational and belongs to the largest
mining and the metal corporation. The company came into existence a bit later than the BHP
Billiton and came into the year 1873. The progress of the company was seen when the
multinational company consortium of the investors purchased a mine complex, in Huelva
Spain. Moreover the company has evolved through lot of the acquisitions and the mergers to
bring the company into the respectable position in front of the competitors. The company
deals in the production of many commodities such as aluminium, iron ore, uranium, copper
and the diamonds. Thought the company has wide range operations yet the central idea
remains within the Australia and Canada. The current revenue of the Rio Tinto is US$40.30
billion with the team of the 50000 employees. The key people associated with the company
are Simon Thompson at the position of Simon Thompson and Jean-Sebastien Jacques at the
position of CEO.
Calculation of the performance ratios
Financial ratios are the key measures that are relative with the magnitude of comparing the
two figures either on the basis of the years or either on the basis of the industry benchmarks.
There are many ratios that are used to analyse the position or the health of the business.
Further the ratios that are calculated are liquidity ratios, profitability ratios, turnover ratios.
Such tool helps in getting the comparison data and if there are any loopholes the same can be
found out using the analysis of the ratios (Faello, 2015).
Profitability ratios
The profitability ratios of the company are the ratios which are calculated by the company in
order to cater the needs of the financial statements. Profitability ratios are the class of the
financial metrics which assess the position of the business to generate the relative amount of
FINANCE FOR MASTERS 5
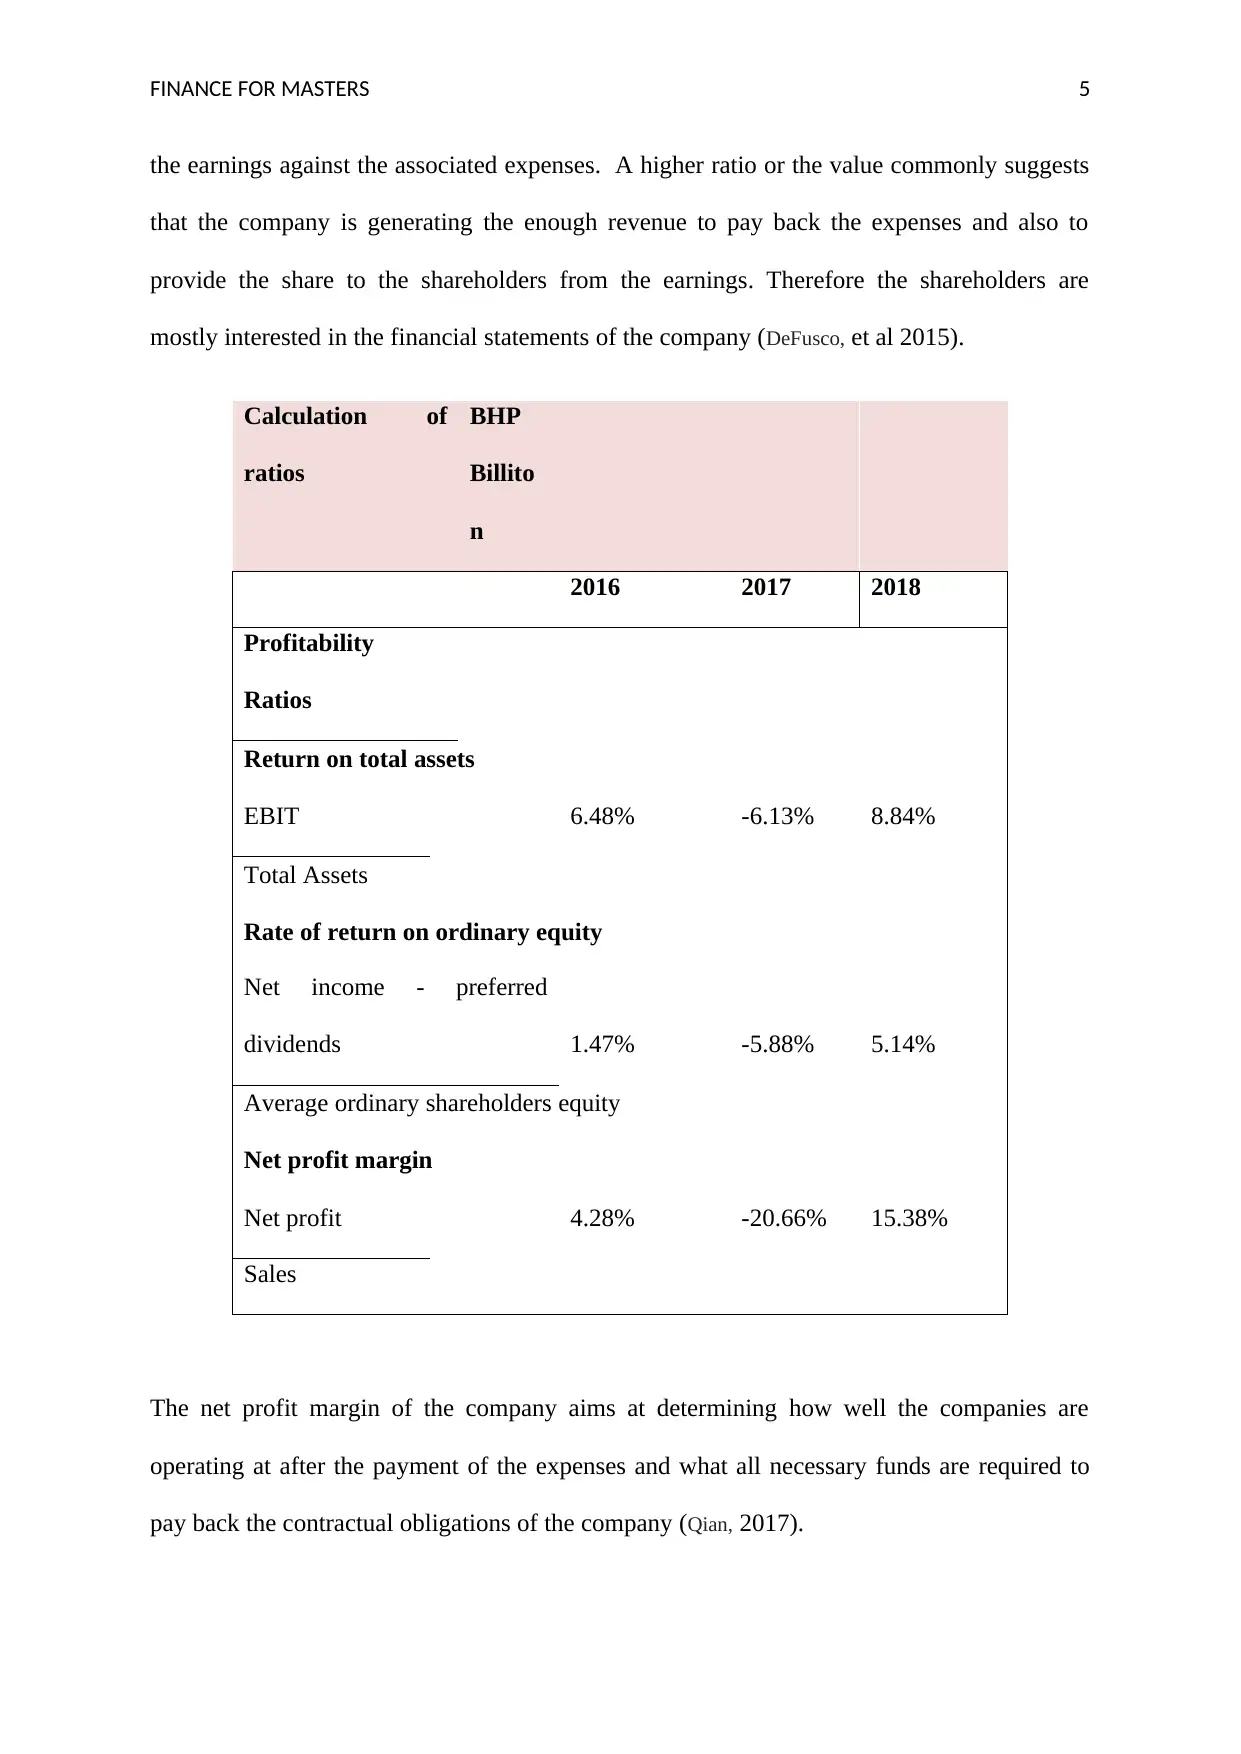
the earnings against the associated expenses. A higher ratio or the value commonly suggests
that the company is generating the enough revenue to pay back the expenses and also to
provide the share to the shareholders from the earnings. Therefore the shareholders are
mostly interested in the financial statements of the company (DeFusco, et al 2015).
Calculation of
ratios
BHP
Billito
n
2016 2017 2018
Profitability
Ratios
Return on total assets
EBIT 6.48% -6.13% 8.84%
Total Assets
Rate of return on ordinary equity
Net income - preferred
dividends 1.47% -5.88% 5.14%
Average ordinary shareholders equity
Net profit margin
Net profit 4.28% -20.66% 15.38%
Sales
The net profit margin of the company aims at determining how well the companies are
operating at after the payment of the expenses and what all necessary funds are required to
pay back the contractual obligations of the company (Qian, 2017).
⊘ This is a preview!⊘
Do you want full access?
Subscribe today to unlock all pages.
Trusted by 1+ million students worldwide
FINANCE FOR MASTERS 6
The net profit margin of the BHP Billiton was 6.48% in the year 2015 and it decreased to
exactly 100% thereafter the net profit margin increased again in the year 2017 and reached
towards the 8.84%, whereas in comparison to the BHP Billiton the Rio Tinto is performing
consistently better than the BHP Billiton (Bamiatzi Bozos, Cavusgil and Hult, 2016).
Return on Assets
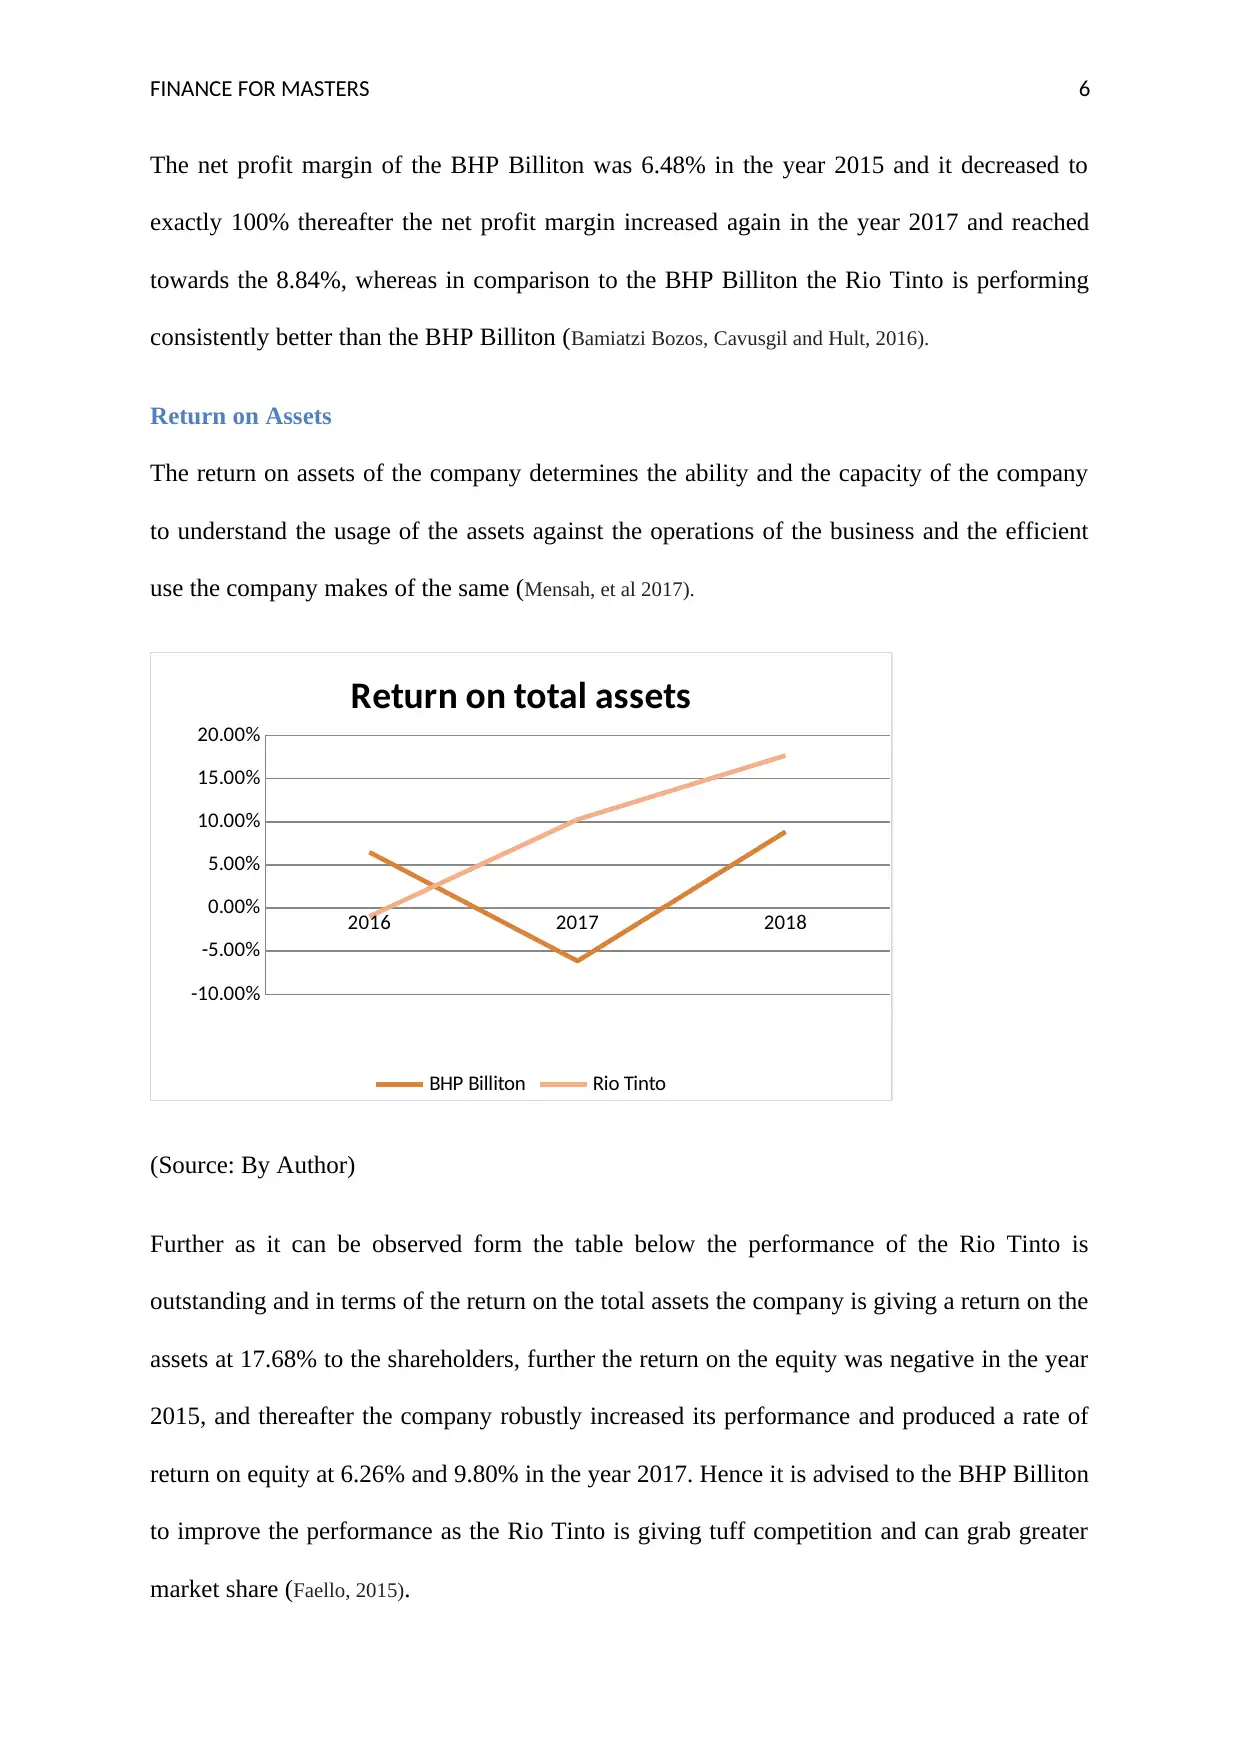
The return on assets of the company determines the ability and the capacity of the company
to understand the usage of the assets against the operations of the business and the efficient
use the company makes of the same (Mensah, et al 2017).
2016 2017 2018
-10.00%
-5.00%
0.00%
5.00%
10.00%
15.00%
20.00%
Return on total assets
BHP Billiton Rio Tinto
(Source: By Author)
Further as it can be observed form the table below the performance of the Rio Tinto is
outstanding and in terms of the return on the total assets the company is giving a return on the
assets at 17.68% to the shareholders, further the return on the equity was negative in the year
2015, and thereafter the company robustly increased its performance and produced a rate of
return on equity at 6.26% and 9.80% in the year 2017. Hence it is advised to the BHP Billiton
to improve the performance as the Rio Tinto is giving tuff competition and can grab greater
market share (Faello, 2015).
The net profit margin of the BHP Billiton was 6.48% in the year 2015 and it decreased to
exactly 100% thereafter the net profit margin increased again in the year 2017 and reached
towards the 8.84%, whereas in comparison to the BHP Billiton the Rio Tinto is performing
consistently better than the BHP Billiton (Bamiatzi Bozos, Cavusgil and Hult, 2016).
Return on Assets
The return on assets of the company determines the ability and the capacity of the company
to understand the usage of the assets against the operations of the business and the efficient
use the company makes of the same (Mensah, et al 2017).
2016 2017 2018
-10.00%
-5.00%
0.00%
5.00%
10.00%
15.00%
20.00%
Return on total assets
BHP Billiton Rio Tinto
(Source: By Author)
Further as it can be observed form the table below the performance of the Rio Tinto is
outstanding and in terms of the return on the total assets the company is giving a return on the
assets at 17.68% to the shareholders, further the return on the equity was negative in the year
2015, and thereafter the company robustly increased its performance and produced a rate of
return on equity at 6.26% and 9.80% in the year 2017. Hence it is advised to the BHP Billiton
to improve the performance as the Rio Tinto is giving tuff competition and can grab greater
market share (Faello, 2015).
Paraphrase This Document
Need a fresh take? Get an instant paraphrase of this document with our AI Paraphraser

FINANCE FOR MASTERS 7
FINANCE FOR MASTERS 8
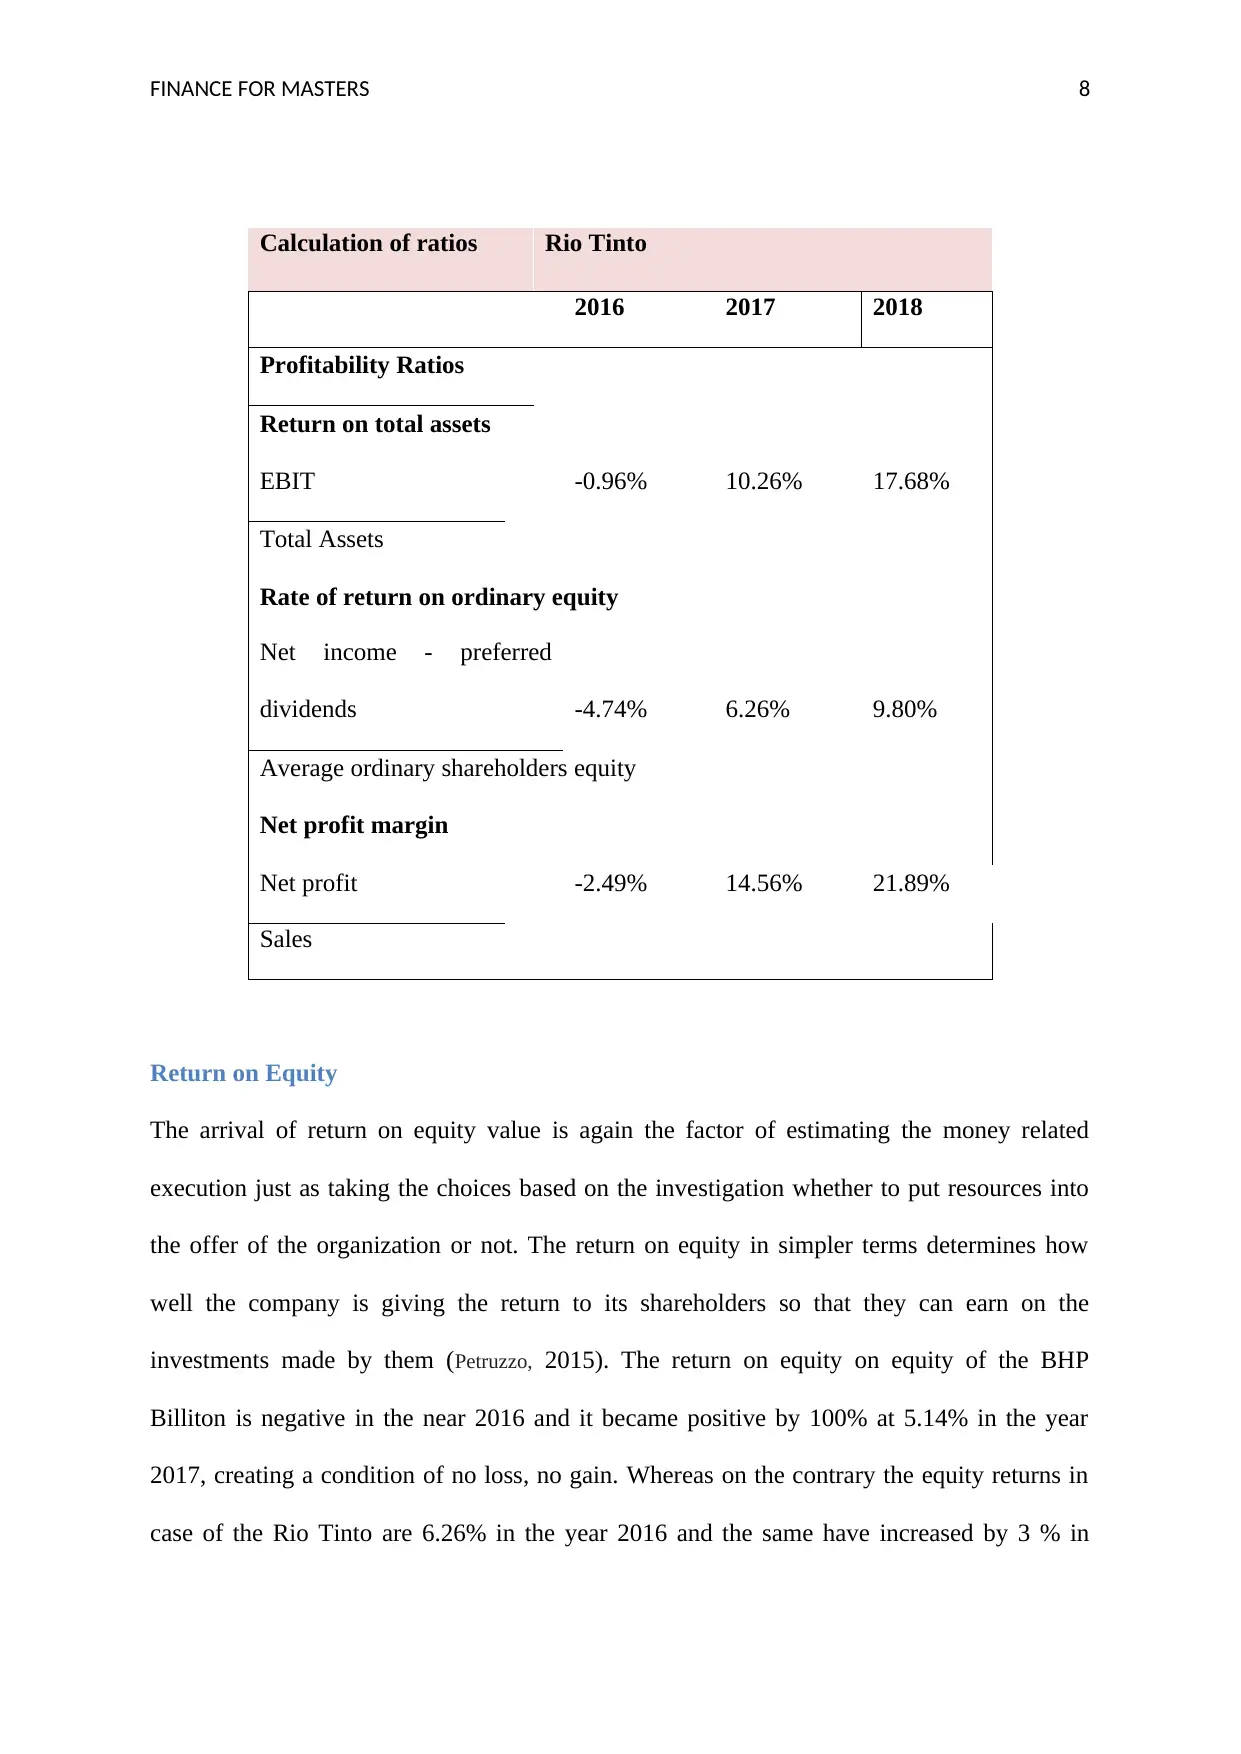
Calculation of ratios Rio Tinto
2016 2017 2018
Profitability Ratios
Return on total assets
EBIT -0.96% 10.26% 17.68%
Total Assets
Rate of return on ordinary equity
Net income - preferred
dividends -4.74% 6.26% 9.80%
Average ordinary shareholders equity
Net profit margin
Net profit -2.49% 14.56% 21.89%
Sales
Return on Equity
The arrival of return on equity value is again the factor of estimating the money related
execution just as taking the choices based on the investigation whether to put resources into
the offer of the organization or not. The return on equity in simpler terms determines how
well the company is giving the return to its shareholders so that they can earn on the
investments made by them (Petruzzo, 2015). The return on equity on equity of the BHP
Billiton is negative in the near 2016 and it became positive by 100% at 5.14% in the year
2017, creating a condition of no loss, no gain. Whereas on the contrary the equity returns in
case of the Rio Tinto are 6.26% in the year 2016 and the same have increased by 3 % in
⊘ This is a preview!⊘
Do you want full access?
Subscribe today to unlock all pages.
Trusted by 1+ million students worldwide
FINANCE FOR MASTERS 9
terms of the percentage points at 9.80% in the year 2017. This shows that in area of the return
of equity the shareholders of the Rio Tinto are most valuable and getting higher returns in
comparisons to the shareholders of the BHP Billiton (Luo, et al 2015).
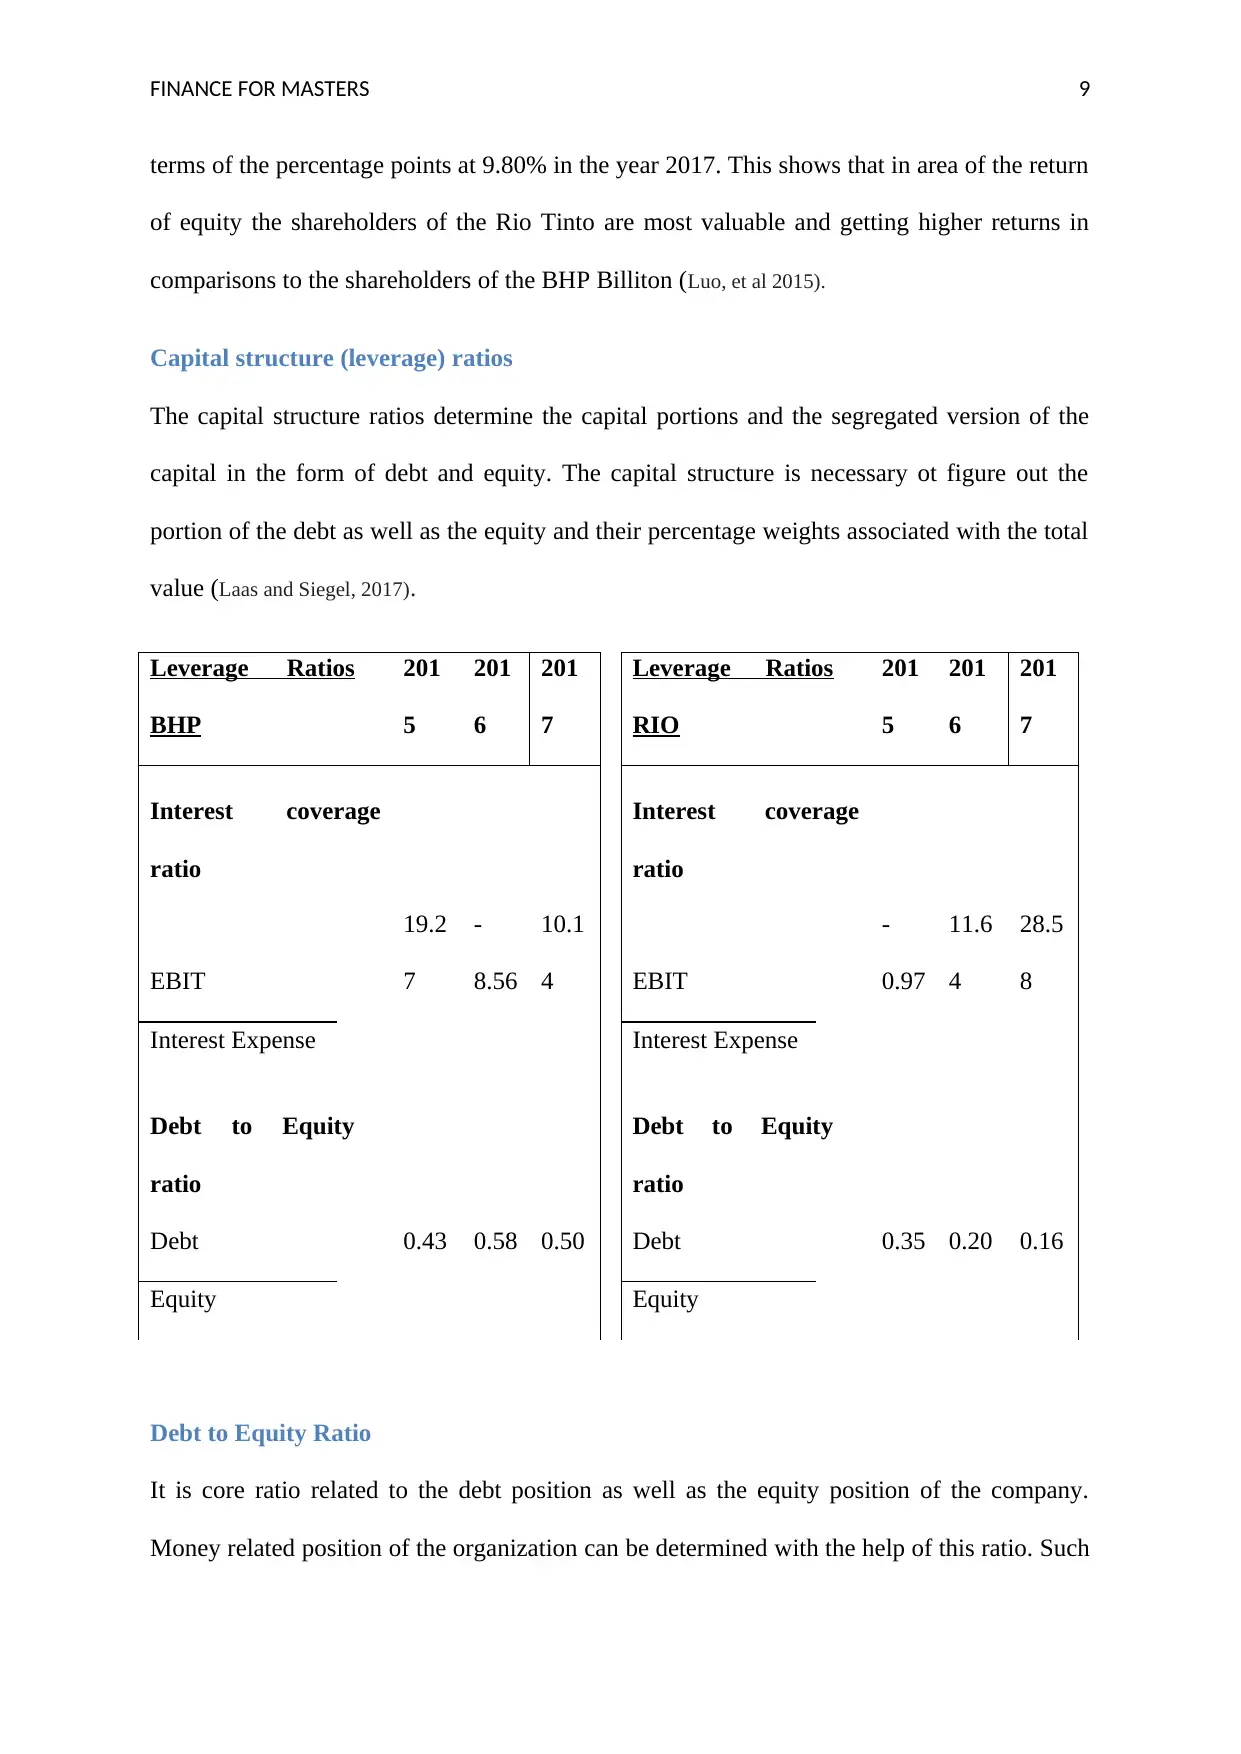
Capital structure (leverage) ratios
The capital structure ratios determine the capital portions and the segregated version of the
capital in the form of debt and equity. The capital structure is necessary ot figure out the
portion of the debt as well as the equity and their percentage weights associated with the total
value (Laas and Siegel, 2017).
Leverage Ratios
BHP
201
5
201
6
201
7
Leverage Ratios
RIO
201
5
201
6
201
7
Interest coverage
ratio
Interest coverage
ratio
EBIT
19.2
7
-
8.56
10.1
4 EBIT
-
0.97
11.6
4
28.5
8
Interest Expense Interest Expense
Debt to Equity
ratio
Debt to Equity
ratio
Debt 0.43 0.58 0.50 Debt 0.35 0.20 0.16
Equity Equity
Debt to Equity Ratio
It is core ratio related to the debt position as well as the equity position of the company.
Money related position of the organization can be determined with the help of this ratio. Such
terms of the percentage points at 9.80% in the year 2017. This shows that in area of the return
of equity the shareholders of the Rio Tinto are most valuable and getting higher returns in
comparisons to the shareholders of the BHP Billiton (Luo, et al 2015).
Capital structure (leverage) ratios
The capital structure ratios determine the capital portions and the segregated version of the
capital in the form of debt and equity. The capital structure is necessary ot figure out the
portion of the debt as well as the equity and their percentage weights associated with the total
value (Laas and Siegel, 2017).
Leverage Ratios
BHP
201
5
201
6
201
7
Leverage Ratios
RIO
201
5
201
6
201
7
Interest coverage
ratio
Interest coverage
ratio
EBIT
19.2
7
-
8.56
10.1
4 EBIT
-
0.97
11.6
4
28.5
8
Interest Expense Interest Expense
Debt to Equity
ratio
Debt to Equity
ratio
Debt 0.43 0.58 0.50 Debt 0.35 0.20 0.16
Equity Equity
Debt to Equity Ratio
It is core ratio related to the debt position as well as the equity position of the company.
Money related position of the organization can be determined with the help of this ratio. Such
Paraphrase This Document
Need a fresh take? Get an instant paraphrase of this document with our AI Paraphraser
FINANCE FOR MASTERS 10
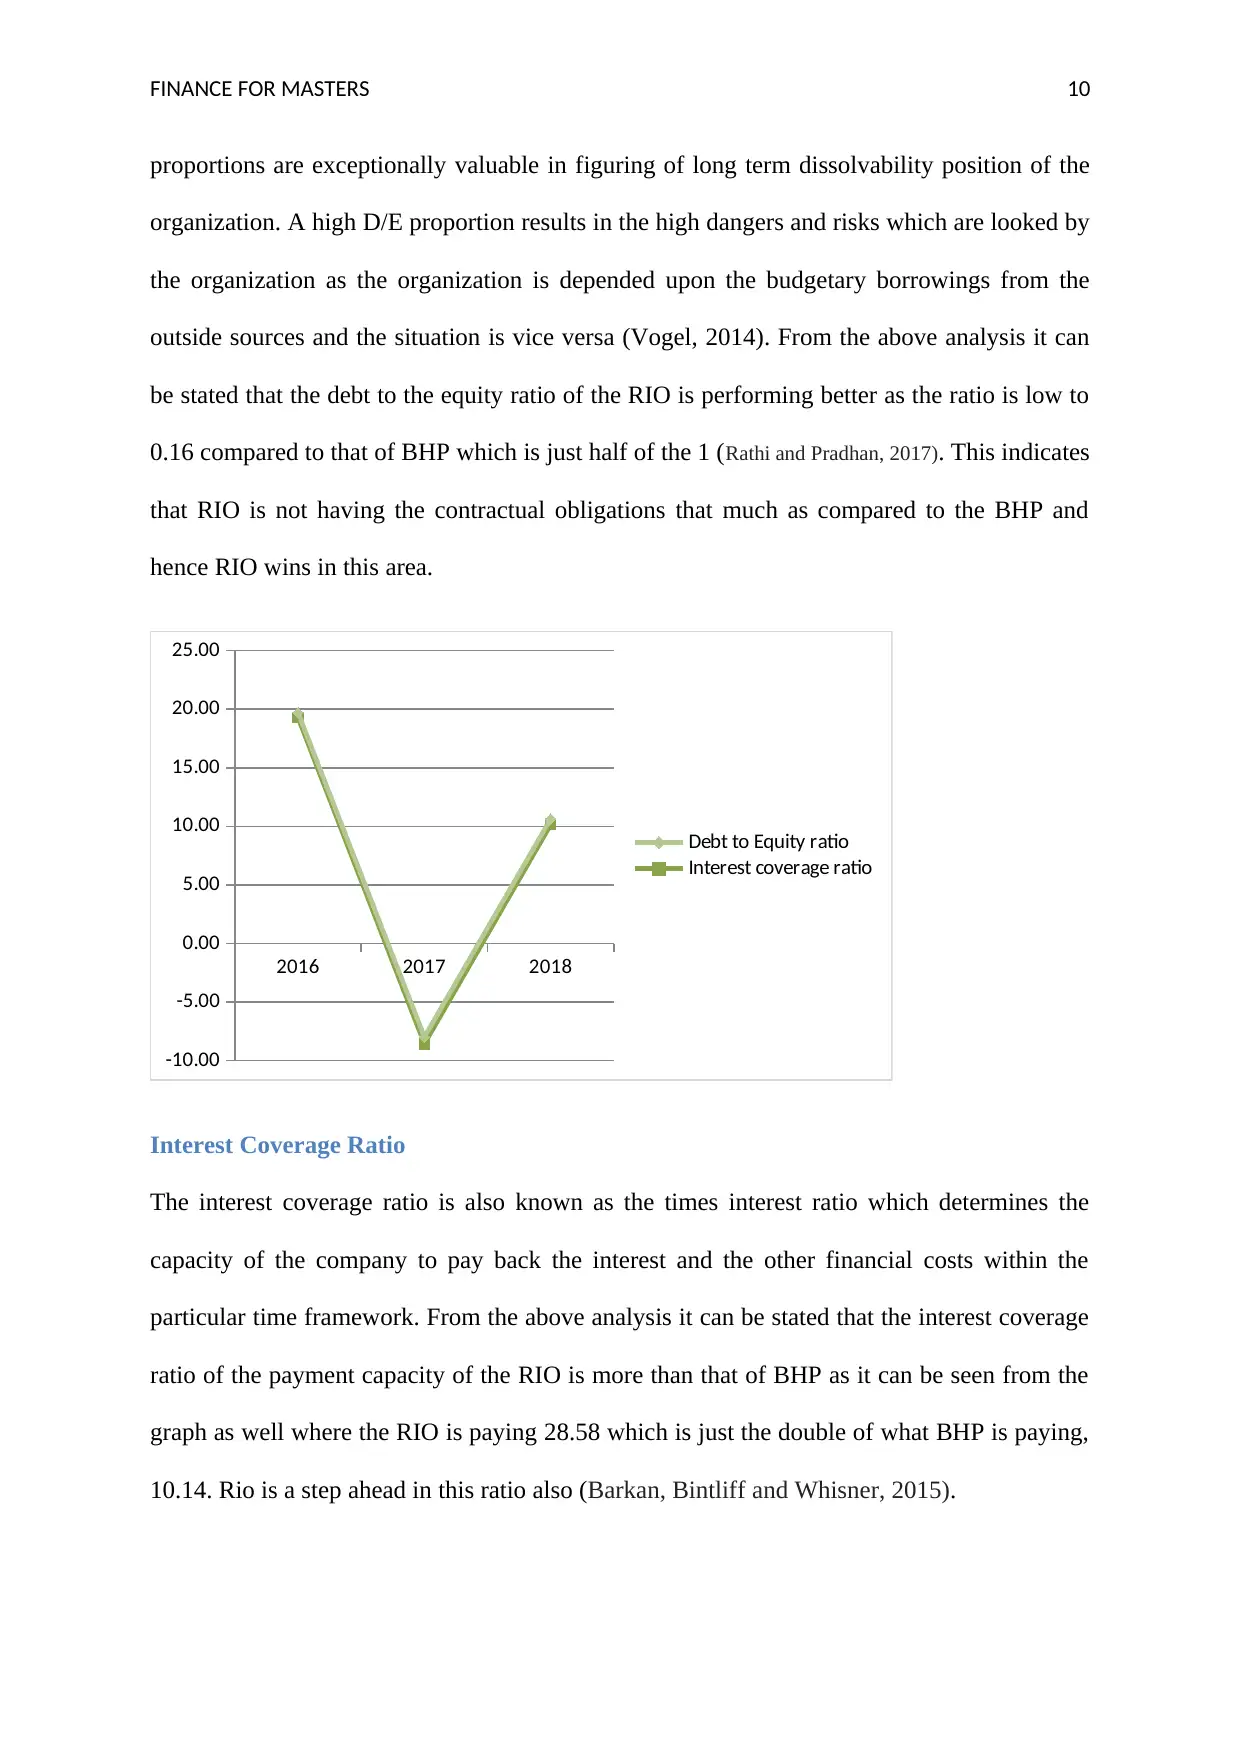
proportions are exceptionally valuable in figuring of long term dissolvability position of the
organization. A high D/E proportion results in the high dangers and risks which are looked by
the organization as the organization is depended upon the budgetary borrowings from the
outside sources and the situation is vice versa (Vogel, 2014). From the above analysis it can
be stated that the debt to the equity ratio of the RIO is performing better as the ratio is low to
0.16 compared to that of BHP which is just half of the 1 (Rathi and Pradhan, 2017). This indicates
that RIO is not having the contractual obligations that much as compared to the BHP and
hence RIO wins in this area.
2016 2017 2018
-10.00
-5.00
0.00
5.00
10.00
15.00
20.00
25.00
Debt to Equity ratio
Interest coverage ratio
Interest Coverage Ratio
The interest coverage ratio is also known as the times interest ratio which determines the
capacity of the company to pay back the interest and the other financial costs within the
particular time framework. From the above analysis it can be stated that the interest coverage
ratio of the payment capacity of the RIO is more than that of BHP as it can be seen from the
graph as well where the RIO is paying 28.58 which is just the double of what BHP is paying,
10.14. Rio is a step ahead in this ratio also (Barkan, Bintliff and Whisner, 2015).
FINANCE FOR MASTERS 11
Liquidity ratios
The liquidity ratios are the key ratios which determine the performance of the company
mainly on the basis of the efficient utilisation of the current assets so that he contractual
obligations are set off easily and the company can maintain any easy cash in hand. The
current ratio and the quick ratio of the company are the key elements of the liquidity ratio.
⊘ This is a preview!⊘
Do you want full access?
Subscribe today to unlock all pages.
Trusted by 1+ million students worldwide
1 out of 22
Related Documents


Your All-in-One AI-Powered Toolkit for Academic Success.
+13062052269
info@desklib.com
Available 24*7 on WhatsApp / Email
![[object Object]](/_next/static/media/star-bottom.7253800d.svg)
Unlock your academic potential
Copyright © 2020–2026 A2Z Services. All Rights Reserved. Developed and managed by ZUCOL.