Report: Financial Performance Analysis of Webster Limited (Finance 2)
VerifiedAdded on 2020/05/16
|11
|2209
|49
Report
AI Summary
This report provides a comprehensive financial analysis of Webster Limited, an Australian agriculture company. It calculates and interprets key financial ratios, including Return on Assets (ROA), Return on Equity (ROE), and the debt ratio, over a three-year period. The analysis also examines the company's stock price trends, assesses the Weighted Average Cost of Capital (WACC), and evaluates its dividend policy. Furthermore, the report includes an analysis of the company's ownership structure and governance. The study aims to offer recommendations on whether to include Webster Limited in an investment portfolio, based on its financial performance, debt management, and dividend strategy. The analysis utilizes data from the company's financial statements and market data to draw conclusions about its financial health and investment potential.

Running Head: FINANCE
Paraphrase This Document
Need a fresh take? Get an instant paraphrase of this document with our AI Paraphraser
Finance 2
Contents
Introduction...........................................................................................................................................3
About Webster Limited.........................................................................................................................3
Structure- ownership and Governance...................................................................................................3
Calculating Key ratios...........................................................................................................................3
Stock prices...........................................................................................................................................5
Announcements.....................................................................................................................................7
Stock details..........................................................................................................................................7
Weighted Average Cost of Capital........................................................................................................8
Debt ratio analysis.................................................................................................................................9
Dividend policy.....................................................................................................................................9
Recommendation letter........................................................................................................................10
References...........................................................................................................................................11
Finance 3
Introduction
The report includes an overall financial analysis of an Australia based company Webster
Limited. The analysis consists of the calculations of ratios like ROA, ROE and Debt ratio. It
also includes examination of trend in the stock prices of the company along with the
estimation of WACC. A gearing ratio and dividend policy analysis is done at the end of the
report. The objective of this study is to recommend the client about the reasons for including
this company in an investment portfolio.
About Webster Limited
It is a leading Australia based agriculture company which functions in two segments,
Agriculture and Horticulture. It operates in agriculture sector of Australia and is one of the
largest producer of walnuts that accounts almost 90% of Australia’s annual walnut corp. in
agriculture, the company is one of the largest irrigated farming producers having more than
40000 hectares of fertile land. It mainly focuses on the corn, cotton and other cereals and
livestock. Webster also owns a diverse portfolio of more than 200,000 mega litres of water
entitlement. It is listed on ASX with a symbol ASX: WBA (Webster Limited, 2018).
Structure- ownership and Governance
Main substantial shareholders
More than 20% shareholdings: no shareholder
More than 5% shareholdings: AFF Properties No 1 Pty Ltd (14.41%), Verolot
Limited (8.92%), Peter Robin Joy (8.43%), Belfort Investment Advisors Limited
(5.89%) and Bevan David Cushing (5.60%).
Firm governance
The Chairman: Chris Corrigan (Executive Chairman)
Board Members: David Cushing, Chris Langdon and Mr Joe Robinson (all are non-
executive directors).
The CEO: Maurice Felizzi (Webster Limited, 2018).
Calculating Key ratios
ROA & ROE
Data has been taken for the past three years only, because the annual reports available on
company’s website is for the year 2017 and 2016.
⊘ This is a preview!⊘
Do you want full access?
Subscribe today to unlock all pages.
Trusted by 1+ million students worldwide
Finance 4
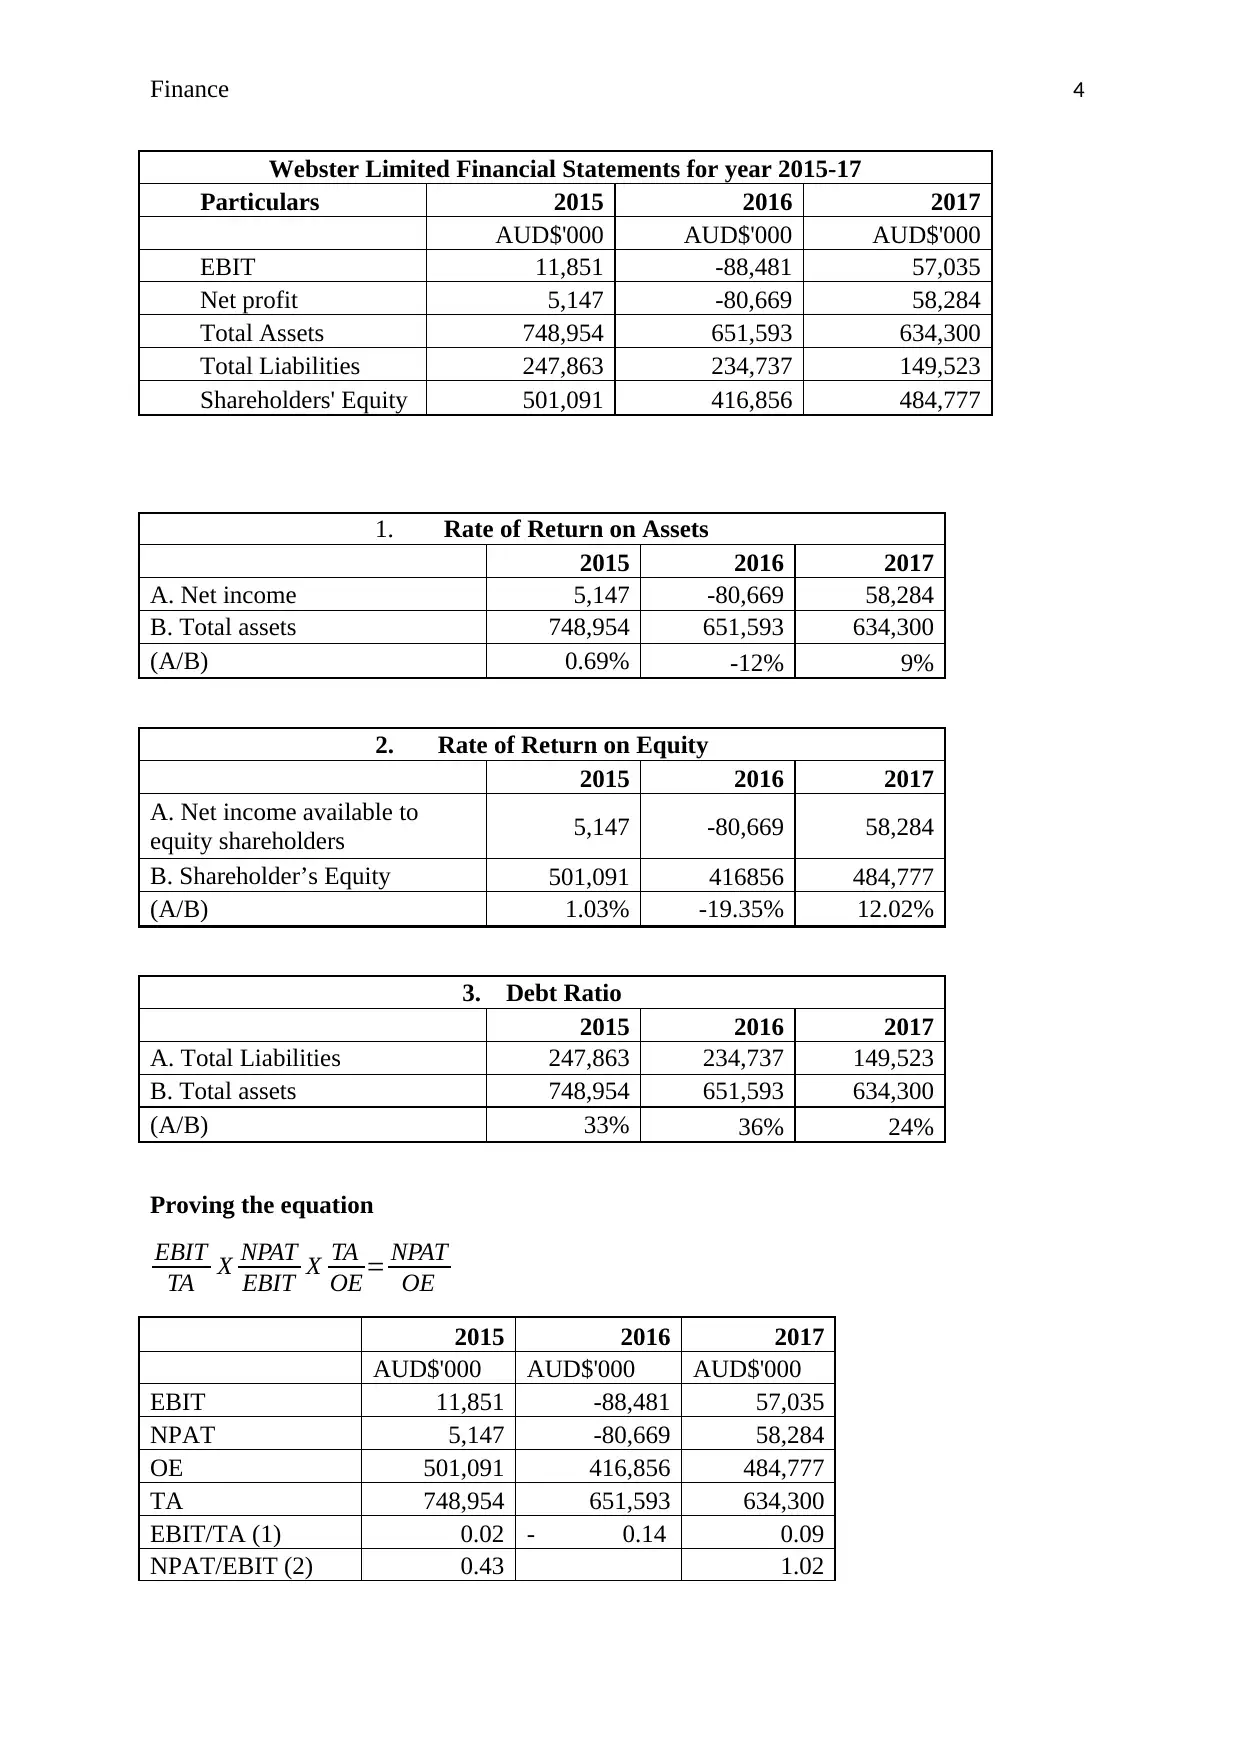
Webster Limited Financial Statements for year 2015-17
Particulars 2015 2016 2017
AUD$'000 AUD$'000 AUD$'000
EBIT 11,851 -88,481 57,035
Net profit 5,147 -80,669 58,284
Total Assets 748,954 651,593 634,300
Total Liabilities 247,863 234,737 149,523
Shareholders' Equity 501,091 416,856 484,777
1. Rate of Return on Assets
2015 2016 2017
A. Net income 5,147 -80,669 58,284
B. Total assets 748,954 651,593 634,300
(A/B) 0.69% -12% 9%
2. Rate of Return on Equity
2015 2016 2017
A. Net income available to
equity shareholders 5,147 -80,669 58,284
B. Shareholder’s Equity 501,091 416856 484,777
(A/B) 1.03% -19.35% 12.02%
3. Debt Ratio
2015 2016 2017
A. Total Liabilities 247,863 234,737 149,523
B. Total assets 748,954 651,593 634,300
(A/B) 33% 36% 24%
Proving the equation
EBIT
TA X NPAT
EBIT X TA
OE = NPAT
OE
2015 2016 2017
AUD$'000 AUD$'000 AUD$'000
EBIT 11,851 -88,481 57,035
NPAT 5,147 -80,669 58,284
OE 501,091 416,856 484,777
TA 748,954 651,593 634,300
EBIT/TA (1) 0.02 - 0.14 0.09
NPAT/EBIT (2) 0.43 1.02
Paraphrase This Document
Need a fresh take? Get an instant paraphrase of this document with our AI Paraphraser
Finance 5
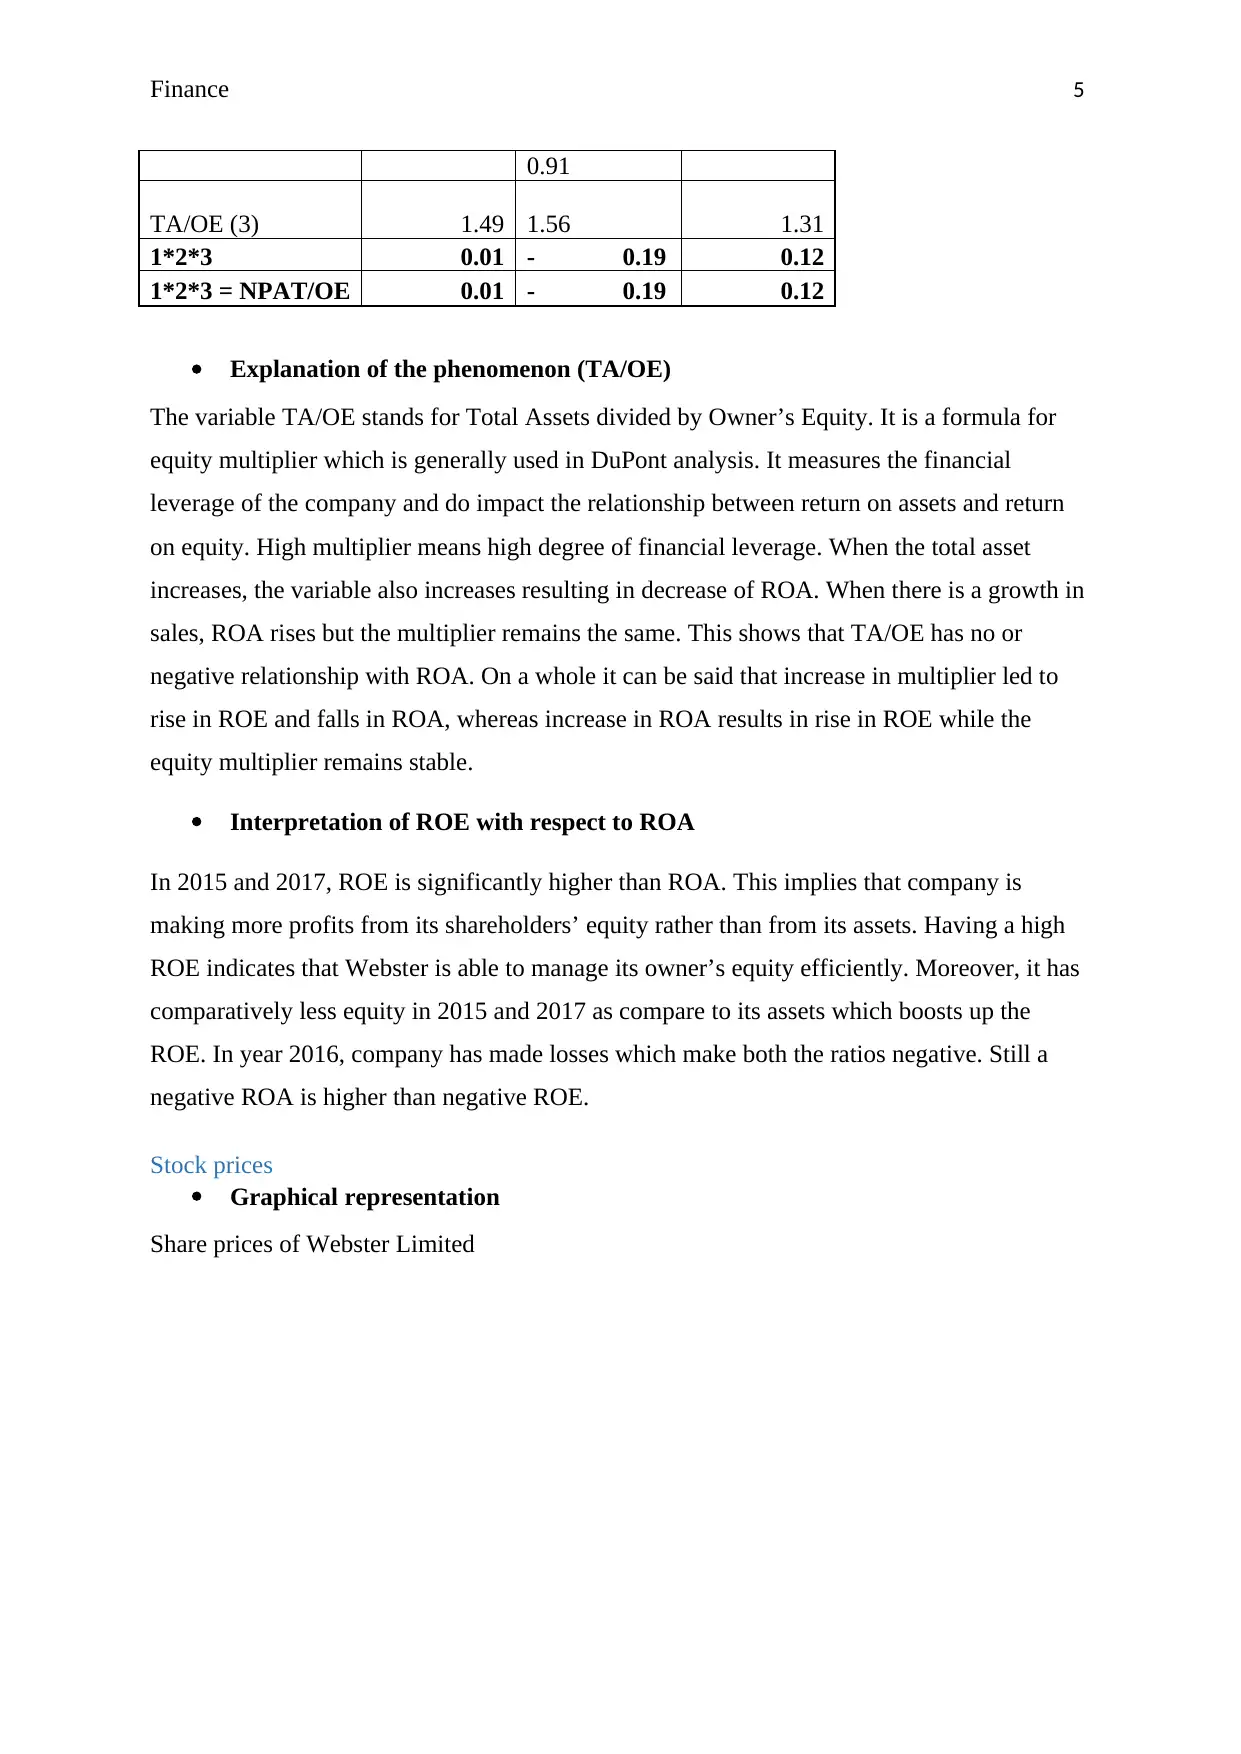
0.91
TA/OE (3) 1.49 1.56 1.31
1*2*3 0.01 - 0.19 0.12
1*2*3 = NPAT/OE 0.01 - 0.19 0.12
Explanation of the phenomenon (TA/OE)
The variable TA/OE stands for Total Assets divided by Owner’s Equity. It is a formula for
equity multiplier which is generally used in DuPont analysis. It measures the financial
leverage of the company and do impact the relationship between return on assets and return
on equity. High multiplier means high degree of financial leverage. When the total asset
increases, the variable also increases resulting in decrease of ROA. When there is a growth in
sales, ROA rises but the multiplier remains the same. This shows that TA/OE has no or
negative relationship with ROA. On a whole it can be said that increase in multiplier led to
rise in ROE and falls in ROA, whereas increase in ROA results in rise in ROE while the
equity multiplier remains stable.
Interpretation of ROE with respect to ROA
In 2015 and 2017, ROE is significantly higher than ROA. This implies that company is
making more profits from its shareholders’ equity rather than from its assets. Having a high
ROE indicates that Webster is able to manage its owner’s equity efficiently. Moreover, it has
comparatively less equity in 2015 and 2017 as compare to its assets which boosts up the
ROE. In year 2016, company has made losses which make both the ratios negative. Still a
negative ROA is higher than negative ROE.
Stock prices
Graphical representation
Share prices of Webster Limited
Finance 6
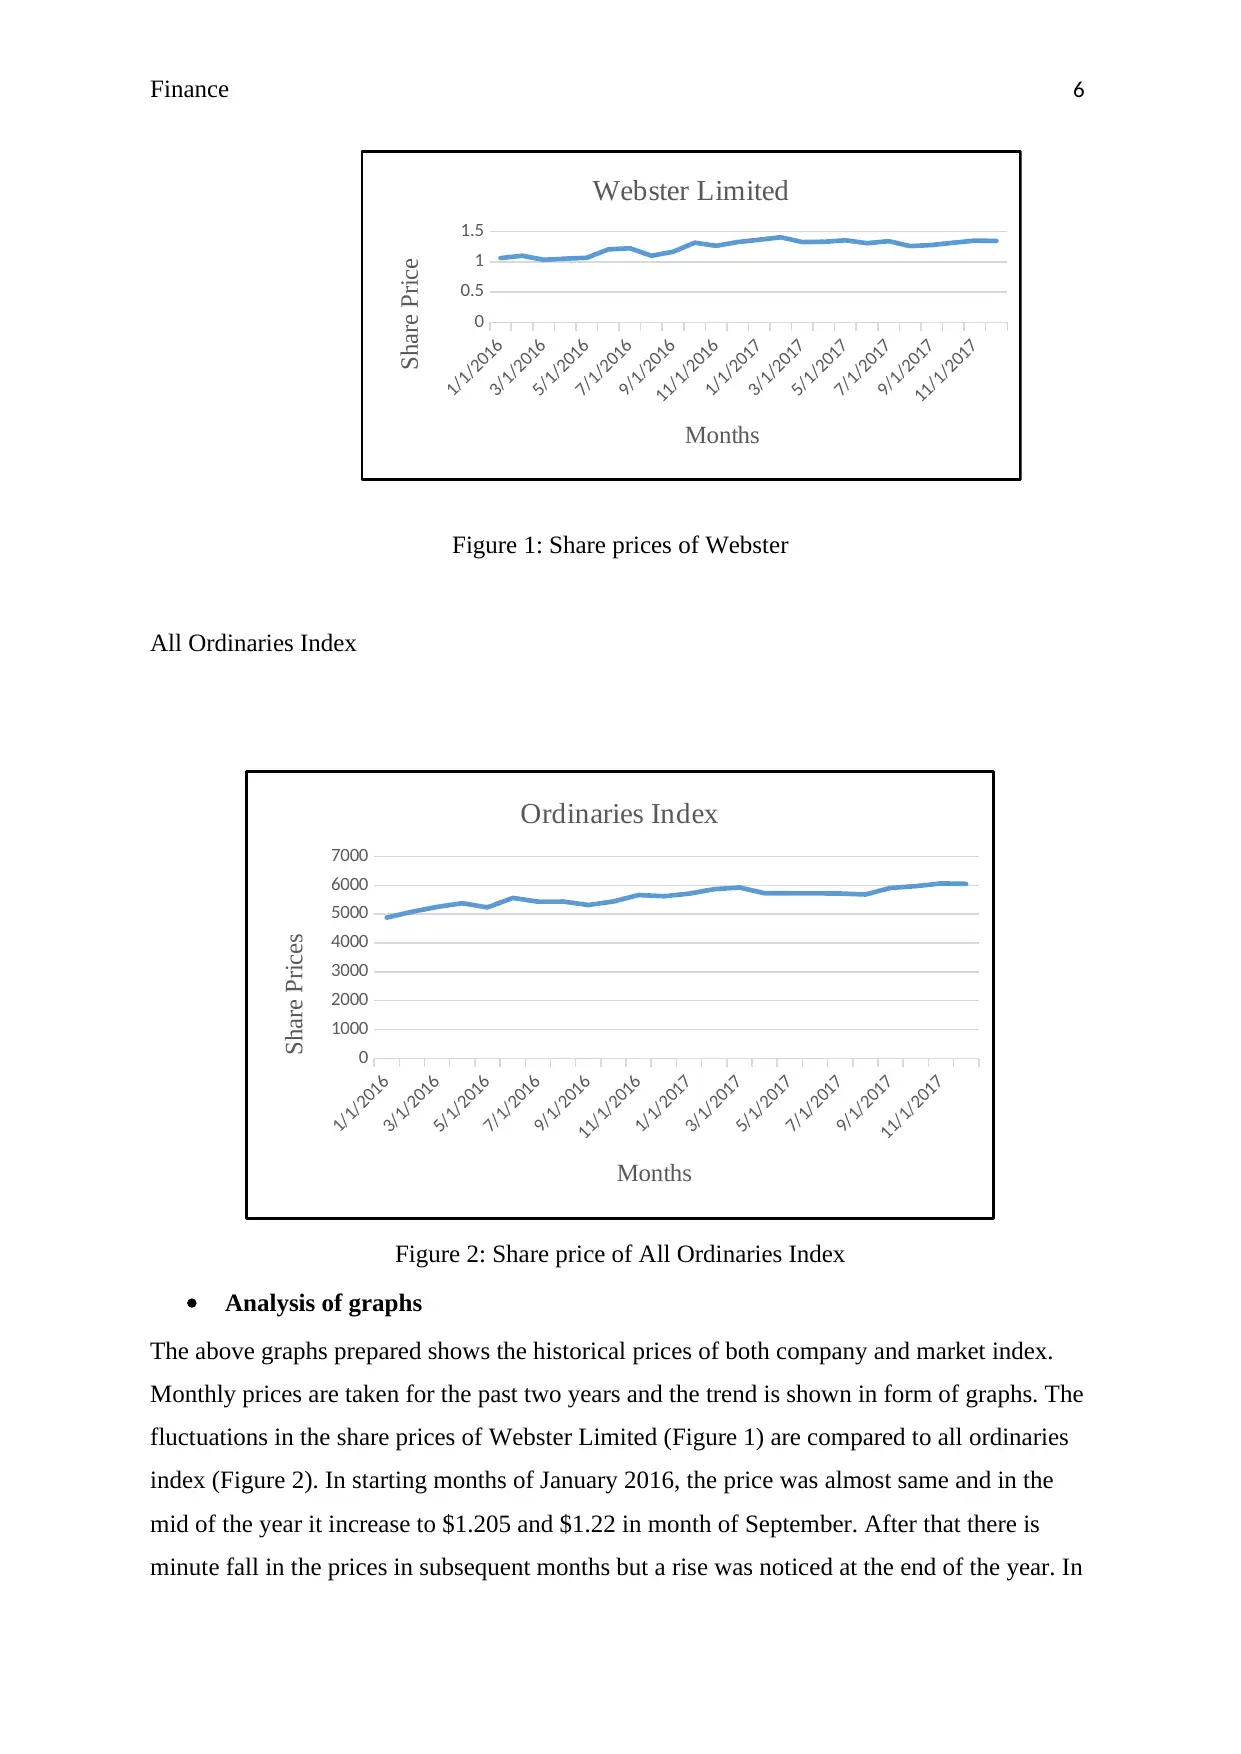
Figure 1: Share prices of Webster
All Ordinaries Index
1/1/2016
3/1/2016
5/1/2016
7/1/2016
9/1/2016
11/1/2016
1/1/2017
3/1/2017
5/1/2017
7/1/2017
9/1/2017
11/1/2017
0
1000
2000
3000
4000
5000
6000
7000
Ordinaries Index
Months
Share Prices
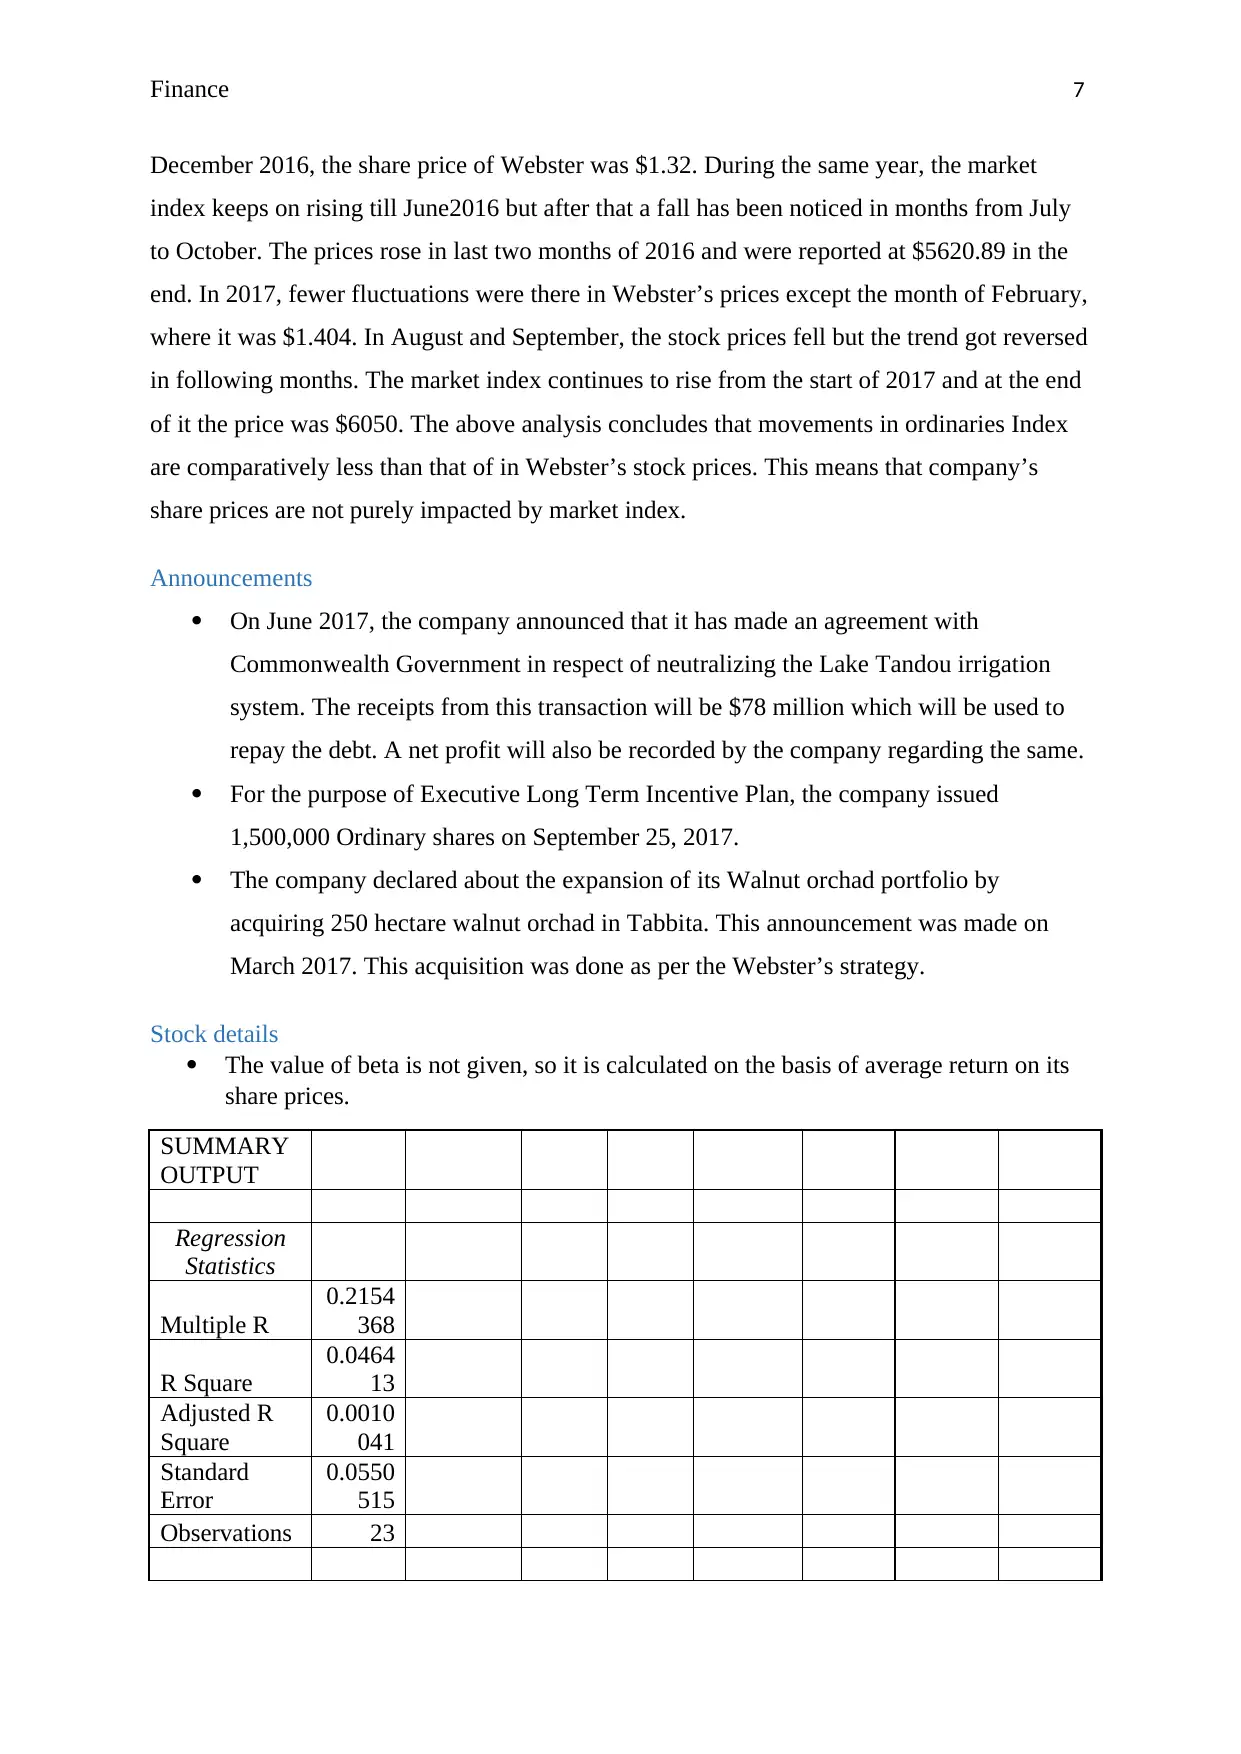
Figure 2: Share price of All Ordinaries Index
Analysis of graphs
The above graphs prepared shows the historical prices of both company and market index.
Monthly prices are taken for the past two years and the trend is shown in form of graphs. The
fluctuations in the share prices of Webster Limited (Figure 1) are compared to all ordinaries
index (Figure 2). In starting months of January 2016, the price was almost same and in the
mid of the year it increase to $1.205 and $1.22 in month of September. After that there is
minute fall in the prices in subsequent months but a rise was noticed at the end of the year. In
1/1/2016
3/1/2016
5/1/2016
7/1/2016
9/1/2016
11/1/2016
1/1/2017
3/1/2017
5/1/2017
7/1/2017
9/1/2017
11/1/2017
0
0.5
1
1.5
Webster Limited
Months
Share Price
Figure 1: Share prices of Webster
All Ordinaries Index
1/1/2016
3/1/2016
5/1/2016
7/1/2016
9/1/2016
11/1/2016
1/1/2017
3/1/2017
5/1/2017
7/1/2017
9/1/2017
11/1/2017
0
1000
2000
3000
4000
5000
6000
7000
Ordinaries Index
Months
Share Prices
Figure 2: Share price of All Ordinaries Index
Analysis of graphs
The above graphs prepared shows the historical prices of both company and market index.
Monthly prices are taken for the past two years and the trend is shown in form of graphs. The
fluctuations in the share prices of Webster Limited (Figure 1) are compared to all ordinaries
index (Figure 2). In starting months of January 2016, the price was almost same and in the
mid of the year it increase to $1.205 and $1.22 in month of September. After that there is
minute fall in the prices in subsequent months but a rise was noticed at the end of the year. In
1/1/2016
3/1/2016
5/1/2016
7/1/2016
9/1/2016
11/1/2016
1/1/2017
3/1/2017
5/1/2017
7/1/2017
9/1/2017
11/1/2017
0
0.5
1
1.5
Webster Limited
Months
Share Price
⊘ This is a preview!⊘
Do you want full access?
Subscribe today to unlock all pages.
Trusted by 1+ million students worldwide
Finance 7
December 2016, the share price of Webster was $1.32. During the same year, the market
index keeps on rising till June2016 but after that a fall has been noticed in months from July
to October. The prices rose in last two months of 2016 and were reported at $5620.89 in the
end. In 2017, fewer fluctuations were there in Webster’s prices except the month of February,
where it was $1.404. In August and September, the stock prices fell but the trend got reversed
in following months. The market index continues to rise from the start of 2017 and at the end
of it the price was $6050. The above analysis concludes that movements in ordinaries Index
are comparatively less than that of in Webster’s stock prices. This means that company’s
share prices are not purely impacted by market index.
Announcements
On June 2017, the company announced that it has made an agreement with
Commonwealth Government in respect of neutralizing the Lake Tandou irrigation
system. The receipts from this transaction will be $78 million which will be used to
repay the debt. A net profit will also be recorded by the company regarding the same.
For the purpose of Executive Long Term Incentive Plan, the company issued
1,500,000 Ordinary shares on September 25, 2017.
The company declared about the expansion of its Walnut orchad portfolio by
acquiring 250 hectare walnut orchad in Tabbita. This announcement was made on
March 2017. This acquisition was done as per the Webster’s strategy.
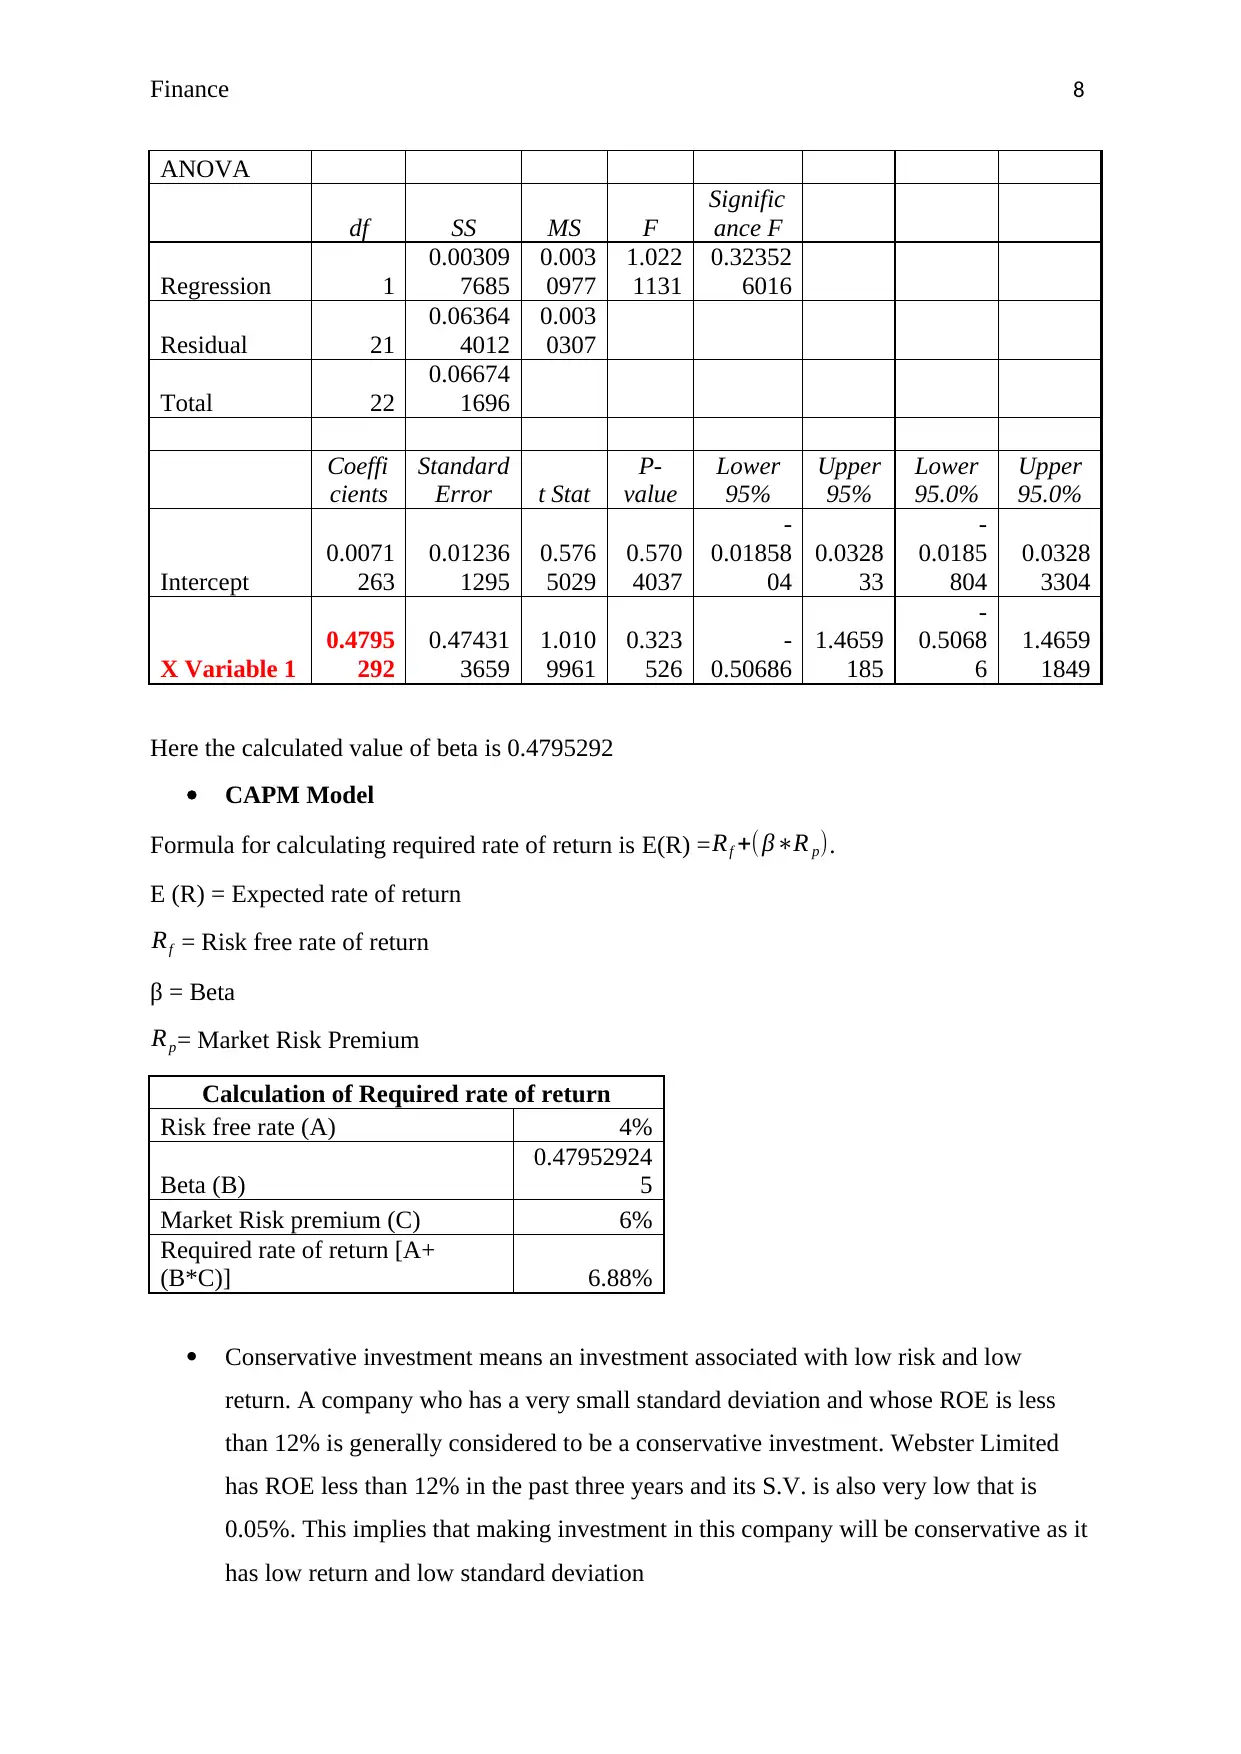
Stock details
The value of beta is not given, so it is calculated on the basis of average return on its
share prices.
SUMMARY
OUTPUT
Regression
Statistics
Multiple R
0.2154
368
R Square
0.0464
13
Adjusted R
Square
0.0010
041
Standard
Error
0.0550
515
Observations 23
December 2016, the share price of Webster was $1.32. During the same year, the market
index keeps on rising till June2016 but after that a fall has been noticed in months from July
to October. The prices rose in last two months of 2016 and were reported at $5620.89 in the
end. In 2017, fewer fluctuations were there in Webster’s prices except the month of February,
where it was $1.404. In August and September, the stock prices fell but the trend got reversed
in following months. The market index continues to rise from the start of 2017 and at the end
of it the price was $6050. The above analysis concludes that movements in ordinaries Index
are comparatively less than that of in Webster’s stock prices. This means that company’s
share prices are not purely impacted by market index.
Announcements
On June 2017, the company announced that it has made an agreement with
Commonwealth Government in respect of neutralizing the Lake Tandou irrigation
system. The receipts from this transaction will be $78 million which will be used to
repay the debt. A net profit will also be recorded by the company regarding the same.
For the purpose of Executive Long Term Incentive Plan, the company issued
1,500,000 Ordinary shares on September 25, 2017.
The company declared about the expansion of its Walnut orchad portfolio by
acquiring 250 hectare walnut orchad in Tabbita. This announcement was made on
March 2017. This acquisition was done as per the Webster’s strategy.
Stock details
The value of beta is not given, so it is calculated on the basis of average return on its
share prices.
SUMMARY
OUTPUT
Regression
Statistics
Multiple R
0.2154
368
R Square
0.0464
13
Adjusted R
Square
0.0010
041
Standard
Error
0.0550
515
Observations 23
Paraphrase This Document
Need a fresh take? Get an instant paraphrase of this document with our AI Paraphraser
Finance 8
ANOVA
df SS MS F
Signific
ance F
Regression 1
0.00309
7685
0.003
0977
1.022
1131
0.32352
6016
Residual 21
0.06364
4012
0.003
0307
Total 22
0.06674
1696
Coeffi
cients
Standard
Error t Stat
P-
value
Lower
95%
Upper
95%
Lower
95.0%
Upper
95.0%
Intercept
0.0071
263
0.01236
1295
0.576
5029
0.570
4037
-
0.01858
04
0.0328
33
-
0.0185
804
0.0328
3304
X Variable 1
0.4795
292
0.47431
3659
1.010
9961
0.323
526
-
0.50686
1.4659
185
-
0.5068
6
1.4659
1849
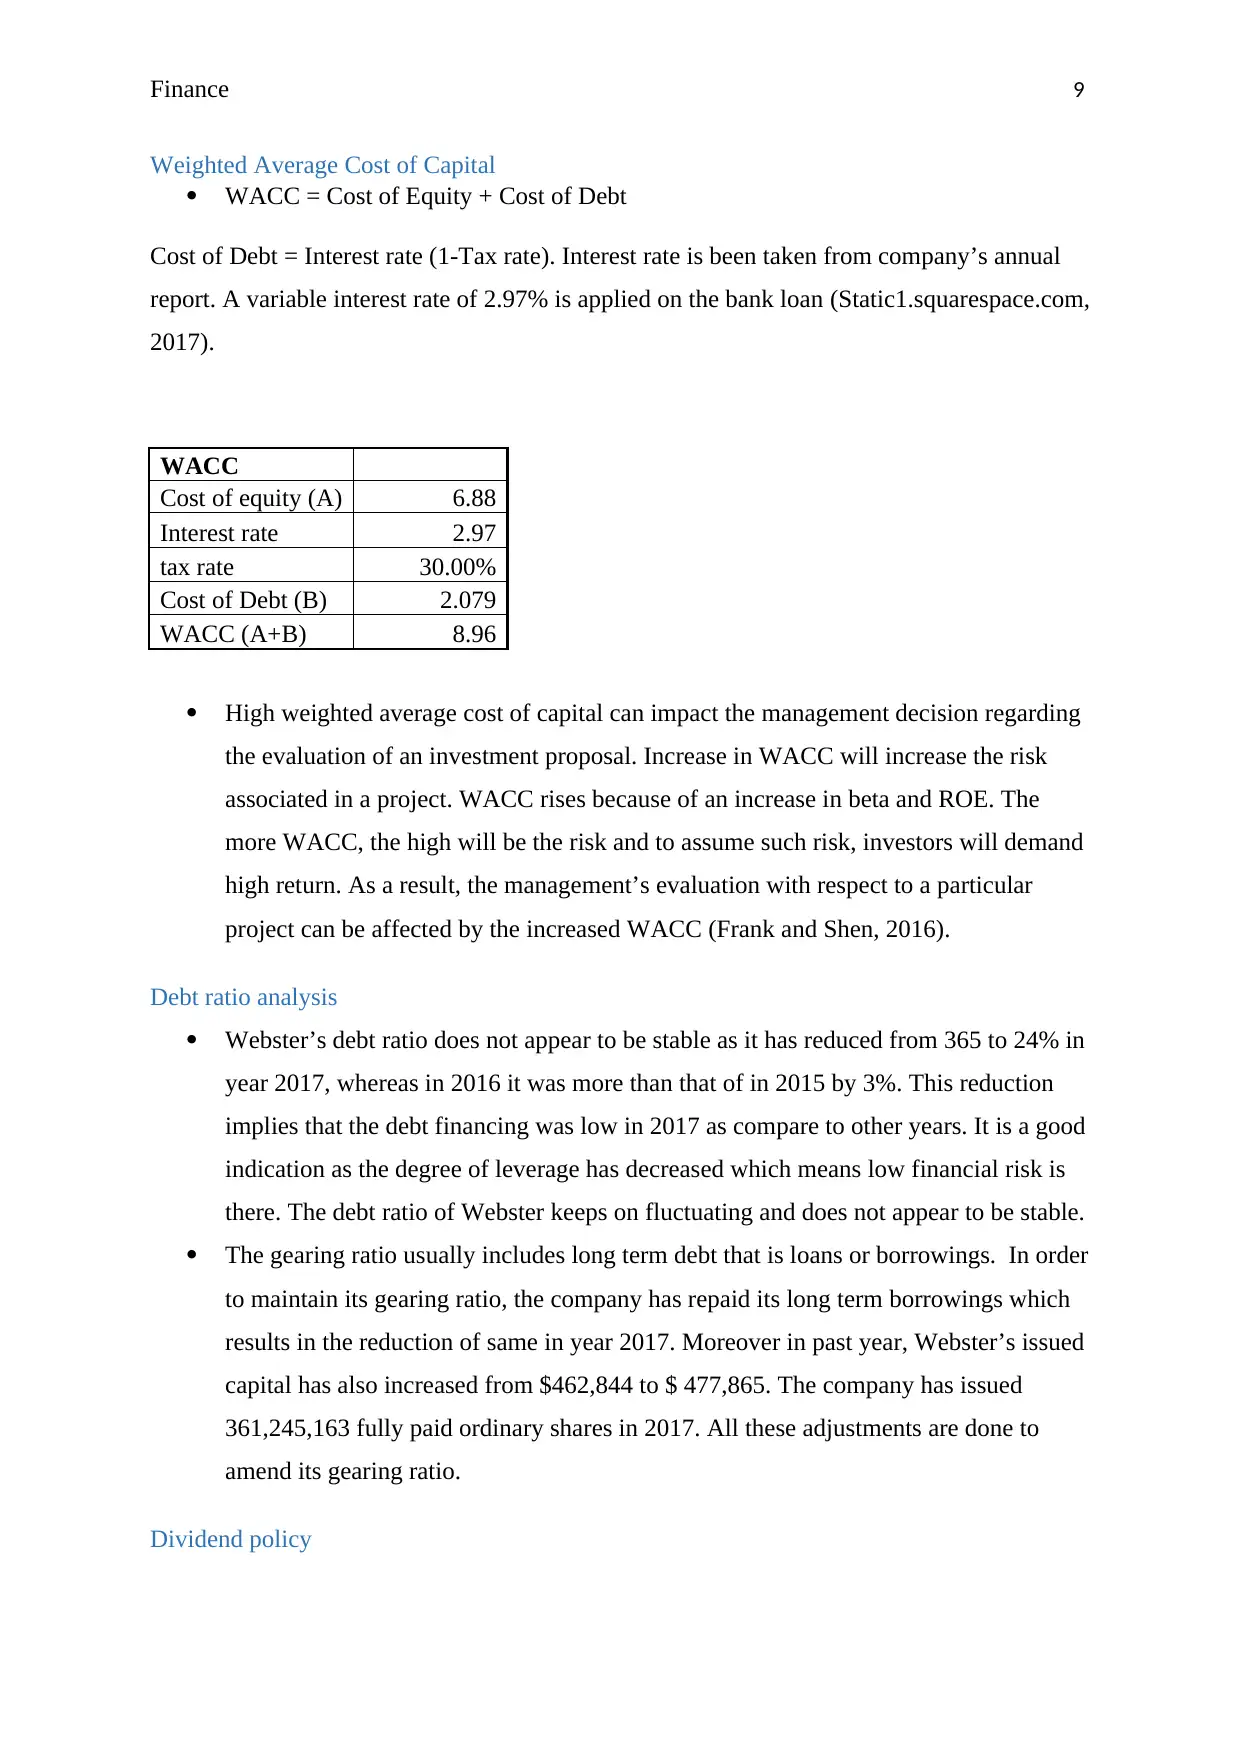
Here the calculated value of beta is 0.4795292
CAPM Model
Formula for calculating required rate of return is E(R) = Rf +(β∗R p).
E (R) = Expected rate of return
Rf = Risk free rate of return
β = Beta
Rp= Market Risk Premium
Calculation of Required rate of return
Risk free rate (A) 4%
Beta (B)
0.47952924
5
Market Risk premium (C) 6%
Required rate of return [A+
(B*C)] 6.88%
Conservative investment means an investment associated with low risk and low
return. A company who has a very small standard deviation and whose ROE is less
than 12% is generally considered to be a conservative investment. Webster Limited
has ROE less than 12% in the past three years and its S.V. is also very low that is
0.05%. This implies that making investment in this company will be conservative as it
has low return and low standard deviation
ANOVA
df SS MS F
Signific
ance F
Regression 1
0.00309
7685
0.003
0977
1.022
1131
0.32352
6016
Residual 21
0.06364
4012
0.003
0307
Total 22
0.06674
1696
Coeffi
cients
Standard
Error t Stat
P-
value
Lower
95%
Upper
95%
Lower
95.0%
Upper
95.0%
Intercept
0.0071
263
0.01236
1295
0.576
5029
0.570
4037
-
0.01858
04
0.0328
33
-
0.0185
804
0.0328
3304
X Variable 1
0.4795
292
0.47431
3659
1.010
9961
0.323
526
-
0.50686
1.4659
185
-
0.5068
6
1.4659
1849
Here the calculated value of beta is 0.4795292
CAPM Model
Formula for calculating required rate of return is E(R) = Rf +(β∗R p).
E (R) = Expected rate of return
Rf = Risk free rate of return
β = Beta
Rp= Market Risk Premium
Calculation of Required rate of return
Risk free rate (A) 4%
Beta (B)
0.47952924
5
Market Risk premium (C) 6%
Required rate of return [A+
(B*C)] 6.88%
Conservative investment means an investment associated with low risk and low
return. A company who has a very small standard deviation and whose ROE is less
than 12% is generally considered to be a conservative investment. Webster Limited
has ROE less than 12% in the past three years and its S.V. is also very low that is
0.05%. This implies that making investment in this company will be conservative as it
has low return and low standard deviation
Finance 9
Weighted Average Cost of Capital
WACC = Cost of Equity + Cost of Debt
Cost of Debt = Interest rate (1-Tax rate). Interest rate is been taken from company’s annual
report. A variable interest rate of 2.97% is applied on the bank loan (Static1.squarespace.com,
2017).
WACC
Cost of equity (A) 6.88
Interest rate 2.97
tax rate 30.00%
Cost of Debt (B) 2.079
WACC (A+B) 8.96
High weighted average cost of capital can impact the management decision regarding
the evaluation of an investment proposal. Increase in WACC will increase the risk
associated in a project. WACC rises because of an increase in beta and ROE. The
more WACC, the high will be the risk and to assume such risk, investors will demand
high return. As a result, the management’s evaluation with respect to a particular
project can be affected by the increased WACC (Frank and Shen, 2016).
Debt ratio analysis
Webster’s debt ratio does not appear to be stable as it has reduced from 365 to 24% in
year 2017, whereas in 2016 it was more than that of in 2015 by 3%. This reduction
implies that the debt financing was low in 2017 as compare to other years. It is a good
indication as the degree of leverage has decreased which means low financial risk is
there. The debt ratio of Webster keeps on fluctuating and does not appear to be stable.
The gearing ratio usually includes long term debt that is loans or borrowings. In order
to maintain its gearing ratio, the company has repaid its long term borrowings which
results in the reduction of same in year 2017. Moreover in past year, Webster’s issued
capital has also increased from $462,844 to $ 477,865. The company has issued
361,245,163 fully paid ordinary shares in 2017. All these adjustments are done to
amend its gearing ratio.
Dividend policy
⊘ This is a preview!⊘
Do you want full access?
Subscribe today to unlock all pages.
Trusted by 1+ million students worldwide
Finance
10
Dividend is generally paid out of the retained earnings of a company. There are four types of
policies named as regular, irregular, and stable and no dividend policy. The company is
paying a regular dividend from the past five years but not at a fixed rate. In 2016, it declares a
dividend of 1 cent per share (cps) and in 2017 it was 3 cps. The rate of dividend varies
according to the profits and earnings of the company. As in last year company has made
profits compare to 2016, the dividend declared were higher.
Recommendation letter
From the above analysis, it can be said that company is performing pretty well on financial
grounds. Its debt ratio has decreased, equity return has increased and moreover it follows a
regular dividend policy. Apart from that, it also considered as a conservative investment. It
will be favourable for the investors to invest in such company especially for the ones who are
not ready to take high risk. So, on a whole, Webster Limited can be included in the
investment portfolio.
Paraphrase This Document
Need a fresh take? Get an instant paraphrase of this document with our AI Paraphraser
Finance
11
References
Frank, M.Z. and Shen, T., 2016. Investment and the weighted average cost of capital. Journal
of Financial Economics, 119(2), pp.300-315.
Static1.squarespace.com. (2017). Annual Report 2017. [online] Available at:
https://static1.squarespace.com/static/5770b8d4b8a79bc1087f2cfc/t/
5a0e600dec212d62c91ee242/1510891602830/Webster_AR_LR-links.pdf [Accessed 29 Jan.
2018].
Webster Limited. (2018). Welcome. [online] Available at: http://www.websterltd.com.au/
[Accessed 29 Jan. 2018].
1 out of 11
Related Documents


Your All-in-One AI-Powered Toolkit for Academic Success.
+13062052269
info@desklib.com
Available 24*7 on WhatsApp / Email
![[object Object]](/_next/static/media/star-bottom.7253800d.svg)
Unlock your academic potential
Copyright © 2020–2026 A2Z Services. All Rights Reserved. Developed and managed by ZUCOL.