University Finance Report: Crude Oil Futures and Options Analysis
VerifiedAdded on 2021/04/17
|12
|1637
|24
Report
AI Summary
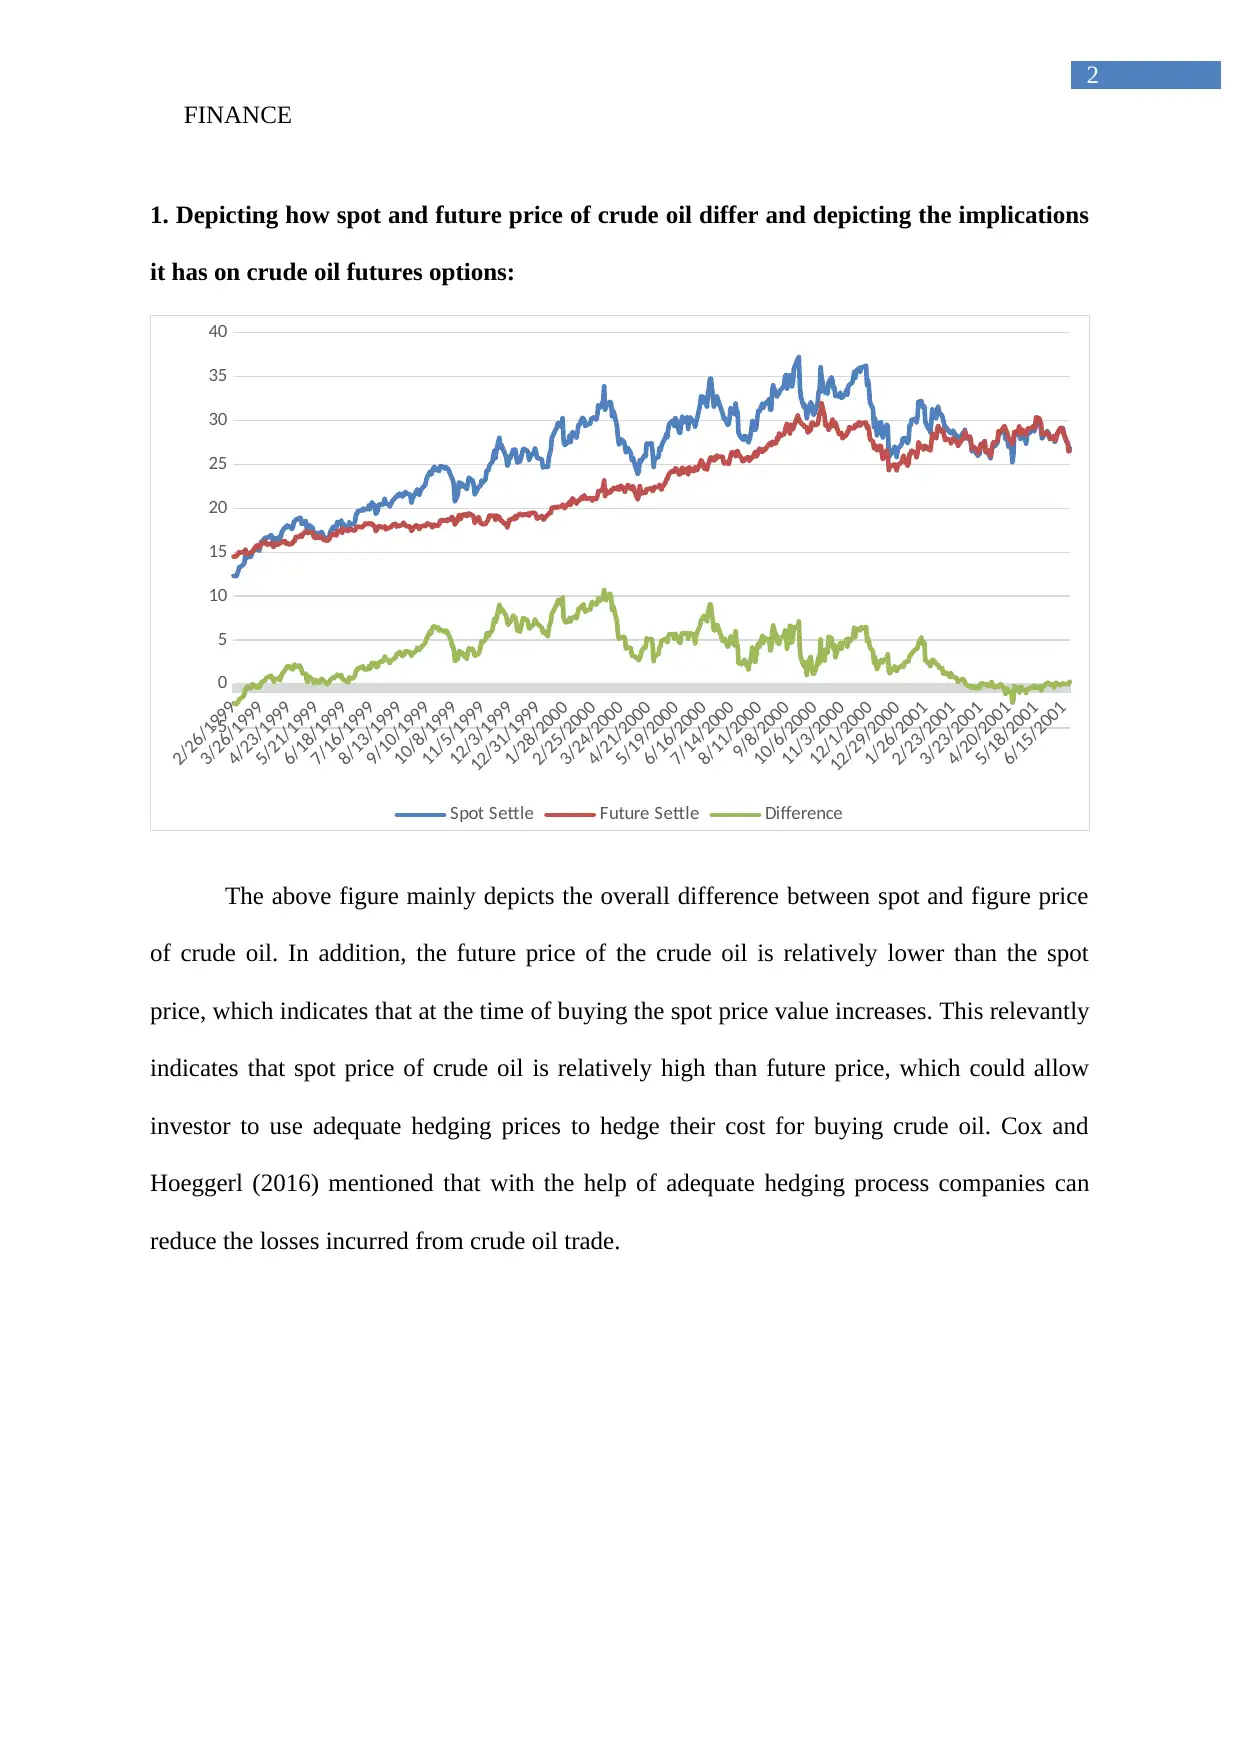
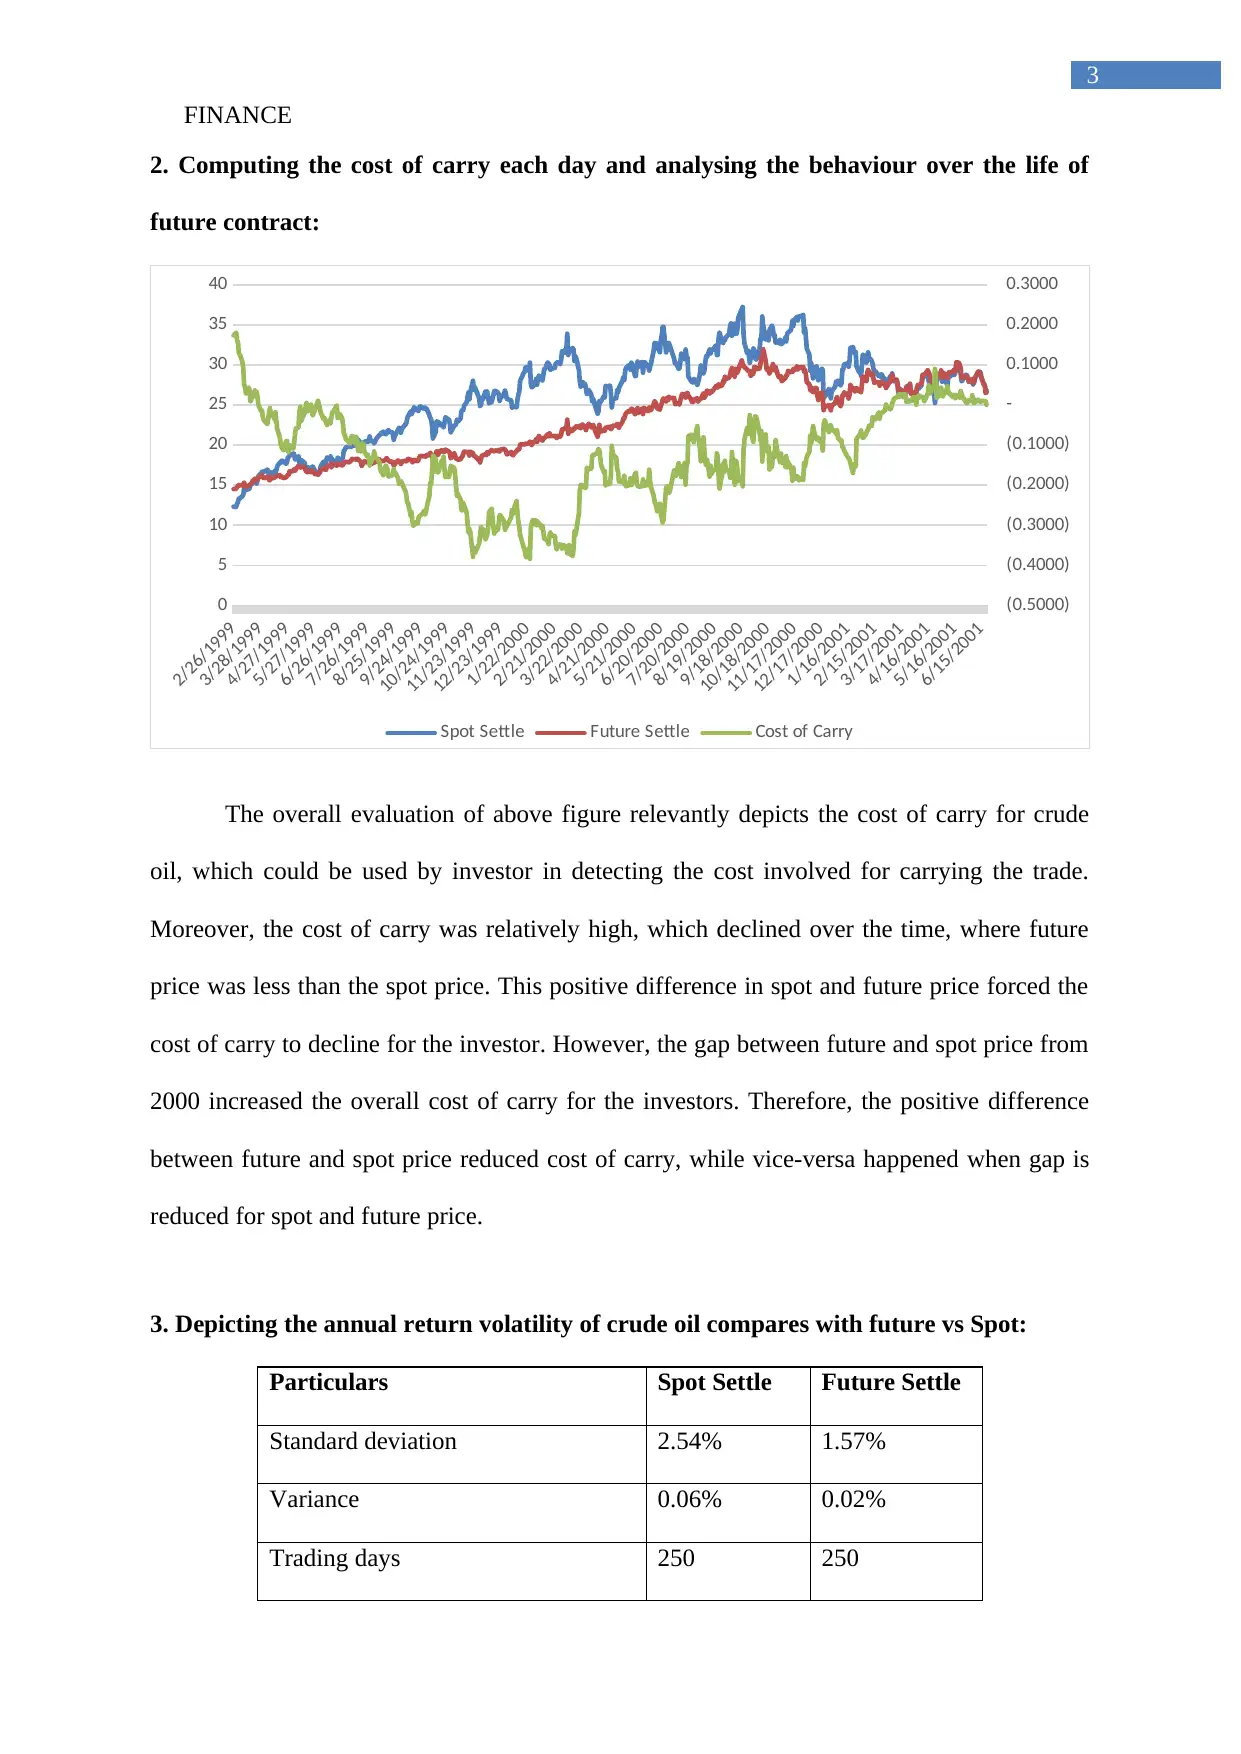
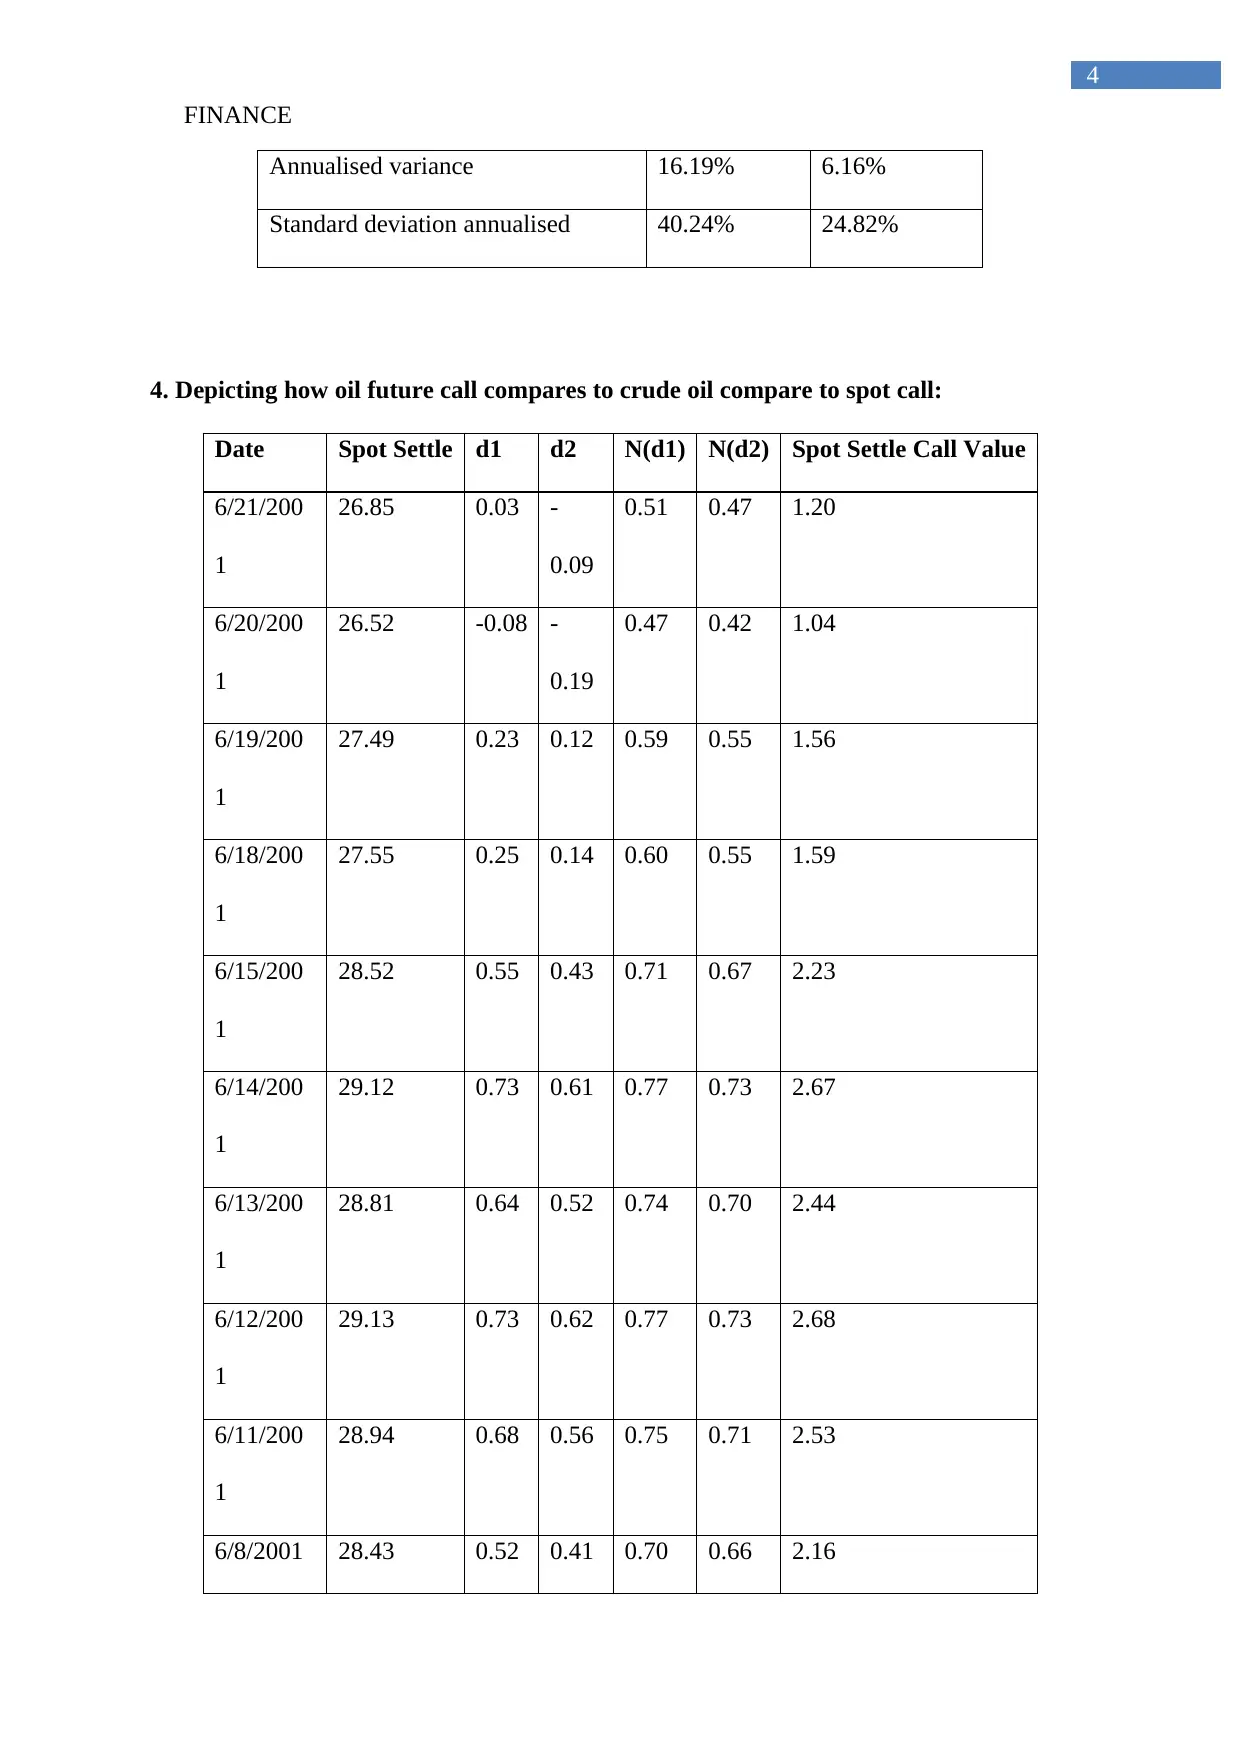
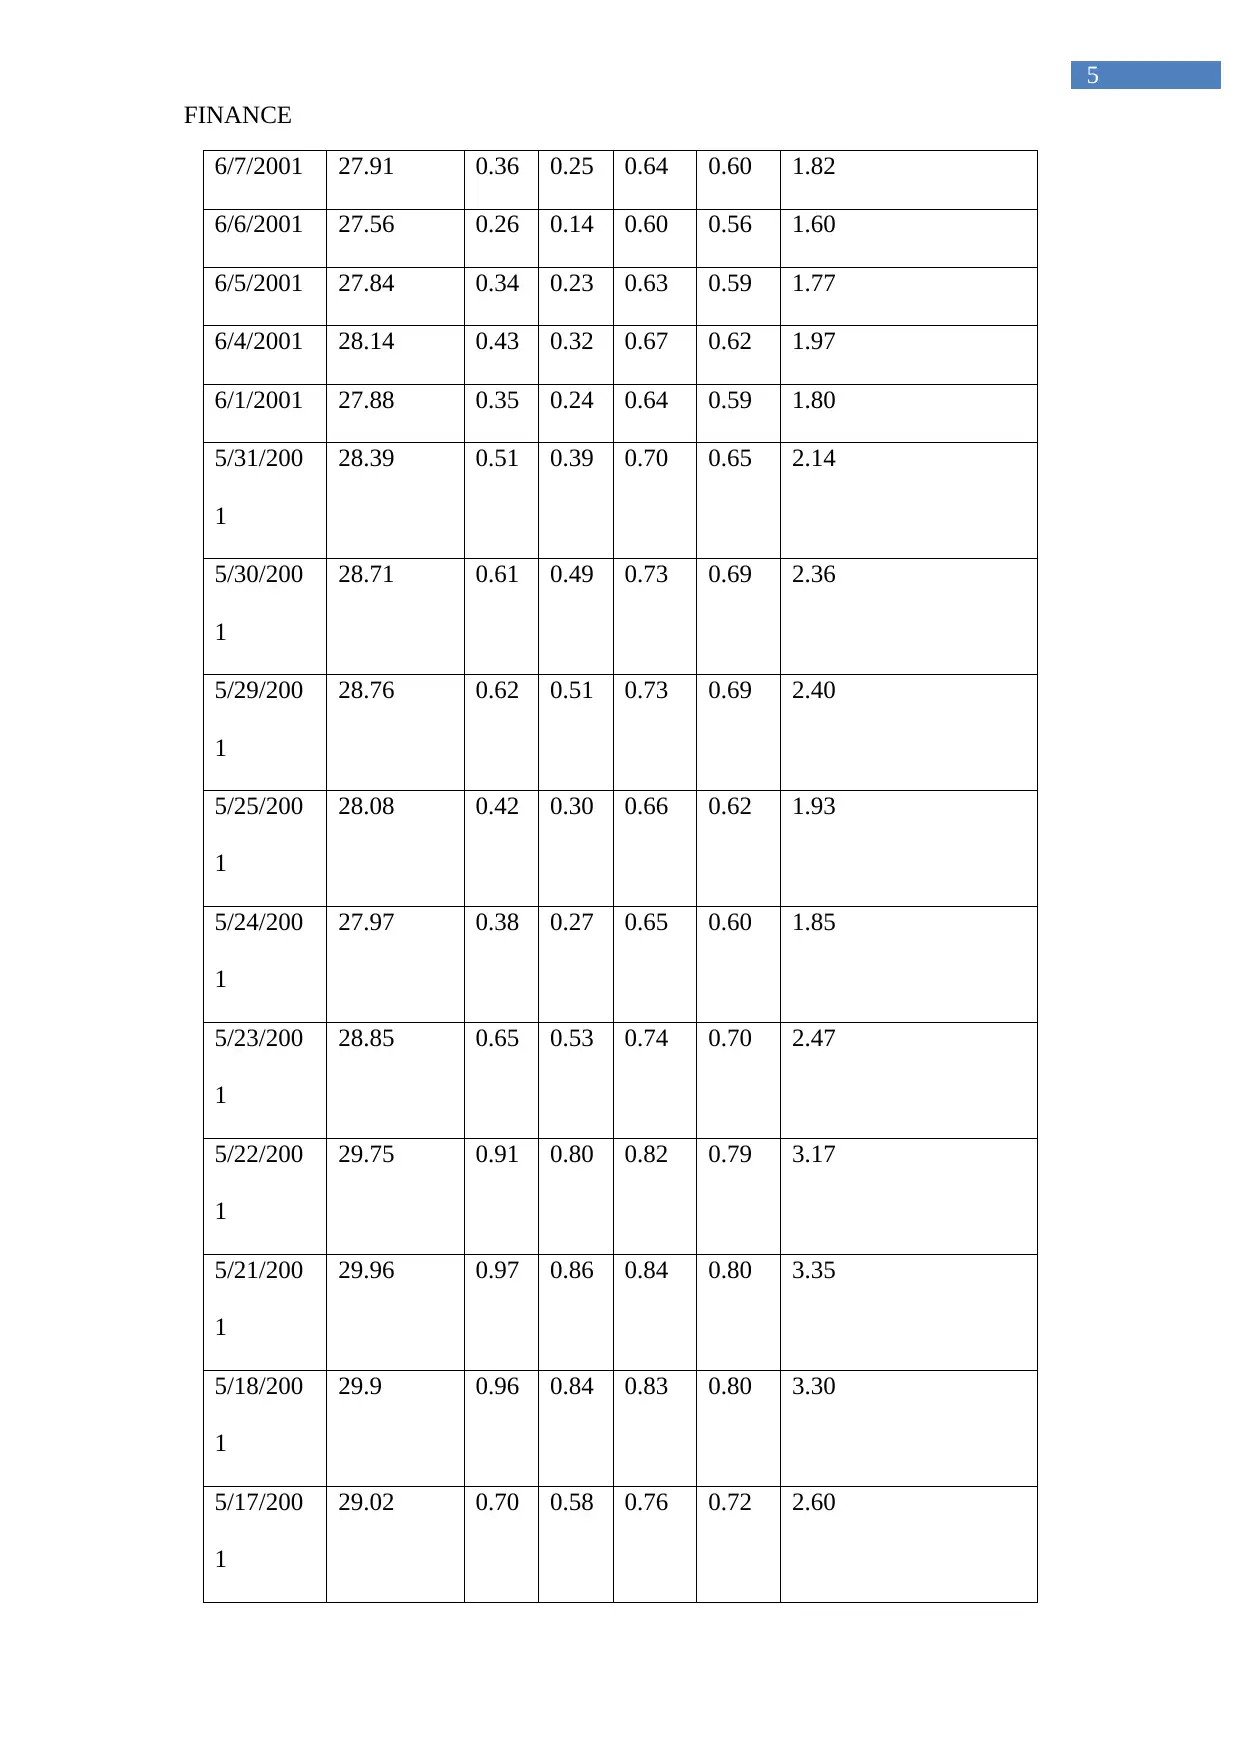
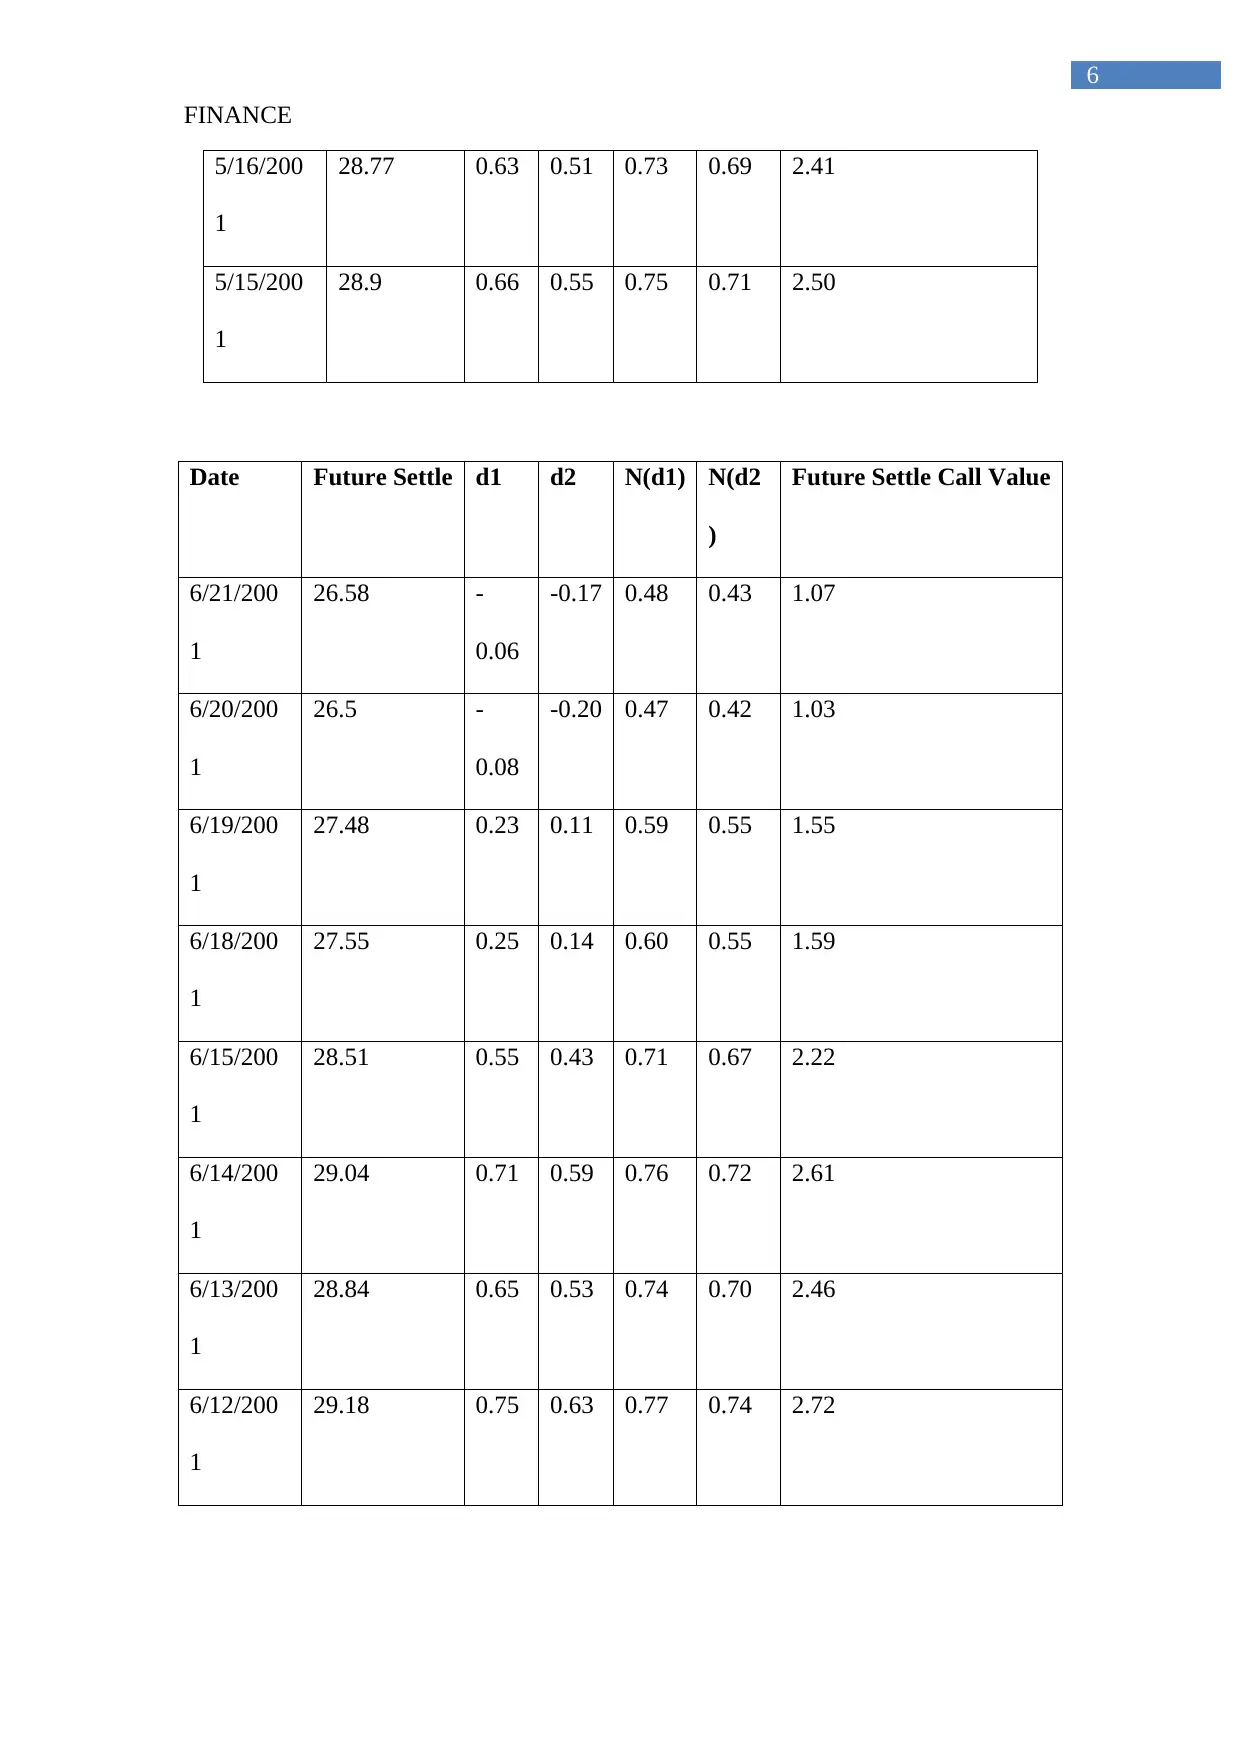
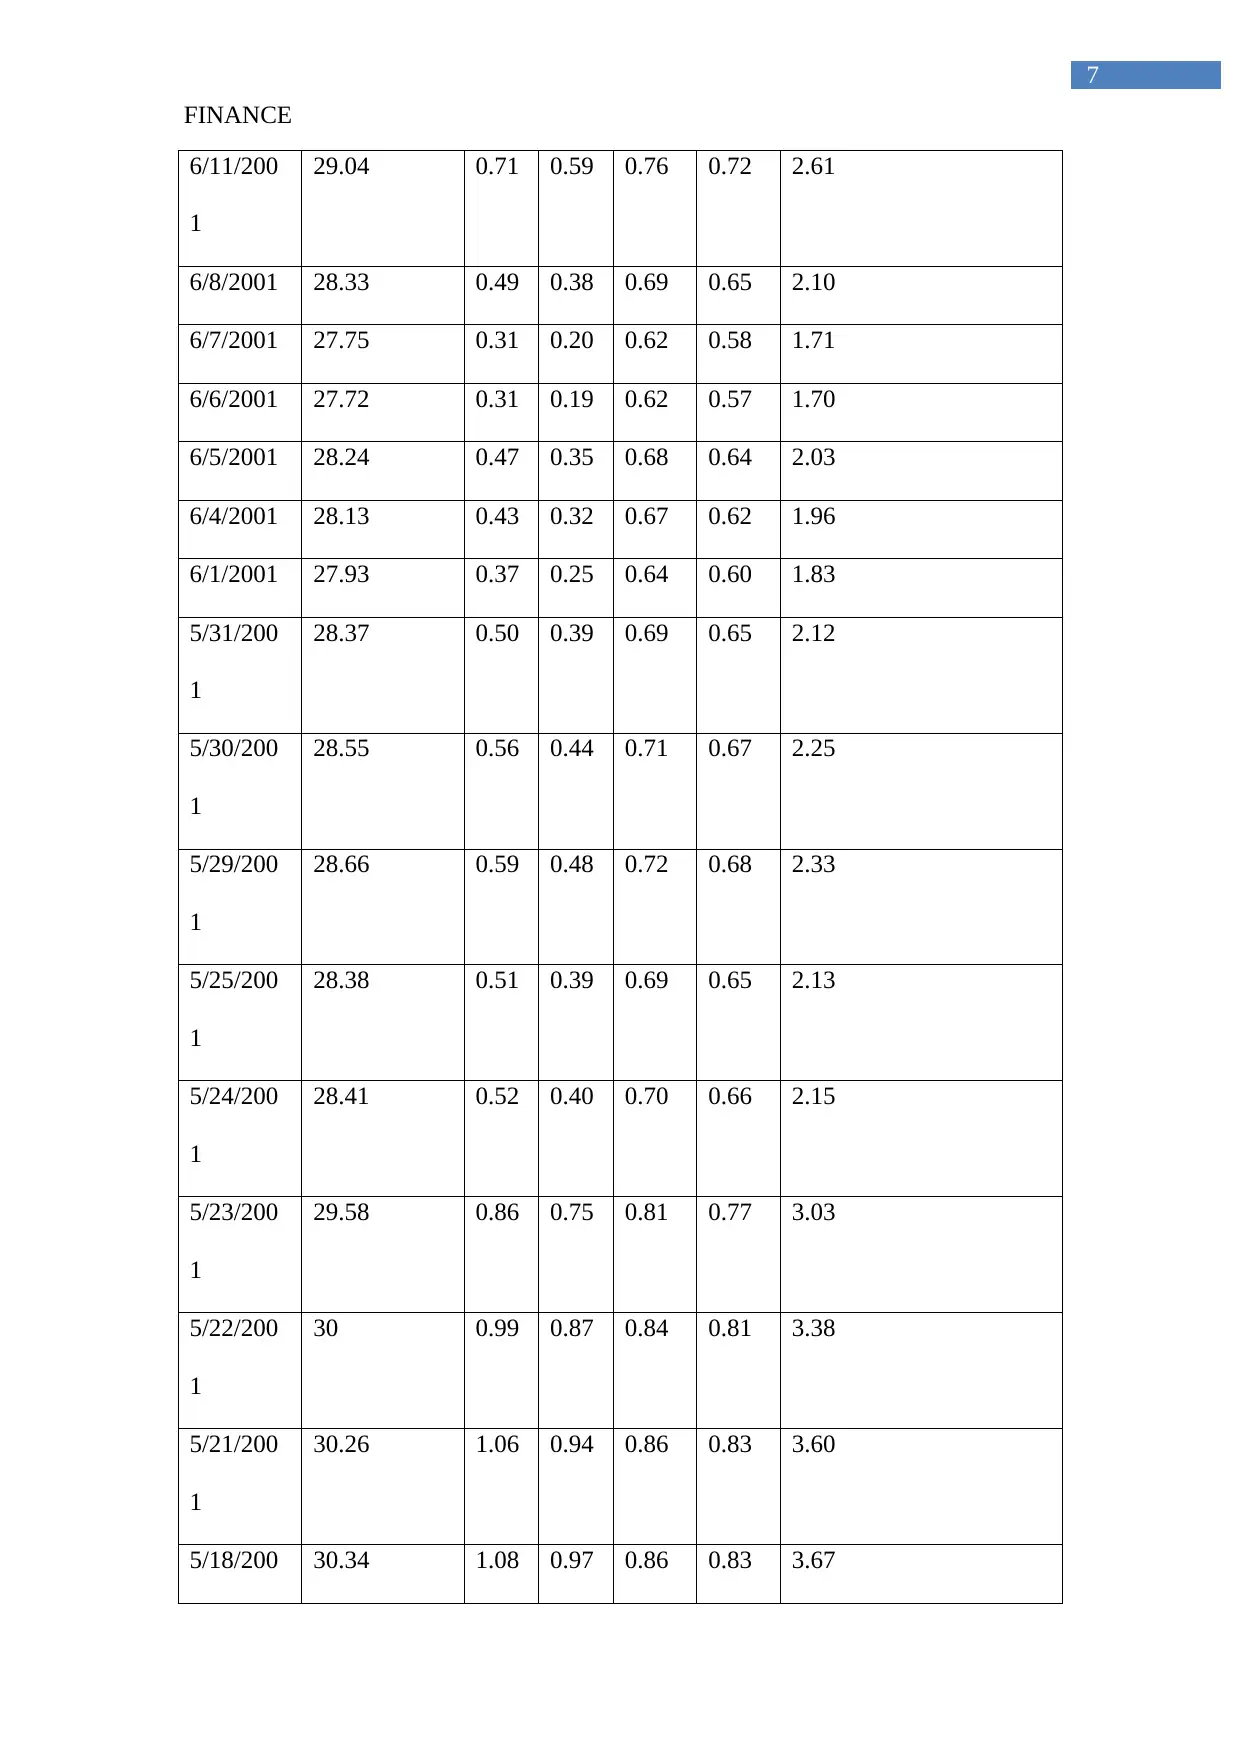
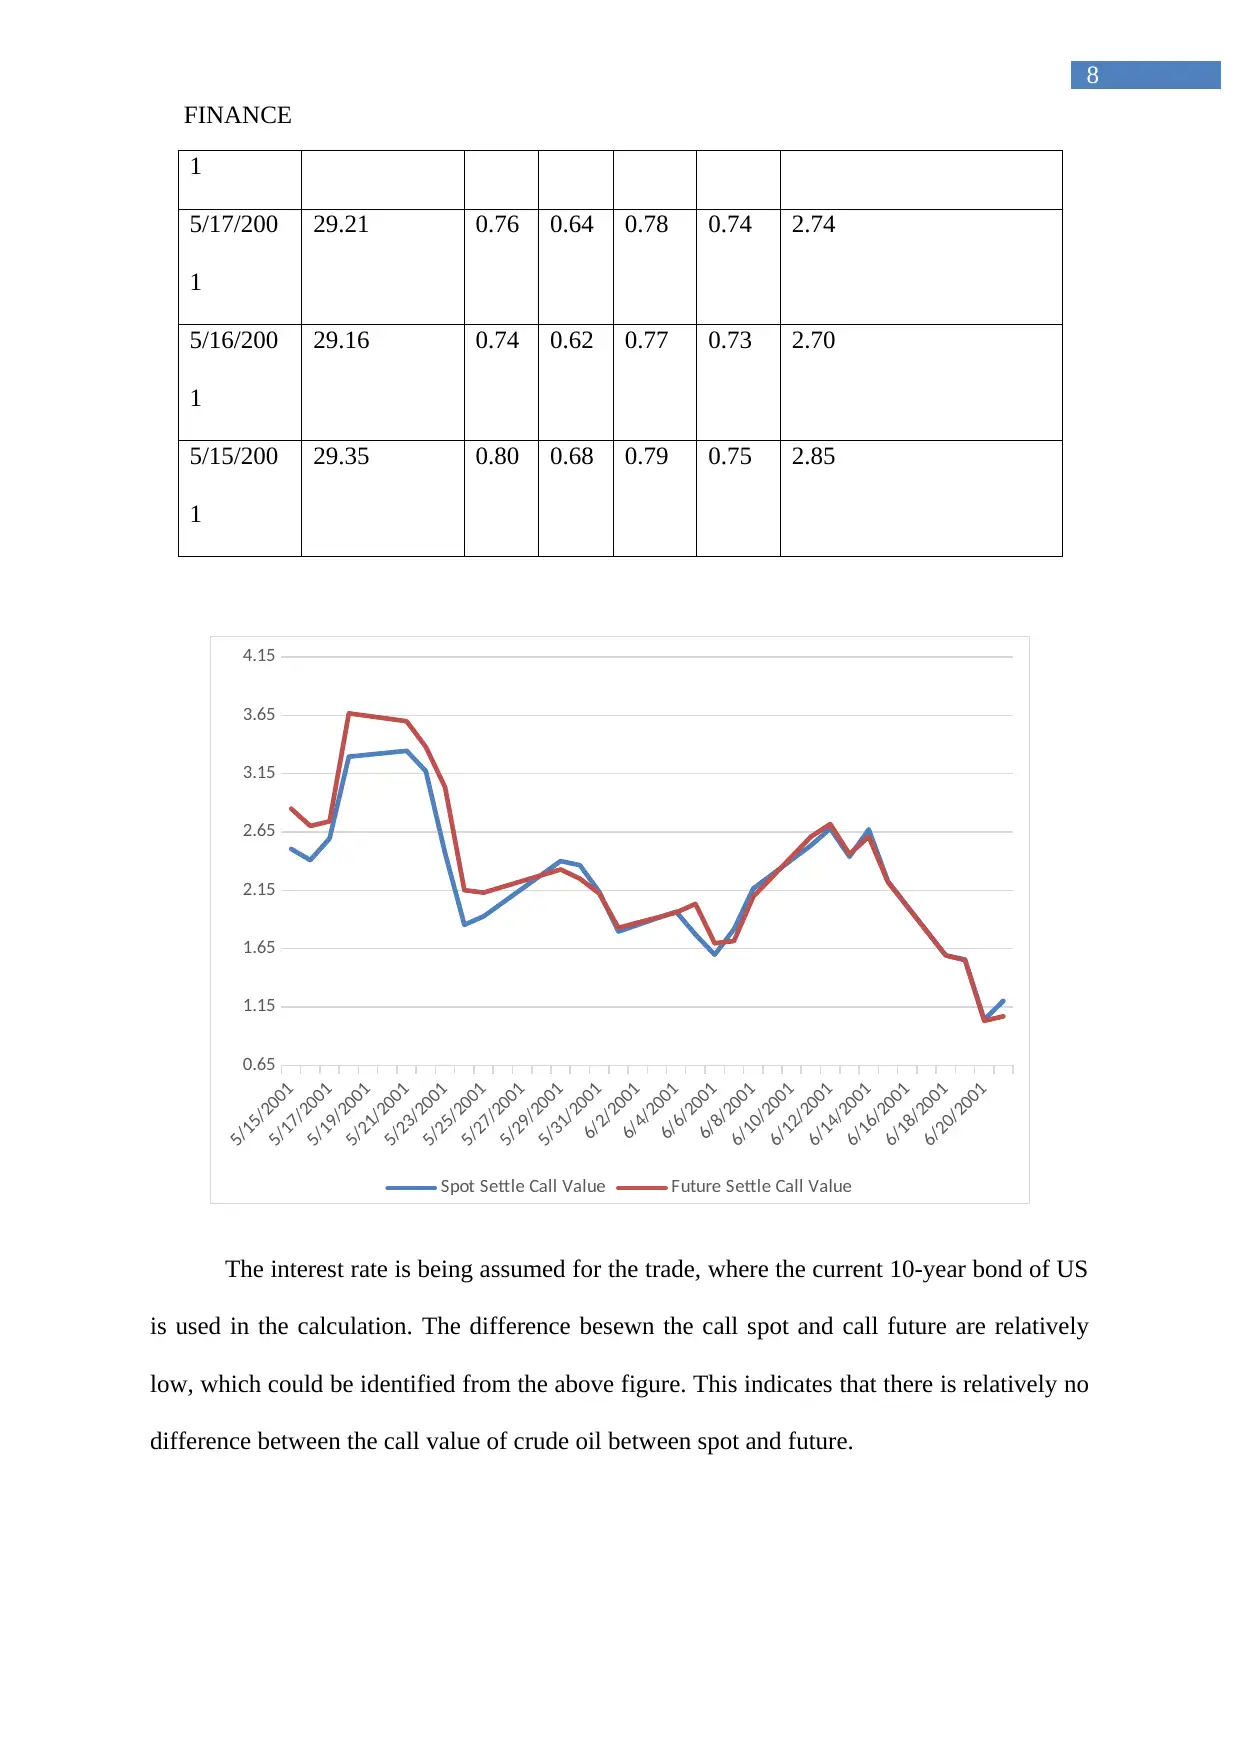
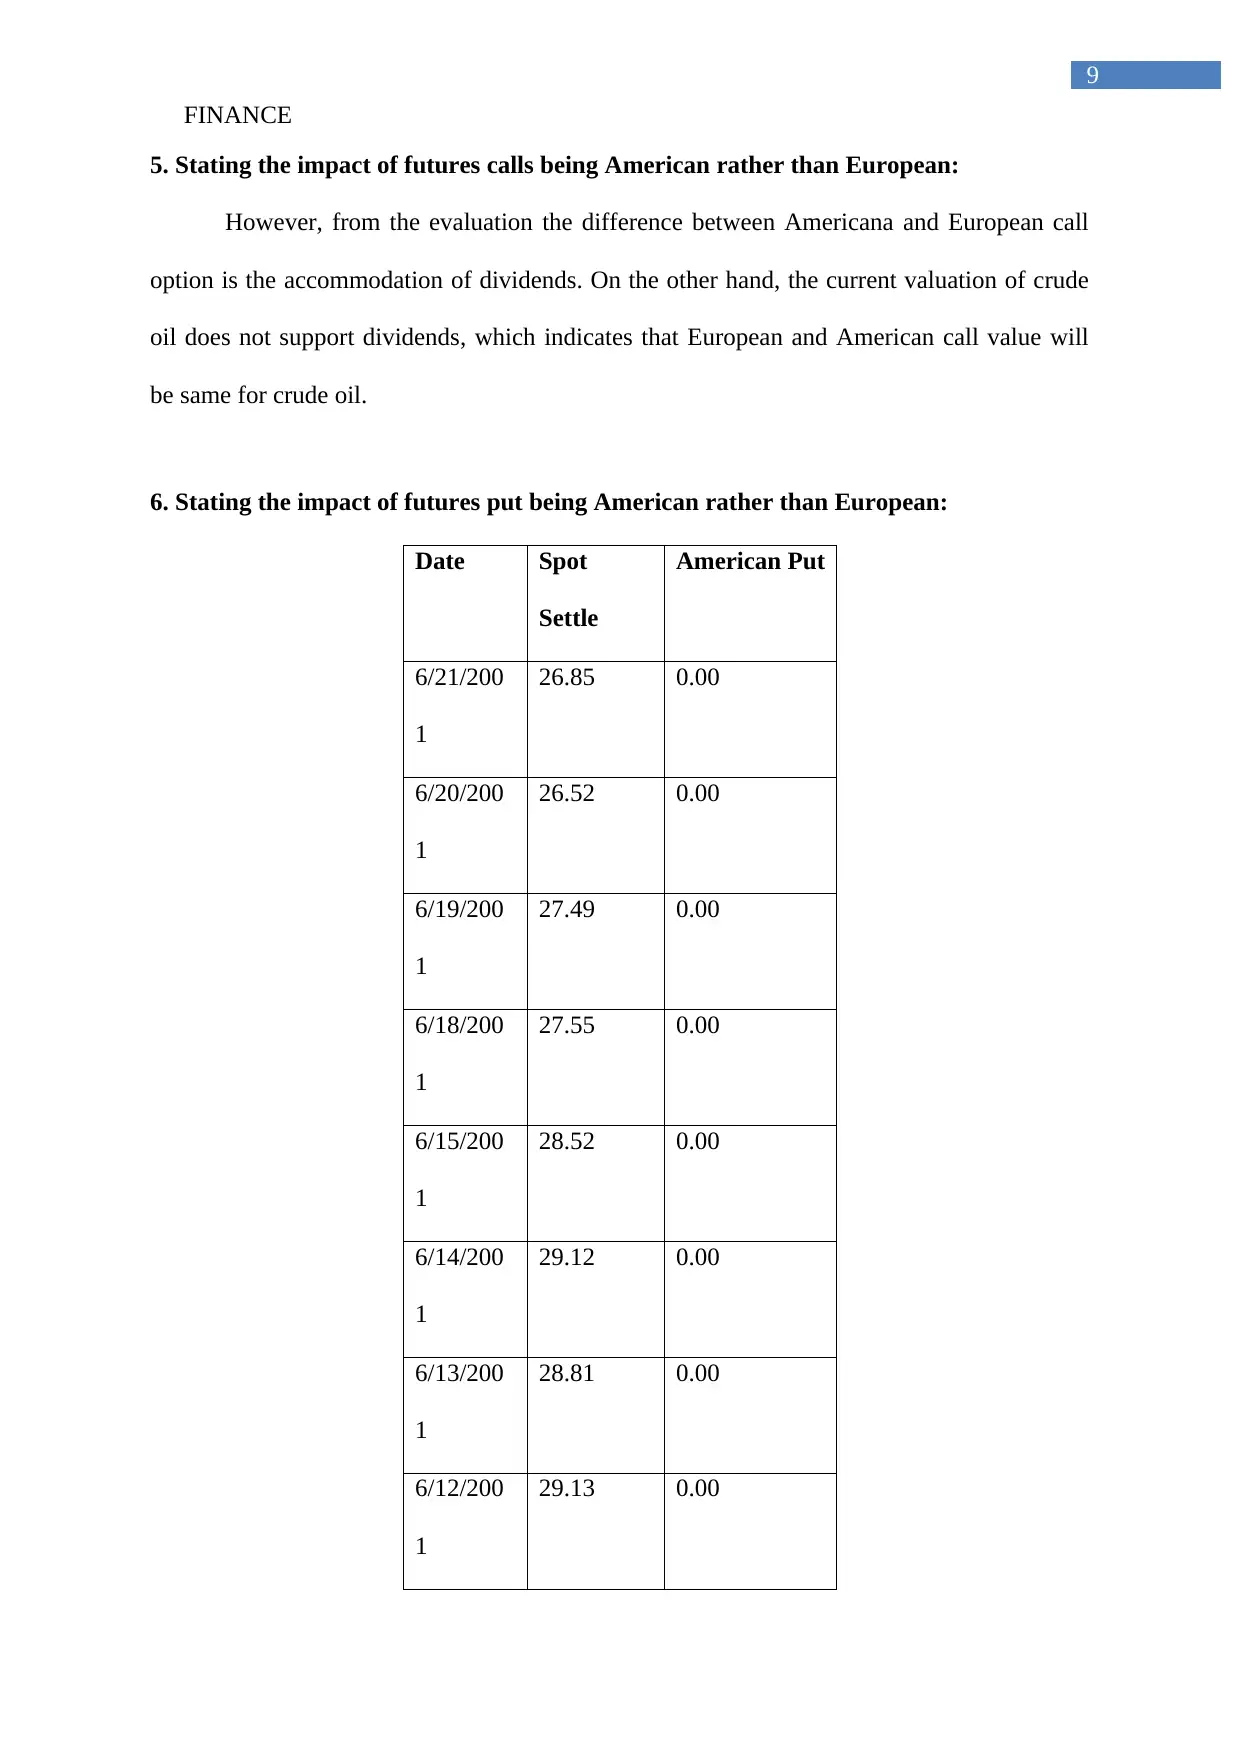
This finance report provides an in-depth analysis of crude oil futures contracts, examining the differences between spot and future prices and their implications for options trading. It computes and analyzes the cost of carry, demonstrating its behavior over the contract's life. The report compares the annual return volatility of crude oil futures versus spot prices and details the valuation of call options. Furthermore, it explores the impact of American versus European options on both call and put values. Finally, the report suggests an ideal trading strategy for crude oil futures in the current economic climate, incorporating hedging techniques to manage risk. The analysis is supported by relevant data and calculations, providing a comprehensive understanding of the crude oil futures market.

Running head: FINANCE
Finance
Name of the Student:
Name of the University:
Authors Note:
Finance
Name of the Student:
Name of the University:
Authors Note:
Paraphrase This Document
Need a fresh take? Get an instant paraphrase of this document with our AI Paraphraser

FINANCE
1
Table of Contents
1. Depicting how spot and future price of crude oil differ and depicting the implications it has
on crude oil futures options:.......................................................................................................2
2. Computing the cost of carry each day and analysing the behaviour over the life of future
contract:......................................................................................................................................3
3. Depicting the annual return volatility of crude oil compares with future vs Spot:................3
4. Depicting how oil future call compares to crude oil compare to spot call:............................4
5. Stating the impact of futures calls being American rather than European:............................7
6. Stating the impact of futures put being American rather than European:..............................7
7. Depicting the trading strategy ideal for crude oil futures in current economic condition:. .11
References:...............................................................................................................................12

FINANCE
2
1. Depicting how spot and future price of crude oil differ and depicting the implications
it has on crude oil futures options:
2/26/1999
3/26/1999
4/23/1999
5/21/1999
6/18/1999
7/16/1999
8/13/1999
9/10/1999
10/8/1999
11/5/1999
12/3/1999
12/31/1999
1/28/2000
2/25/2000
3/24/2000
4/21/2000
5/19/2000
6/16/2000
7/14/2000
8/11/2000
9/8/2000
10/6/2000
11/3/2000
12/1/2000
12/29/2000
1/26/2001
2/23/2001
3/23/2001
4/20/2001
5/18/2001
6/15/2001
-5
0
5
10
15
20
25
30
35
40
Spot Settle Future Settle Difference
The above figure mainly depicts the overall difference between spot and figure price
of crude oil. In addition, the future price of the crude oil is relatively lower than the spot
price, which indicates that at the time of buying the spot price value increases. This relevantly
indicates that spot price of crude oil is relatively high than future price, which could allow
investor to use adequate hedging prices to hedge their cost for buying crude oil. Cox and
Hoeggerl (2016) mentioned that with the help of adequate hedging process companies can
reduce the losses incurred from crude oil trade.
⊘ This is a preview!⊘
Do you want full access?
Subscribe today to unlock all pages.

Trusted by 1+ million students worldwide

FINANCE
3
2. Computing the cost of carry each day and analysing the behaviour over the life of
future contract:
2/26/1999
3/28/1999
4/27/1999
5/27/1999
6/26/1999
7/26/1999
8/25/1999
9/24/1999
10/24/1999
11/23/1999
12/23/1999
1/22/2000
2/21/2000
3/22/2000
4/21/2000
5/21/2000
6/20/2000
7/20/2000
8/19/2000
9/18/2000
10/18/2000
11/17/2000
12/17/2000
1/16/2001
2/15/2001
3/17/2001
4/16/2001
5/16/2001
6/15/2001
0
5
10
15
20
25
30
35
40
(0.5000)
(0.4000)
(0.3000)
(0.2000)
(0.1000)
-
0.1000
0.2000
0.3000
Spot Settle Future Settle Cost of Carry
The overall evaluation of above figure relevantly depicts the cost of carry for crude
oil, which could be used by investor in detecting the cost involved for carrying the trade.
Moreover, the cost of carry was relatively high, which declined over the time, where future
price was less than the spot price. This positive difference in spot and future price forced the
cost of carry to decline for the investor. However, the gap between future and spot price from
2000 increased the overall cost of carry for the investors. Therefore, the positive difference
between future and spot price reduced cost of carry, while vice-versa happened when gap is
reduced for spot and future price.
3. Depicting the annual return volatility of crude oil compares with future vs Spot:
Particulars Spot Settle Future Settle
Standard deviation 2.54% 1.57%
Variance 0.06% 0.02%
Trading days 250 250
Paraphrase This Document
Need a fresh take? Get an instant paraphrase of this document with our AI Paraphraser

FINANCE
4
Annualised variance 16.19% 6.16%
Standard deviation annualised 40.24% 24.82%
4. Depicting how oil future call compares to crude oil compare to spot call:
Date Spot Settle d1 d2 N(d1) N(d2) Spot Settle Call Value
6/21/200
1
26.85 0.03 -
0.09
0.51 0.47 1.20
6/20/200
1
26.52 -0.08 -
0.19
0.47 0.42 1.04
6/19/200
1
27.49 0.23 0.12 0.59 0.55 1.56
6/18/200
1
27.55 0.25 0.14 0.60 0.55 1.59
6/15/200
1
28.52 0.55 0.43 0.71 0.67 2.23
6/14/200
1
29.12 0.73 0.61 0.77 0.73 2.67
6/13/200
1
28.81 0.64 0.52 0.74 0.70 2.44
6/12/200
1
29.13 0.73 0.62 0.77 0.73 2.68
6/11/200
1
28.94 0.68 0.56 0.75 0.71 2.53
6/8/2001 28.43 0.52 0.41 0.70 0.66 2.16

FINANCE
5
6/7/2001 27.91 0.36 0.25 0.64 0.60 1.82
6/6/2001 27.56 0.26 0.14 0.60 0.56 1.60
6/5/2001 27.84 0.34 0.23 0.63 0.59 1.77
6/4/2001 28.14 0.43 0.32 0.67 0.62 1.97
6/1/2001 27.88 0.35 0.24 0.64 0.59 1.80
5/31/200
1
28.39 0.51 0.39 0.70 0.65 2.14
5/30/200
1
28.71 0.61 0.49 0.73 0.69 2.36
5/29/200
1
28.76 0.62 0.51 0.73 0.69 2.40
5/25/200
1
28.08 0.42 0.30 0.66 0.62 1.93
5/24/200
1
27.97 0.38 0.27 0.65 0.60 1.85
5/23/200
1
28.85 0.65 0.53 0.74 0.70 2.47
5/22/200
1
29.75 0.91 0.80 0.82 0.79 3.17
5/21/200
1
29.96 0.97 0.86 0.84 0.80 3.35
5/18/200
1
29.9 0.96 0.84 0.83 0.80 3.30
5/17/200
1
29.02 0.70 0.58 0.76 0.72 2.60
⊘ This is a preview!⊘
Do you want full access?
Subscribe today to unlock all pages.

Trusted by 1+ million students worldwide

FINANCE
6
5/16/200
1
28.77 0.63 0.51 0.73 0.69 2.41
5/15/200
1
28.9 0.66 0.55 0.75 0.71 2.50
Date Future Settle d1 d2 N(d1) N(d2
)
Future Settle Call Value
6/21/200
1
26.58 -
0.06
-0.17 0.48 0.43 1.07
6/20/200
1
26.5 -
0.08
-0.20 0.47 0.42 1.03
6/19/200
1
27.48 0.23 0.11 0.59 0.55 1.55
6/18/200
1
27.55 0.25 0.14 0.60 0.55 1.59
6/15/200
1
28.51 0.55 0.43 0.71 0.67 2.22
6/14/200
1
29.04 0.71 0.59 0.76 0.72 2.61
6/13/200
1
28.84 0.65 0.53 0.74 0.70 2.46
6/12/200
1
29.18 0.75 0.63 0.77 0.74 2.72
Paraphrase This Document
Need a fresh take? Get an instant paraphrase of this document with our AI Paraphraser

FINANCE
7
6/11/200
1
29.04 0.71 0.59 0.76 0.72 2.61
6/8/2001 28.33 0.49 0.38 0.69 0.65 2.10
6/7/2001 27.75 0.31 0.20 0.62 0.58 1.71
6/6/2001 27.72 0.31 0.19 0.62 0.57 1.70
6/5/2001 28.24 0.47 0.35 0.68 0.64 2.03
6/4/2001 28.13 0.43 0.32 0.67 0.62 1.96
6/1/2001 27.93 0.37 0.25 0.64 0.60 1.83
5/31/200
1
28.37 0.50 0.39 0.69 0.65 2.12
5/30/200
1
28.55 0.56 0.44 0.71 0.67 2.25
5/29/200
1
28.66 0.59 0.48 0.72 0.68 2.33
5/25/200
1
28.38 0.51 0.39 0.69 0.65 2.13
5/24/200
1
28.41 0.52 0.40 0.70 0.66 2.15
5/23/200
1
29.58 0.86 0.75 0.81 0.77 3.03
5/22/200
1
30 0.99 0.87 0.84 0.81 3.38
5/21/200
1
30.26 1.06 0.94 0.86 0.83 3.60
5/18/200 30.34 1.08 0.97 0.86 0.83 3.67

FINANCE
8
1
5/17/200
1
29.21 0.76 0.64 0.78 0.74 2.74
5/16/200
1
29.16 0.74 0.62 0.77 0.73 2.70
5/15/200
1
29.35 0.80 0.68 0.79 0.75 2.85
5/15/2001
5/17/2001
5/19/2001
5/21/2001
5/23/2001
5/25/2001
5/27/2001
5/29/2001
5/31/2001
6/2/2001
6/4/2001
6/6/2001
6/8/2001
6/10/2001
6/12/2001
6/14/2001
6/16/2001
6/18/2001
6/20/2001
0.65
1.15
1.65
2.15
2.65
3.15
3.65
4.15
Spot Settle Call Value Future Settle Call Value
The interest rate is being assumed for the trade, where the current 10-year bond of US
is used in the calculation. The difference besewn the call spot and call future are relatively
low, which could be identified from the above figure. This indicates that there is relatively no
difference between the call value of crude oil between spot and future.
⊘ This is a preview!⊘
Do you want full access?
Subscribe today to unlock all pages.

Trusted by 1+ million students worldwide

FINANCE
9
5. Stating the impact of futures calls being American rather than European:
However, from the evaluation the difference between Americana and European call
option is the accommodation of dividends. On the other hand, the current valuation of crude
oil does not support dividends, which indicates that European and American call value will
be same for crude oil.
6. Stating the impact of futures put being American rather than European:
Date Spot
Settle
American Put
6/21/200
1
26.85 0.00
6/20/200
1
26.52 0.00
6/19/200
1
27.49 0.00
6/18/200
1
27.55 0.00
6/15/200
1
28.52 0.00
6/14/200
1
29.12 0.00
6/13/200
1
28.81 0.00
6/12/200
1
29.13 0.00
Paraphrase This Document
Need a fresh take? Get an instant paraphrase of this document with our AI Paraphraser

FINANCE
10
6/11/200
1
28.94 0.00
6/8/2001 28.43 0.00
6/7/2001 27.91 0.00
6/6/2001 27.56 0.00
6/5/2001 27.84 0.00
6/4/2001 28.14 0.00
6/1/2001 27.88 0.00
5/31/200
1
28.39 0.00
5/30/200
1
28.71 0.00
5/29/200
1
28.76 0.00
5/25/200
1
28.08 0.00
5/24/200
1
27.97 0.00
5/23/200
1
28.85 0.00
5/22/200
1
29.75 0.00
5/21/200
1
29.96 0.00
5/18/200 29.9 0.00

FINANCE
11
1
5/17/200
1
29.02 0.00
5/16/200
1
28.77 0.00
5/15/200
1
28.9 0.00
Date Spot
Settle
d1 d2 N(d1) N(d2) European Put
6/21/200
1
26.85 0.03 -
0.09
0.49 0.53 1.29
6/20/200
1
26.52 -0.08 -
0.19
0.53 0.58 1.46
6/19/200
1
27.49 0.23 0.12 0.41 0.45 1.00
6/18/200
1
27.55 0.25 0.14 0.40 0.45 0.98
6/15/200
1
28.52 0.55 0.43 0.29 0.33 0.64
6/14/200
1
29.12 0.73 0.61 0.23 0.27 0.49
6/13/200
1
28.81 0.64 0.52 0.26 0.30 0.56
6/12/200 29.13 0.73 0.62 0.23 0.27 0.49
⊘ This is a preview!⊘
Do you want full access?
Subscribe today to unlock all pages.

Trusted by 1+ million students worldwide
1 out of 12