Introduction to Finance and Financial Analysis of Liverton Co.
VerifiedAdded on 2023/06/04
|16
|3833
|173
AI Summary
This report includes the financial analysis of Liverton Co.'s business income statements, calculation of ratio and their analysis, and financial statements. It also covers break-even point and sales revenue calculation, margin of safety, and new strategies for the company. Additionally, it includes the calculation of payback period, net present value, and average rate of return.
Contribute Materials
Your contribution can guide someone’s learning journey. Share your
documents today.

Introduction to
Finance
Finance
Secure Best Marks with AI Grader
Need help grading? Try our AI Grader for instant feedback on your assignments.
Table of Contents
INTRODUCTION ..........................................................................................................................3
Question 1........................................................................................................................................3
A) Calculation of the ratios of Liverton Co.'s with their interpretation for the year 2019 and
2018:............................................................................................................................................3
B) Analysis of financial statements.............................................................................................5
Question 2........................................................................................................................................5
A) Opening statements of the financial position at the starting of July.......................................5
B) Prepare a monthly cash flow forecast.....................................................................................7
C) Additional Expenditure...........................................................................................................7
Question 3 .......................................................................................................................................7
A) Break-even point and sales revenue calculation for the year ended 2019 and 2020..............7
B) Margin of safety......................................................................................................................9
C) New strategies that company can formed...............................................................................9
Question 4......................................................................................................................................10
(a) calculation of pay back period, Net present value and average rate of return......................10
B) Methods of Appraisal Technique..........................................................................................13
C) Capital Investment Appraisal Techniques............................................................................13
CONCLUSION .............................................................................................................................14
REFERENCES..............................................................................................................................15
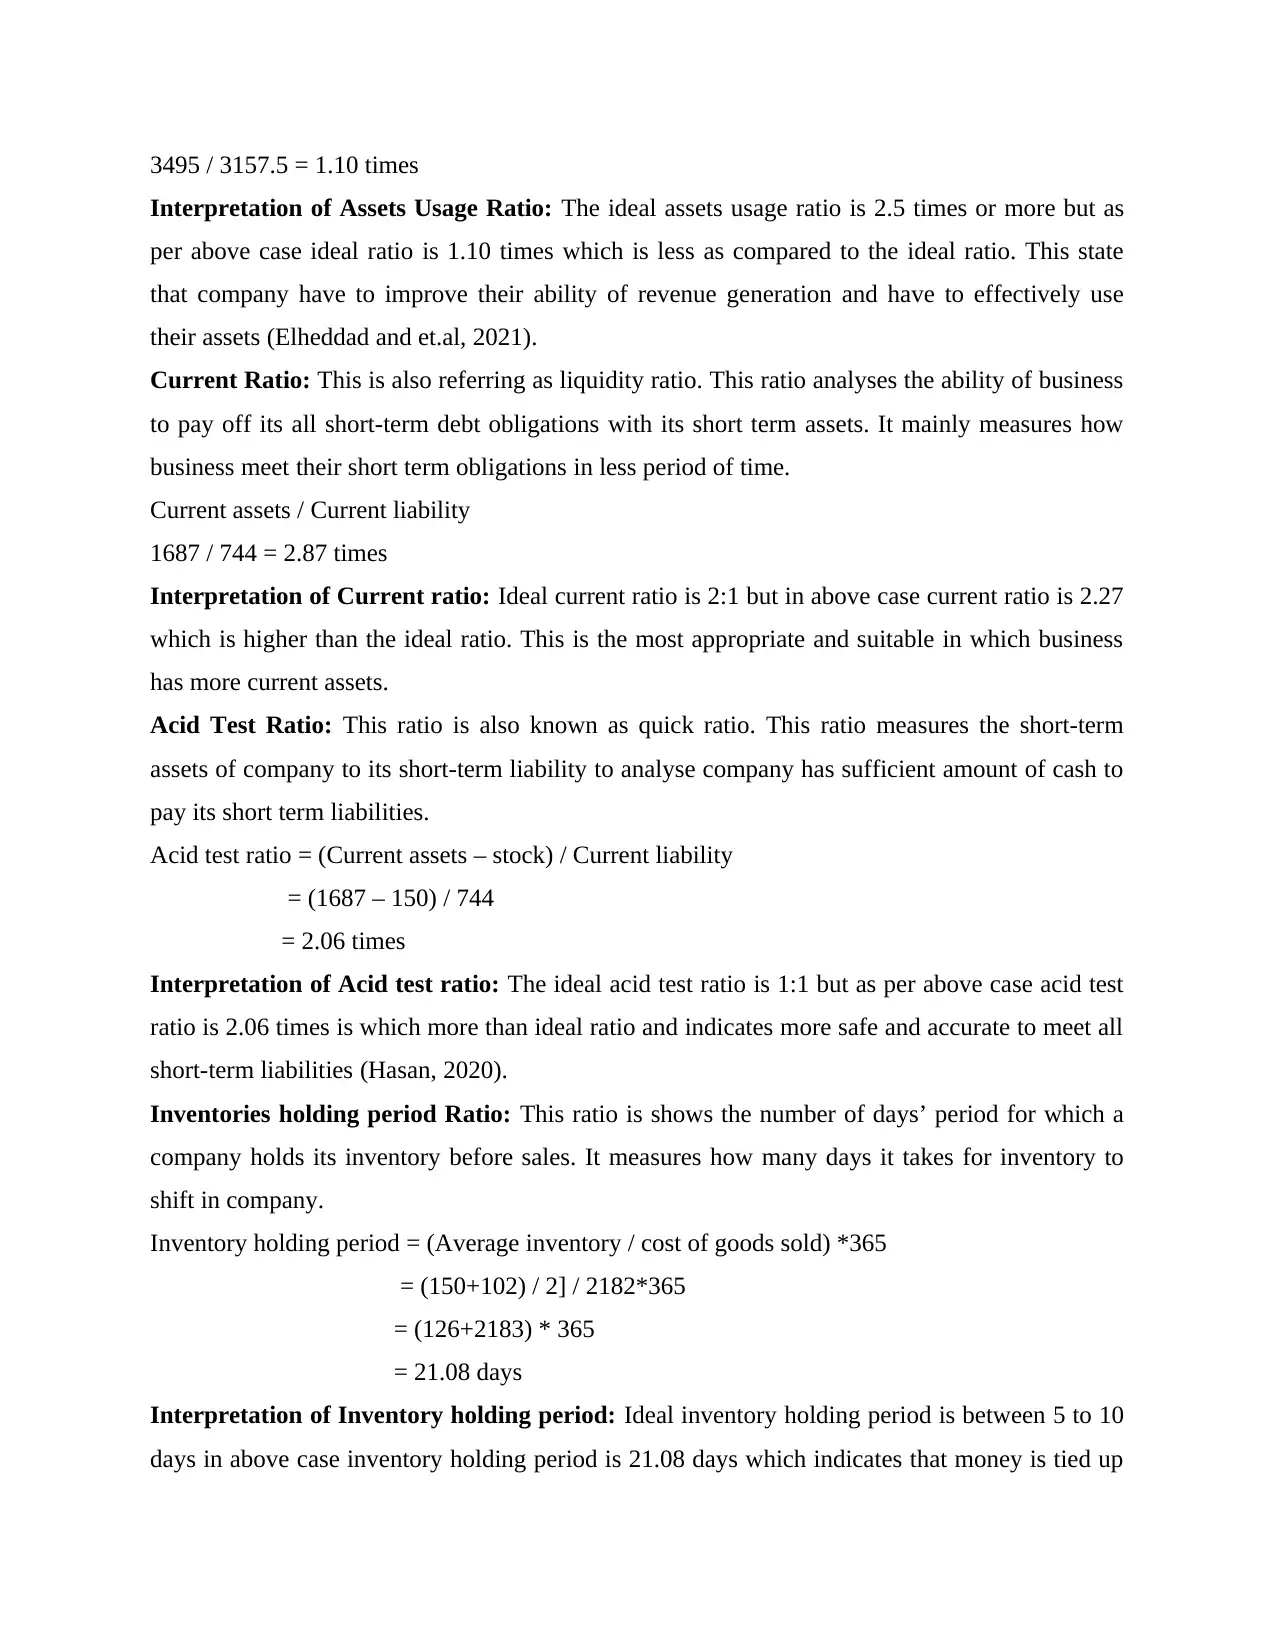
INTRODUCTION
Finance refers to an effective management system which involves various activities like
lending, borrowing, investing, forecasting and saving. In the system of finance credit, money is
effectively utilized as the mean for many exchanges. Along with this in modern financial system
financial services, markets and instruments are also involved. Efficient finance system allows
smooth and appropriate process of funds investment, allocation (Belousova and et.al, 2019). The
main aim of this report is to analyse how finance help Liverton Co.'s business in their smooth
functioning of all the business operations and activities which help them in their financial
positions. Report includes the analyses of Liverton Co.'s business income statements.
Furthermore, report includes calculation of ratio and their analysis. Along with this report
includes analysis of Free Air Ltd revenue and Net present value which implies to be high
profitable for the projects of Scrap pit plc.
Question 1
A) Calculation of the ratios of Liverton Co.'s with their interpretation for the year 2019 and
2018:
Gross profit margin: It show the picture about how effectively business management is
generating revenue. If company generate higher revenue means company is more efficient and
manage their profit effectively.
(Sales – Cost of goods sold) *100 / sales
(3495 – 2182) *100 / 3495
37.57%
Interpretation of gross profit margin: In above case gross profit ratio of the company is
37.57% which is identical with the 38% that indicates better as a growing and develop sector and
company will get this only after reducing the cost of goods (Choudhury, 2018).
Assets Usage Ratio: This ratio analyse how effectively management of business use its assets at
its provision to make money and generate profit. It is also classifying into the efficient ratio
which is help business to earn sales incomes from their held assets which has monetary value
with the help of using net revenue with average of total assets.
Total sales / Average total assets
3495 (3812 + 2503) / 2
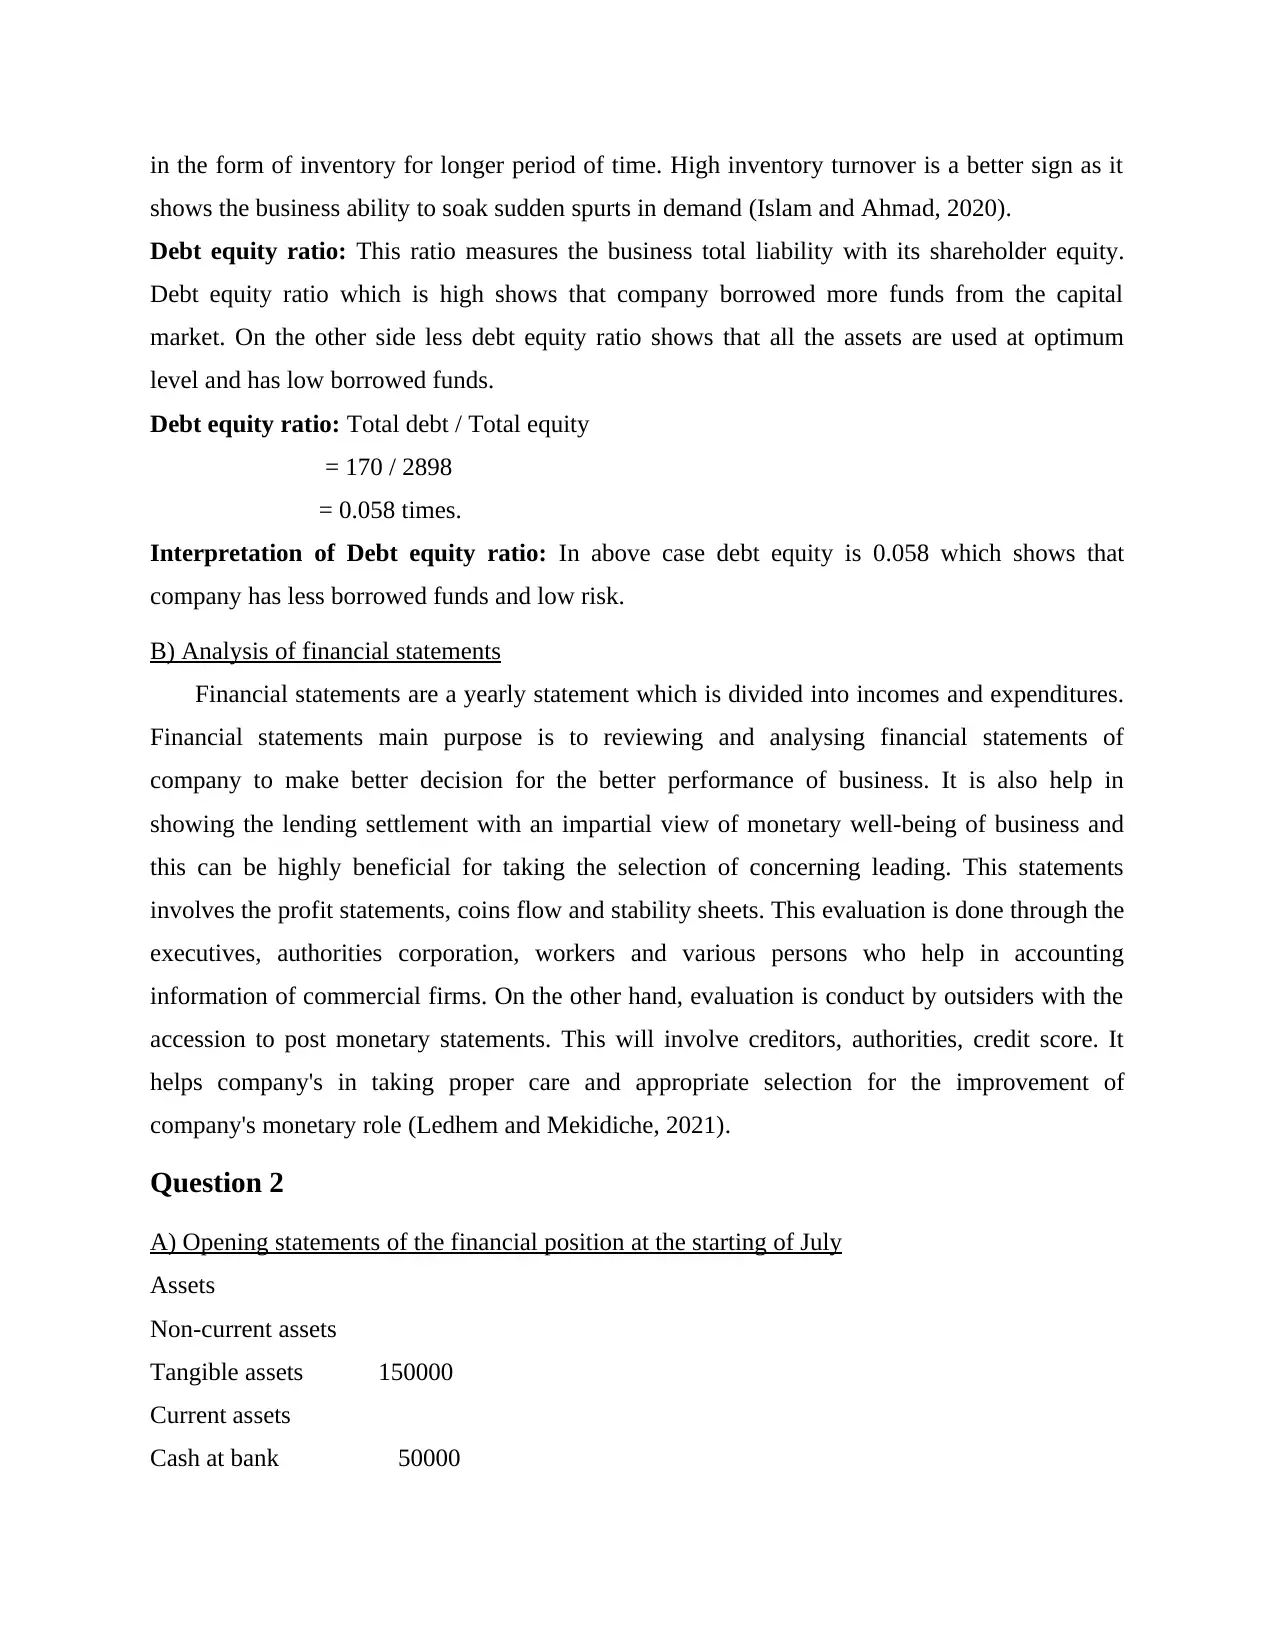
3495 / 3157.5 = 1.10 times
Interpretation of Assets Usage Ratio: The ideal assets usage ratio is 2.5 times or more but as
per above case ideal ratio is 1.10 times which is less as compared to the ideal ratio. This state
that company have to improve their ability of revenue generation and have to effectively use
their assets (Elheddad and et.al, 2021).
Current Ratio: This is also referring as liquidity ratio. This ratio analyses the ability of business
to pay off its all short-term debt obligations with its short term assets. It mainly measures how
business meet their short term obligations in less period of time.
Current assets / Current liability
1687 / 744 = 2.87 times
Interpretation of Current ratio: Ideal current ratio is 2:1 but in above case current ratio is 2.27
which is higher than the ideal ratio. This is the most appropriate and suitable in which business
has more current assets.
Acid Test Ratio: This ratio is also known as quick ratio. This ratio measures the short-term
assets of company to its short-term liability to analyse company has sufficient amount of cash to
pay its short term liabilities.
Acid test ratio = (Current assets – stock) / Current liability
= (1687 – 150) / 744
= 2.06 times
Interpretation of Acid test ratio: The ideal acid test ratio is 1:1 but as per above case acid test
ratio is 2.06 times is which more than ideal ratio and indicates more safe and accurate to meet all
short-term liabilities (Hasan, 2020).
Inventories holding period Ratio: This ratio is shows the number of days’ period for which a
company holds its inventory before sales. It measures how many days it takes for inventory to
shift in company.
Inventory holding period = (Average inventory / cost of goods sold) *365
= (150+102) / 2] / 2182*365
= (126+2183) * 365
= 21.08 days
Interpretation of Inventory holding period: Ideal inventory holding period is between 5 to 10
days in above case inventory holding period is 21.08 days which indicates that money is tied up
Secure Best Marks with AI Grader
Need help grading? Try our AI Grader for instant feedback on your assignments.
in the form of inventory for longer period of time. High inventory turnover is a better sign as it
shows the business ability to soak sudden spurts in demand (Islam and Ahmad, 2020).
Debt equity ratio: This ratio measures the business total liability with its shareholder equity.
Debt equity ratio which is high shows that company borrowed more funds from the capital
market. On the other side less debt equity ratio shows that all the assets are used at optimum
level and has low borrowed funds.
Debt equity ratio: Total debt / Total equity
= 170 / 2898
= 0.058 times.
Interpretation of Debt equity ratio: In above case debt equity is 0.058 which shows that
company has less borrowed funds and low risk.
B) Analysis of financial statements
Financial statements are a yearly statement which is divided into incomes and expenditures.
Financial statements main purpose is to reviewing and analysing financial statements of
company to make better decision for the better performance of business. It is also help in
showing the lending settlement with an impartial view of monetary well-being of business and
this can be highly beneficial for taking the selection of concerning leading. This statements
involves the profit statements, coins flow and stability sheets. This evaluation is done through the
executives, authorities corporation, workers and various persons who help in accounting
information of commercial firms. On the other hand, evaluation is conduct by outsiders with the
accession to post monetary statements. This will involve creditors, authorities, credit score. It
helps company's in taking proper care and appropriate selection for the improvement of
company's monetary role (Ledhem and Mekidiche, 2021).
Question 2
A) Opening statements of the financial position at the starting of July
Assets
Non-current assets
Tangible assets 150000
Current assets
Cash at bank 50000
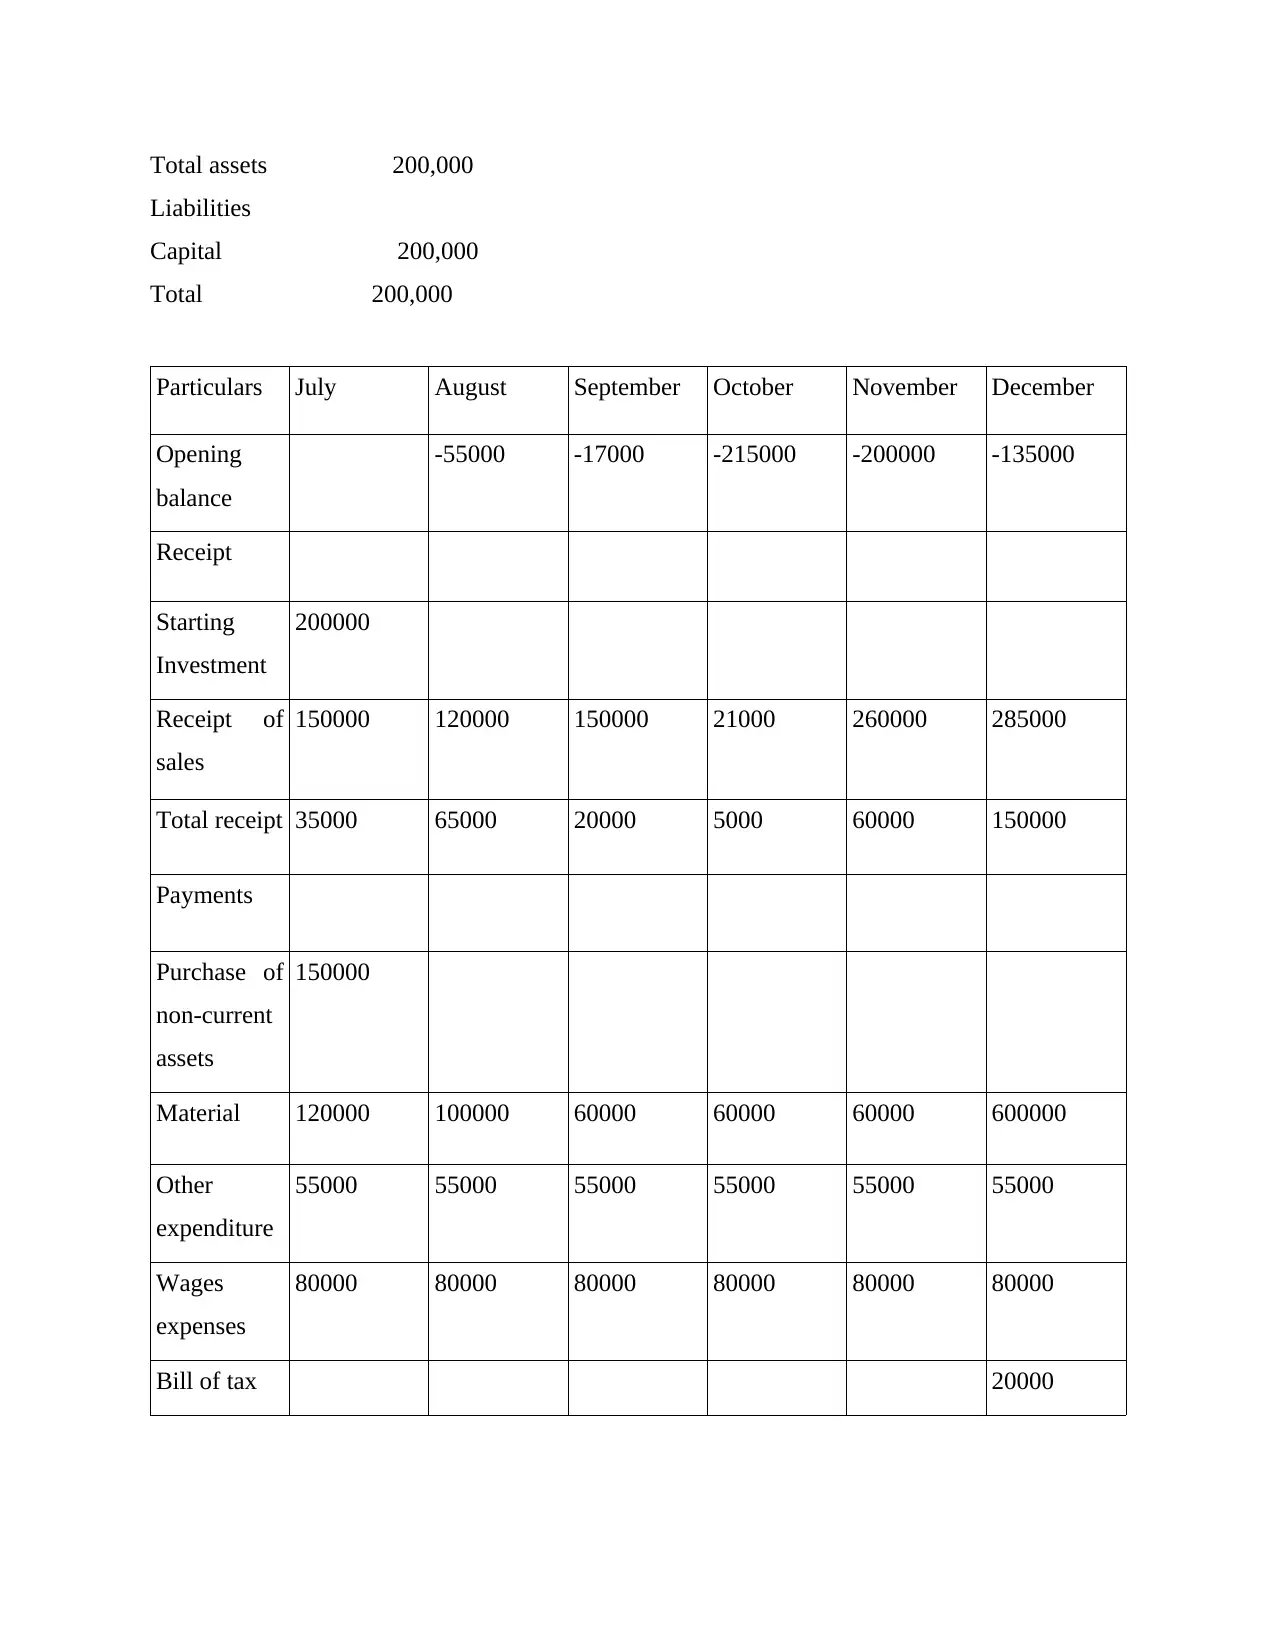
Total assets 200,000
Liabilities
Capital 200,000
Total 200,000
Particulars July August September October November December
Opening
balance
-55000 -17000 -215000 -200000 -135000
Receipt
Starting
Investment
200000
Receipt of
sales
150000 120000 150000 21000 260000 285000
Total receipt 35000 65000 20000 5000 60000 150000
Payments
Purchase of
non-current
assets
150000
Material 120000 100000 60000 60000 60000 600000
Other
expenditure
55000 55000 55000 55000 55000 55000
Wages
expenses
80000 80000 80000 80000 80000 80000
Bill of tax 20000
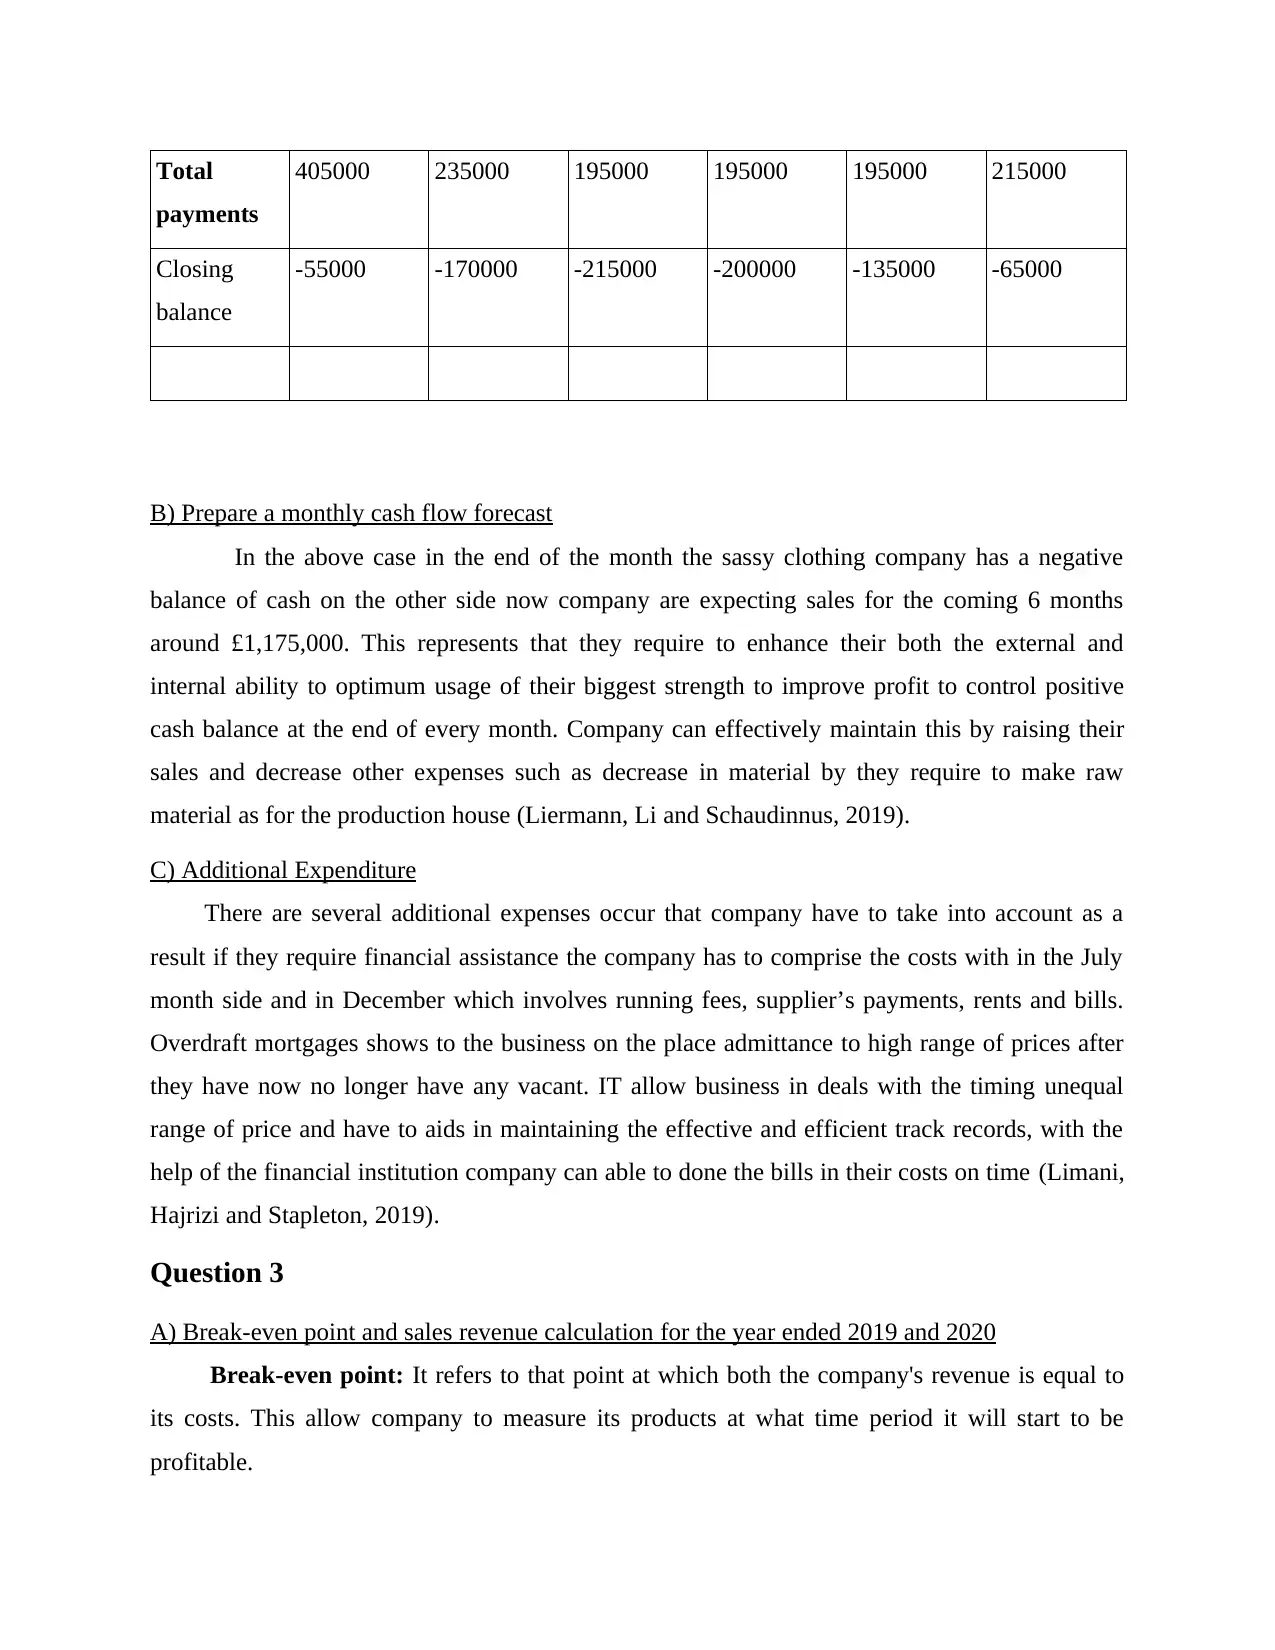
Total
payments
405000 235000 195000 195000 195000 215000
Closing
balance
-55000 -170000 -215000 -200000 -135000 -65000
B) Prepare a monthly cash flow forecast
In the above case in the end of the month the sassy clothing company has a negative
balance of cash on the other side now company are expecting sales for the coming 6 months
around £1,175,000. This represents that they require to enhance their both the external and
internal ability to optimum usage of their biggest strength to improve profit to control positive
cash balance at the end of every month. Company can effectively maintain this by raising their
sales and decrease other expenses such as decrease in material by they require to make raw
material as for the production house (Liermann, Li and Schaudinnus, 2019).
C) Additional Expenditure
There are several additional expenses occur that company have to take into account as a
result if they require financial assistance the company has to comprise the costs with in the July
month side and in December which involves running fees, supplier’s payments, rents and bills.
Overdraft mortgages shows to the business on the place admittance to high range of prices after
they have now no longer have any vacant. IT allow business in deals with the timing unequal
range of price and have to aids in maintaining the effective and efficient track records, with the
help of the financial institution company can able to done the bills in their costs on time (Limani,
Hajrizi and Stapleton, 2019).
Question 3
A) Break-even point and sales revenue calculation for the year ended 2019 and 2020
Break-even point: It refers to that point at which both the company's revenue is equal to
its costs. This allow company to measure its products at what time period it will start to be
profitable.
Paraphrase This Document
Need a fresh take? Get an instant paraphrase of this document with our AI Paraphraser
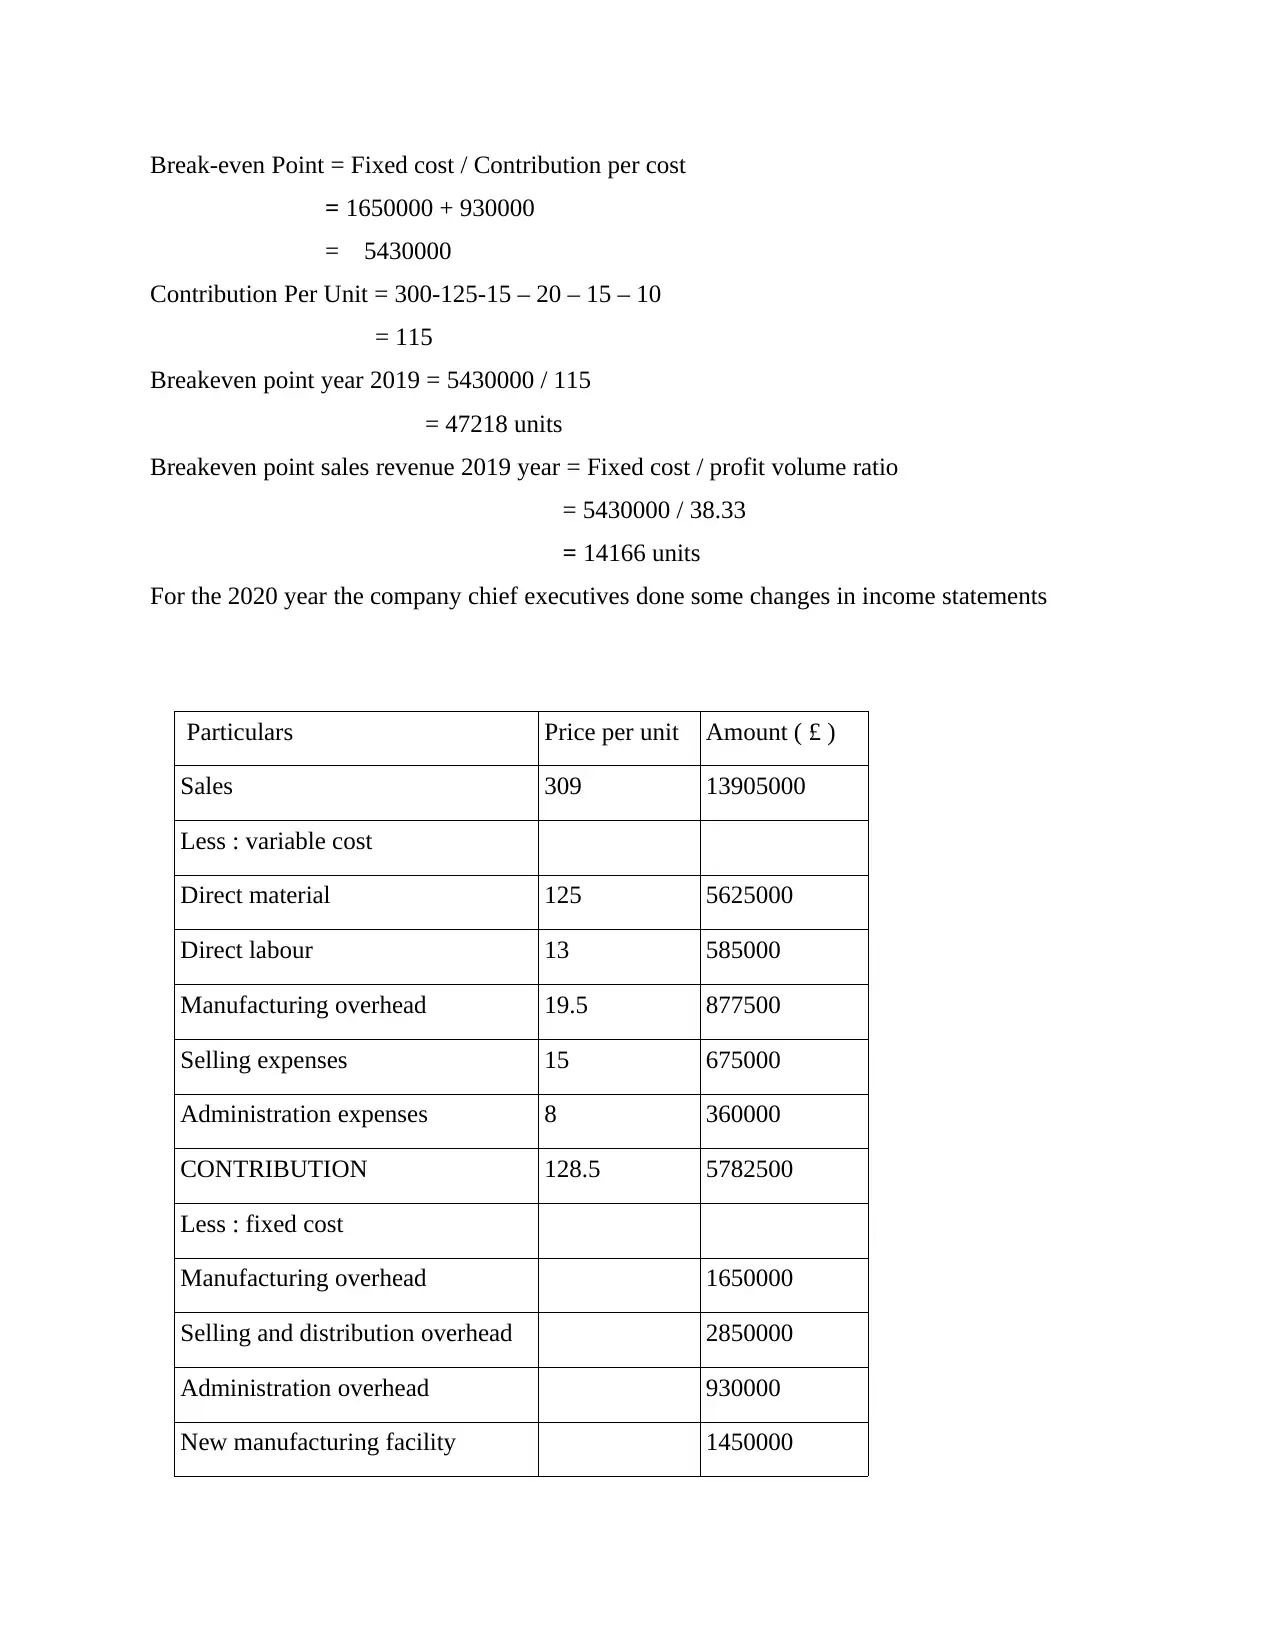
Break-even Point = Fixed cost / Contribution per cost
= 1650000 + 930000
= 5430000
Contribution Per Unit = 300-125-15 – 20 – 15 – 10
= 115
Breakeven point year 2019 = 5430000 / 115
= 47218 units
Breakeven point sales revenue 2019 year = Fixed cost / profit volume ratio
= 5430000 / 38.33
= 14166 units
For the 2020 year the company chief executives done some changes in income statements
Particulars Price per unit Amount ( £ )
Sales 309 13905000
Less : variable cost
Direct material 125 5625000
Direct labour 13 585000
Manufacturing overhead 19.5 877500
Selling expenses 15 675000
Administration expenses 8 360000
CONTRIBUTION 128.5 5782500
Less : fixed cost
Manufacturing overhead 1650000
Selling and distribution overhead 2850000
Administration overhead 930000
New manufacturing facility 1450000
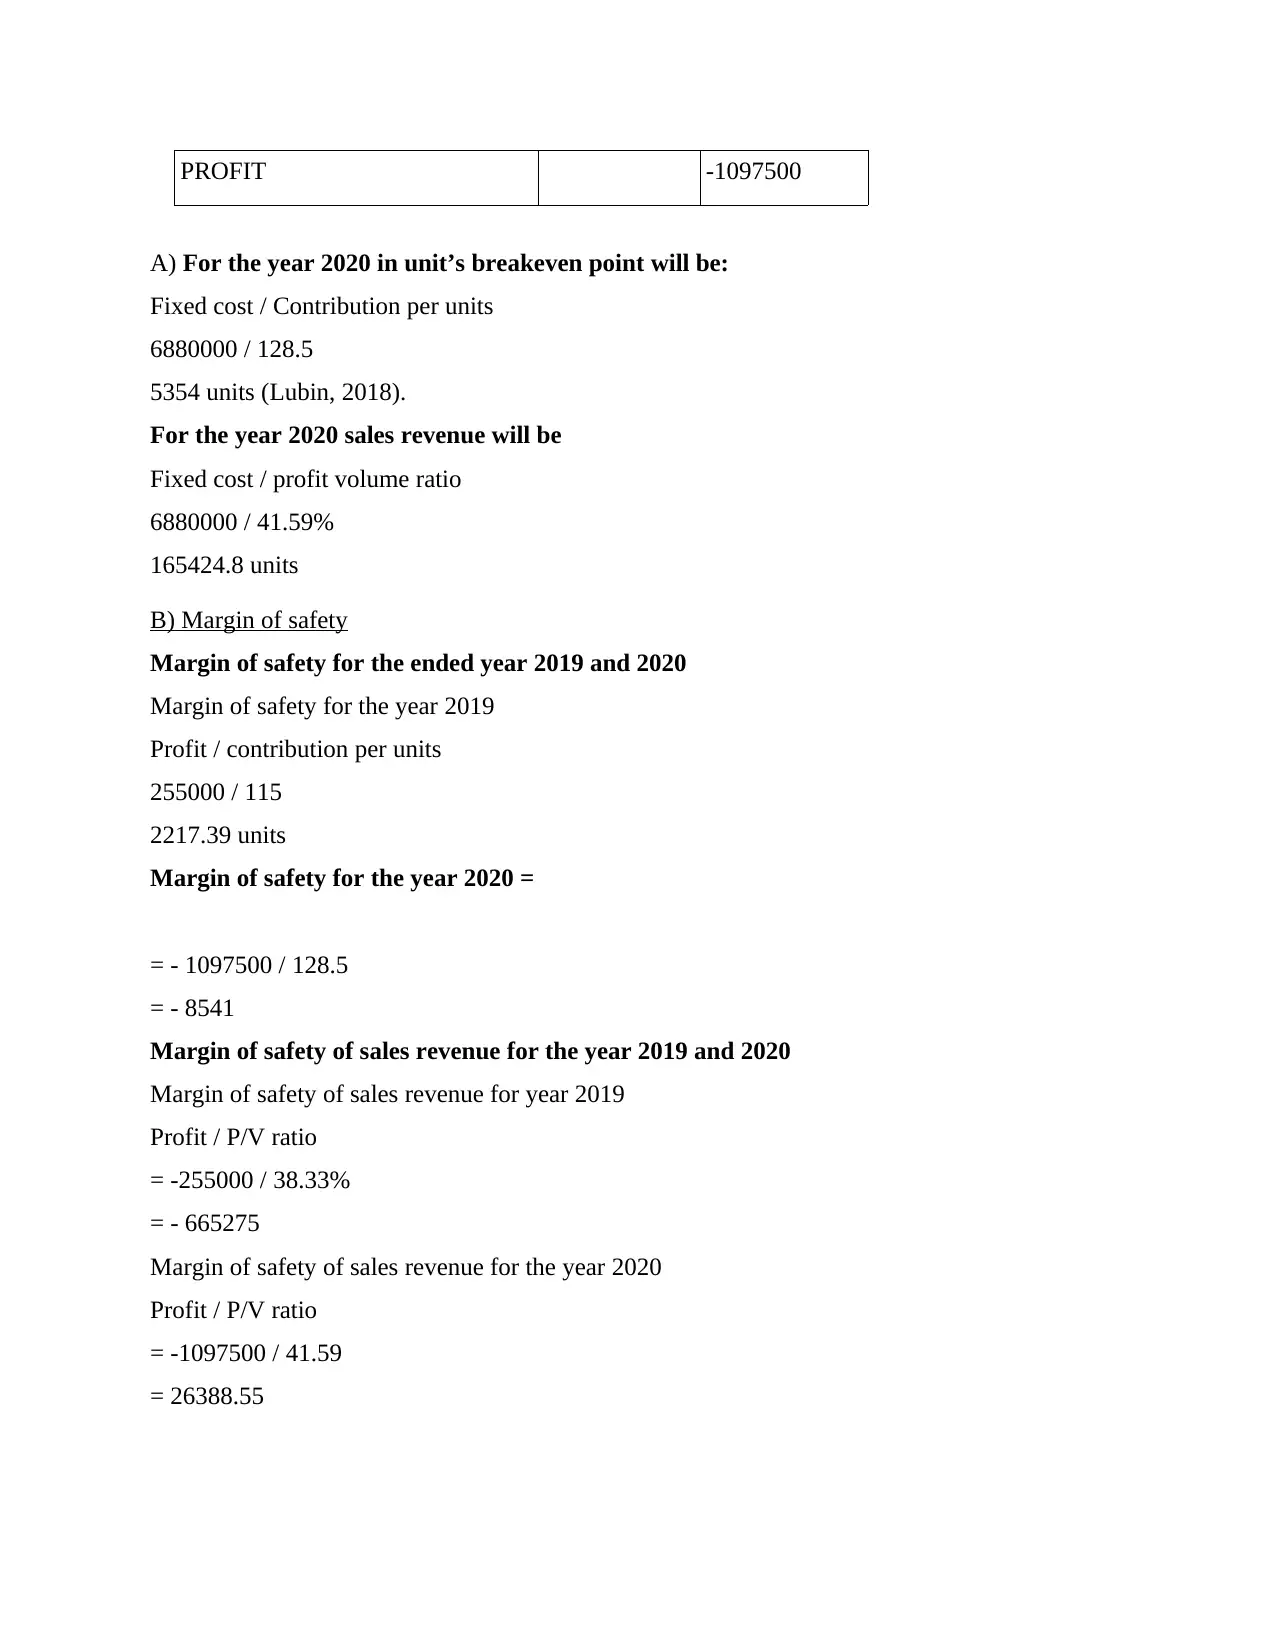
PROFIT -1097500
A) For the year 2020 in unit’s breakeven point will be:
Fixed cost / Contribution per units
6880000 / 128.5
5354 units (Lubin, 2018).
For the year 2020 sales revenue will be
Fixed cost / profit volume ratio
6880000 / 41.59%
165424.8 units
B) Margin of safety
Margin of safety for the ended year 2019 and 2020
Margin of safety for the year 2019
Profit / contribution per units
255000 / 115
2217.39 units
Margin of safety for the year 2020 =
= - 1097500 / 128.5
= - 8541
Margin of safety of sales revenue for the year 2019 and 2020
Margin of safety of sales revenue for year 2019
Profit / P/V ratio
= -255000 / 38.33%
= - 665275
Margin of safety of sales revenue for the year 2020
Profit / P/V ratio
= -1097500 / 41.59
= 26388.55
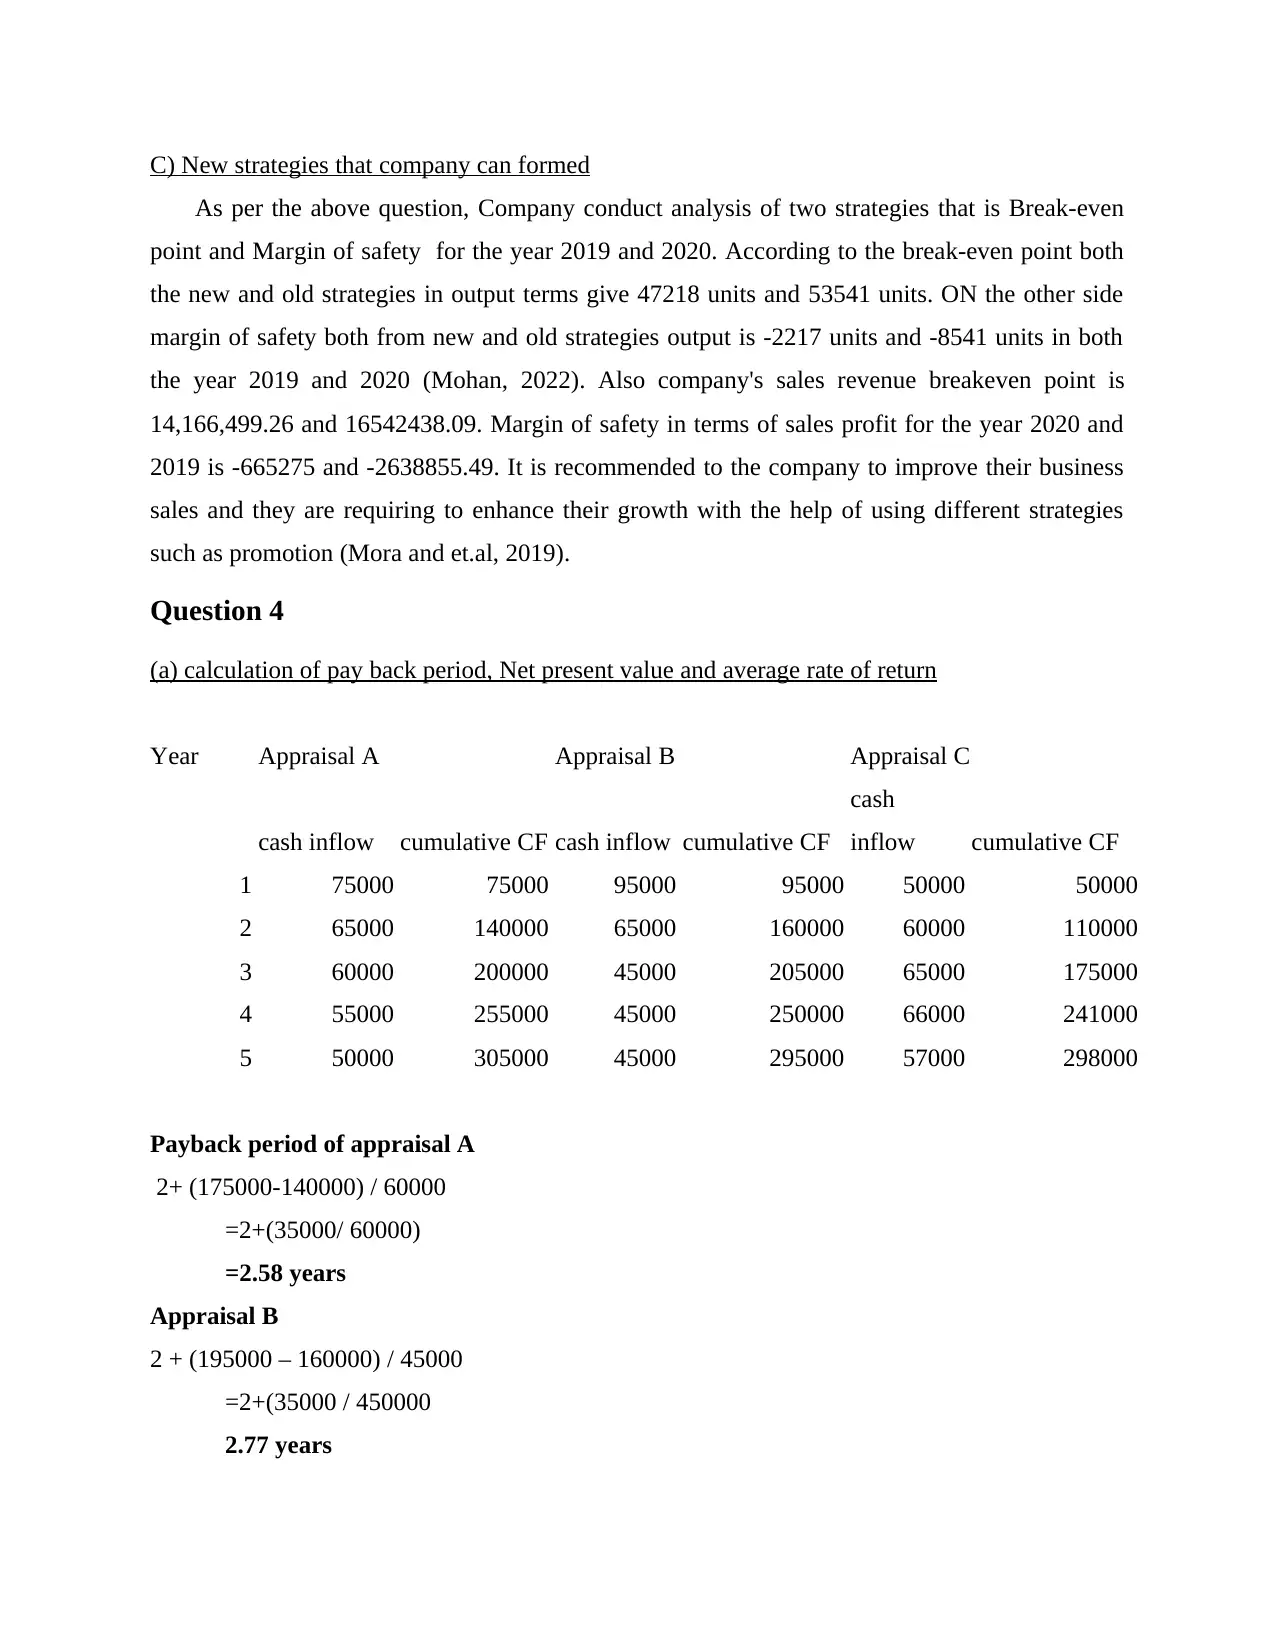
C) New strategies that company can formed
As per the above question, Company conduct analysis of two strategies that is Break-even
point and Margin of safety for the year 2019 and 2020. According to the break-even point both
the new and old strategies in output terms give 47218 units and 53541 units. ON the other side
margin of safety both from new and old strategies output is -2217 units and -8541 units in both
the year 2019 and 2020 (Mohan, 2022). Also company's sales revenue breakeven point is
14,166,499.26 and 16542438.09. Margin of safety in terms of sales profit for the year 2020 and
2019 is -665275 and -2638855.49. It is recommended to the company to improve their business
sales and they are requiring to enhance their growth with the help of using different strategies
such as promotion (Mora and et.al, 2019).
Question 4
(a) calculation of pay back period, Net present value and average rate of return
Year Appraisal A Appraisal B Appraisal C
cash inflow cumulative CF cash inflow cumulative CF
cash
inflow cumulative CF
1 75000 75000 95000 95000 50000 50000
2 65000 140000 65000 160000 60000 110000
3 60000 200000 45000 205000 65000 175000
4 55000 255000 45000 250000 66000 241000
5 50000 305000 45000 295000 57000 298000
Payback period of appraisal A
2+ (175000-140000) / 60000
=2+(35000/ 60000)
=2.58 years
Appraisal B
2 + (195000 – 160000) / 45000
=2+(35000 / 450000
2.77 years
Secure Best Marks with AI Grader
Need help grading? Try our AI Grader for instant feedback on your assignments.
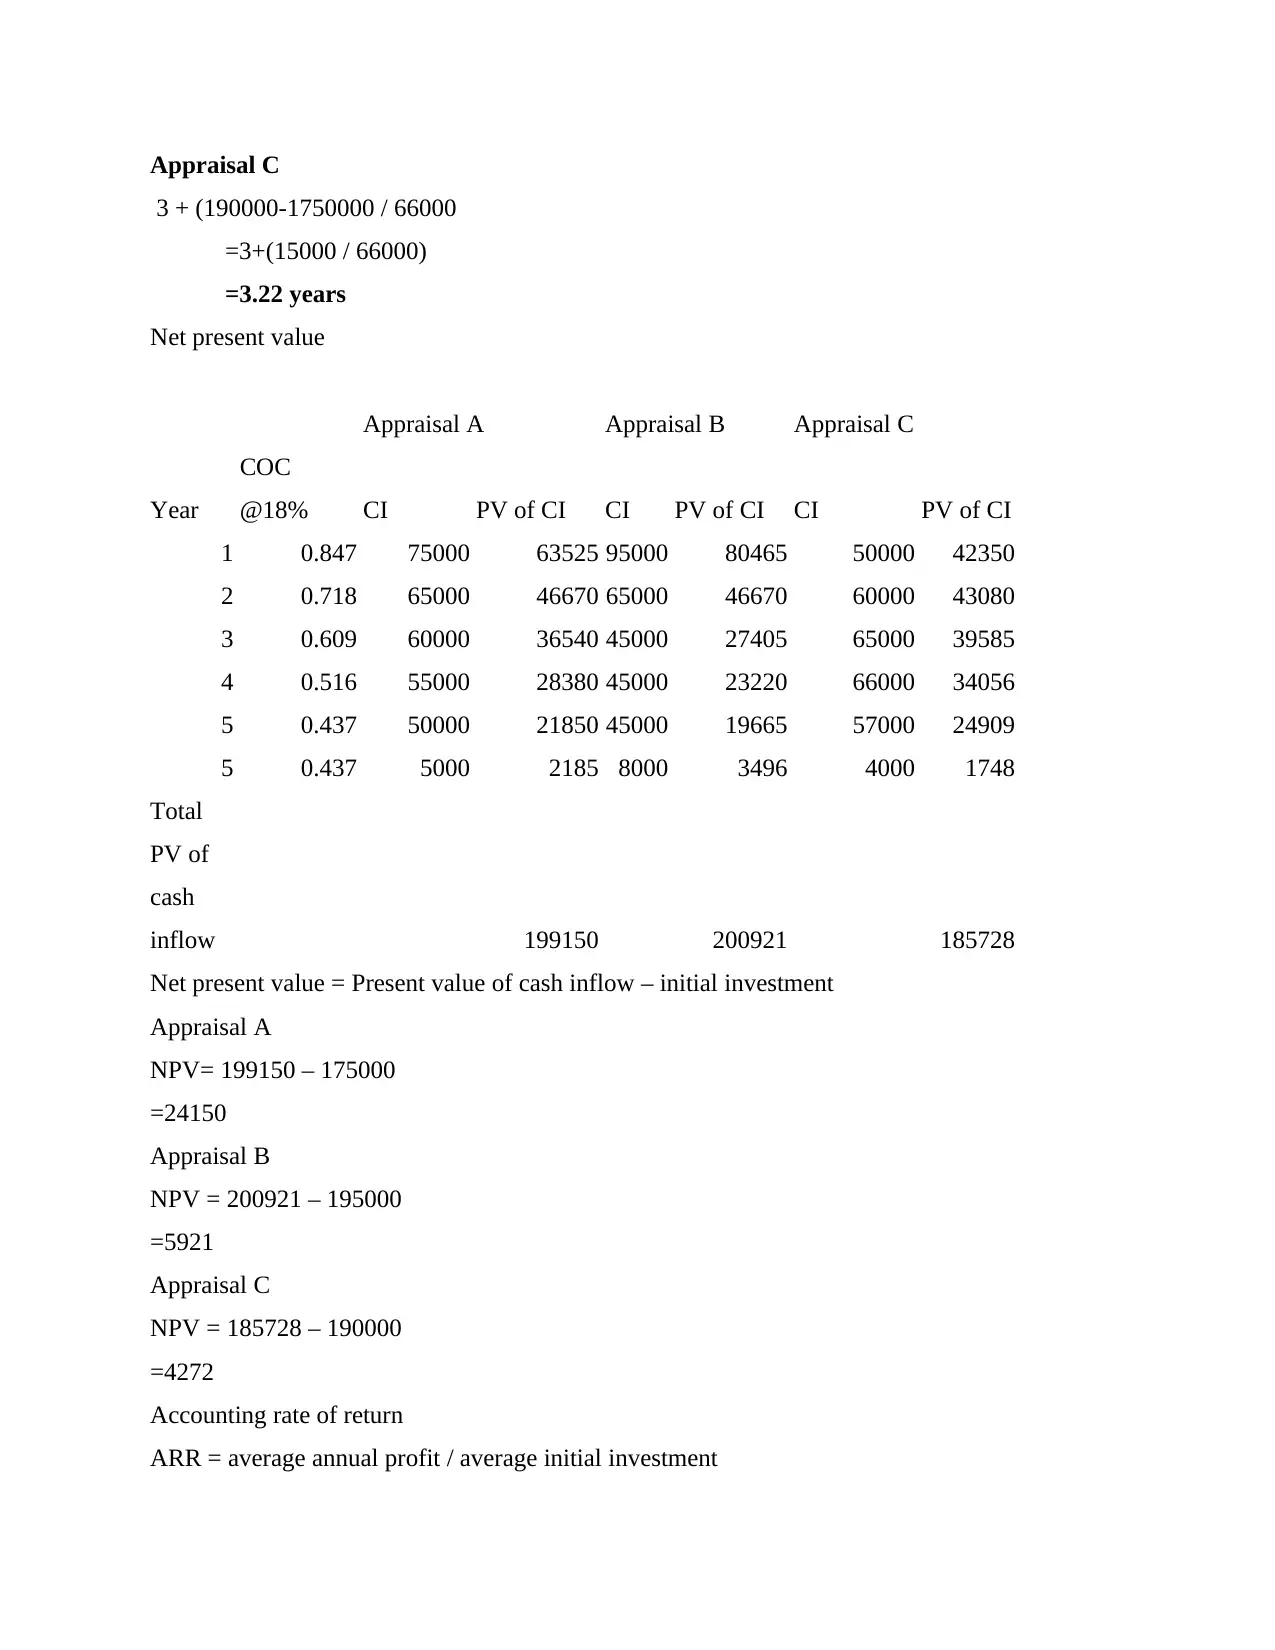
Appraisal C
3 + (190000-1750000 / 66000
=3+(15000 / 66000)
=3.22 years
Net present value
Appraisal A Appraisal B Appraisal C
Year
COC
@18% CI PV of CI CI PV of CI CI PV of CI
1 0.847 75000 63525 95000 80465 50000 42350
2 0.718 65000 46670 65000 46670 60000 43080
3 0.609 60000 36540 45000 27405 65000 39585
4 0.516 55000 28380 45000 23220 66000 34056
5 0.437 50000 21850 45000 19665 57000 24909
5 0.437 5000 2185 8000 3496 4000 1748
Total
PV of
cash
inflow 199150 200921 185728
Net present value = Present value of cash inflow – initial investment
Appraisal A
NPV= 199150 – 175000
=24150
Appraisal B
NPV = 200921 – 195000
=5921
Appraisal C
NPV = 185728 – 190000
=4272
Accounting rate of return
ARR = average annual profit / average initial investment
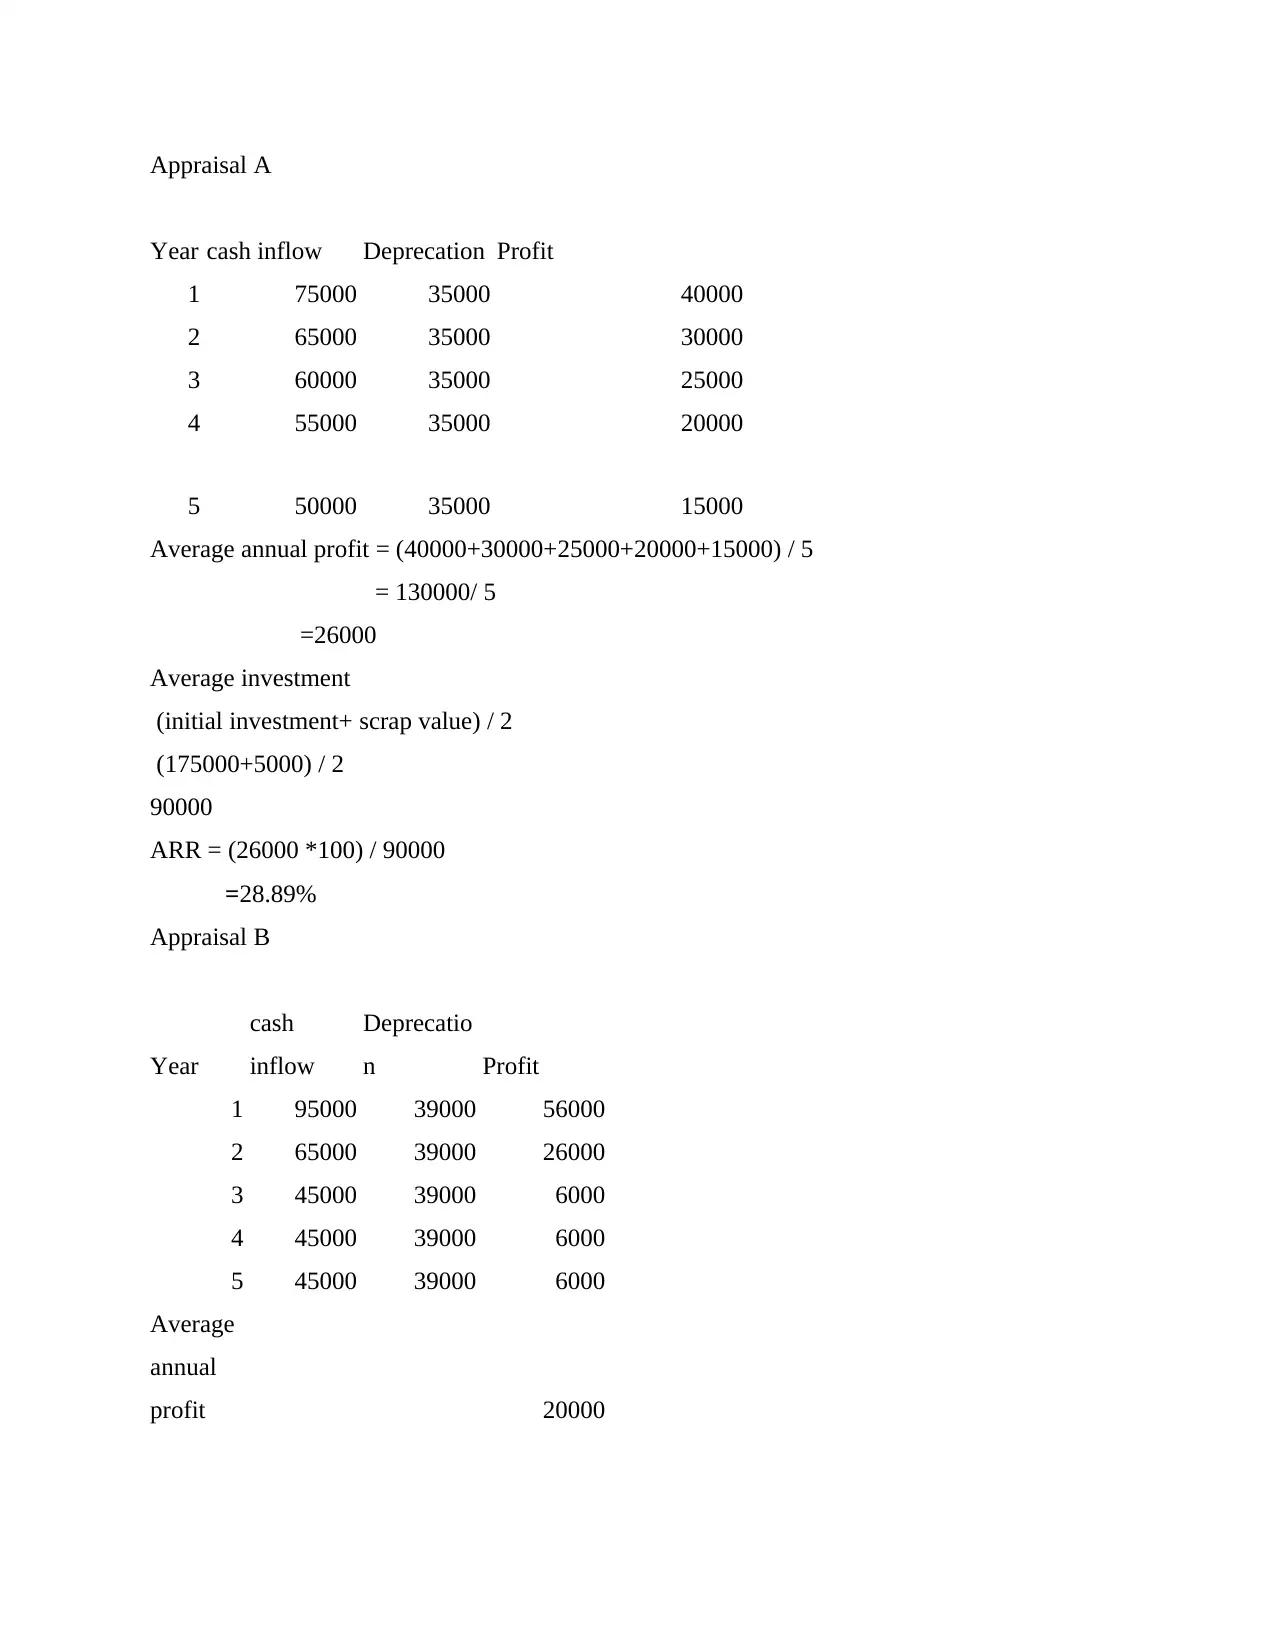
Appraisal A
Year cash inflow Deprecation Profit
1 75000 35000 40000
2 65000 35000 30000
3 60000 35000 25000
4 55000 35000 20000
5 50000 35000 15000
Average annual profit = (40000+30000+25000+20000+15000) / 5
= 130000/ 5
=26000
Average investment
(initial investment+ scrap value) / 2
(175000+5000) / 2
90000
ARR = (26000 *100) / 90000
=28.89%
Appraisal B
Year
cash
inflow
Deprecatio
n Profit
1 95000 39000 56000
2 65000 39000 26000
3 45000 39000 6000
4 45000 39000 6000
5 45000 39000 6000
Average
annual
profit 20000
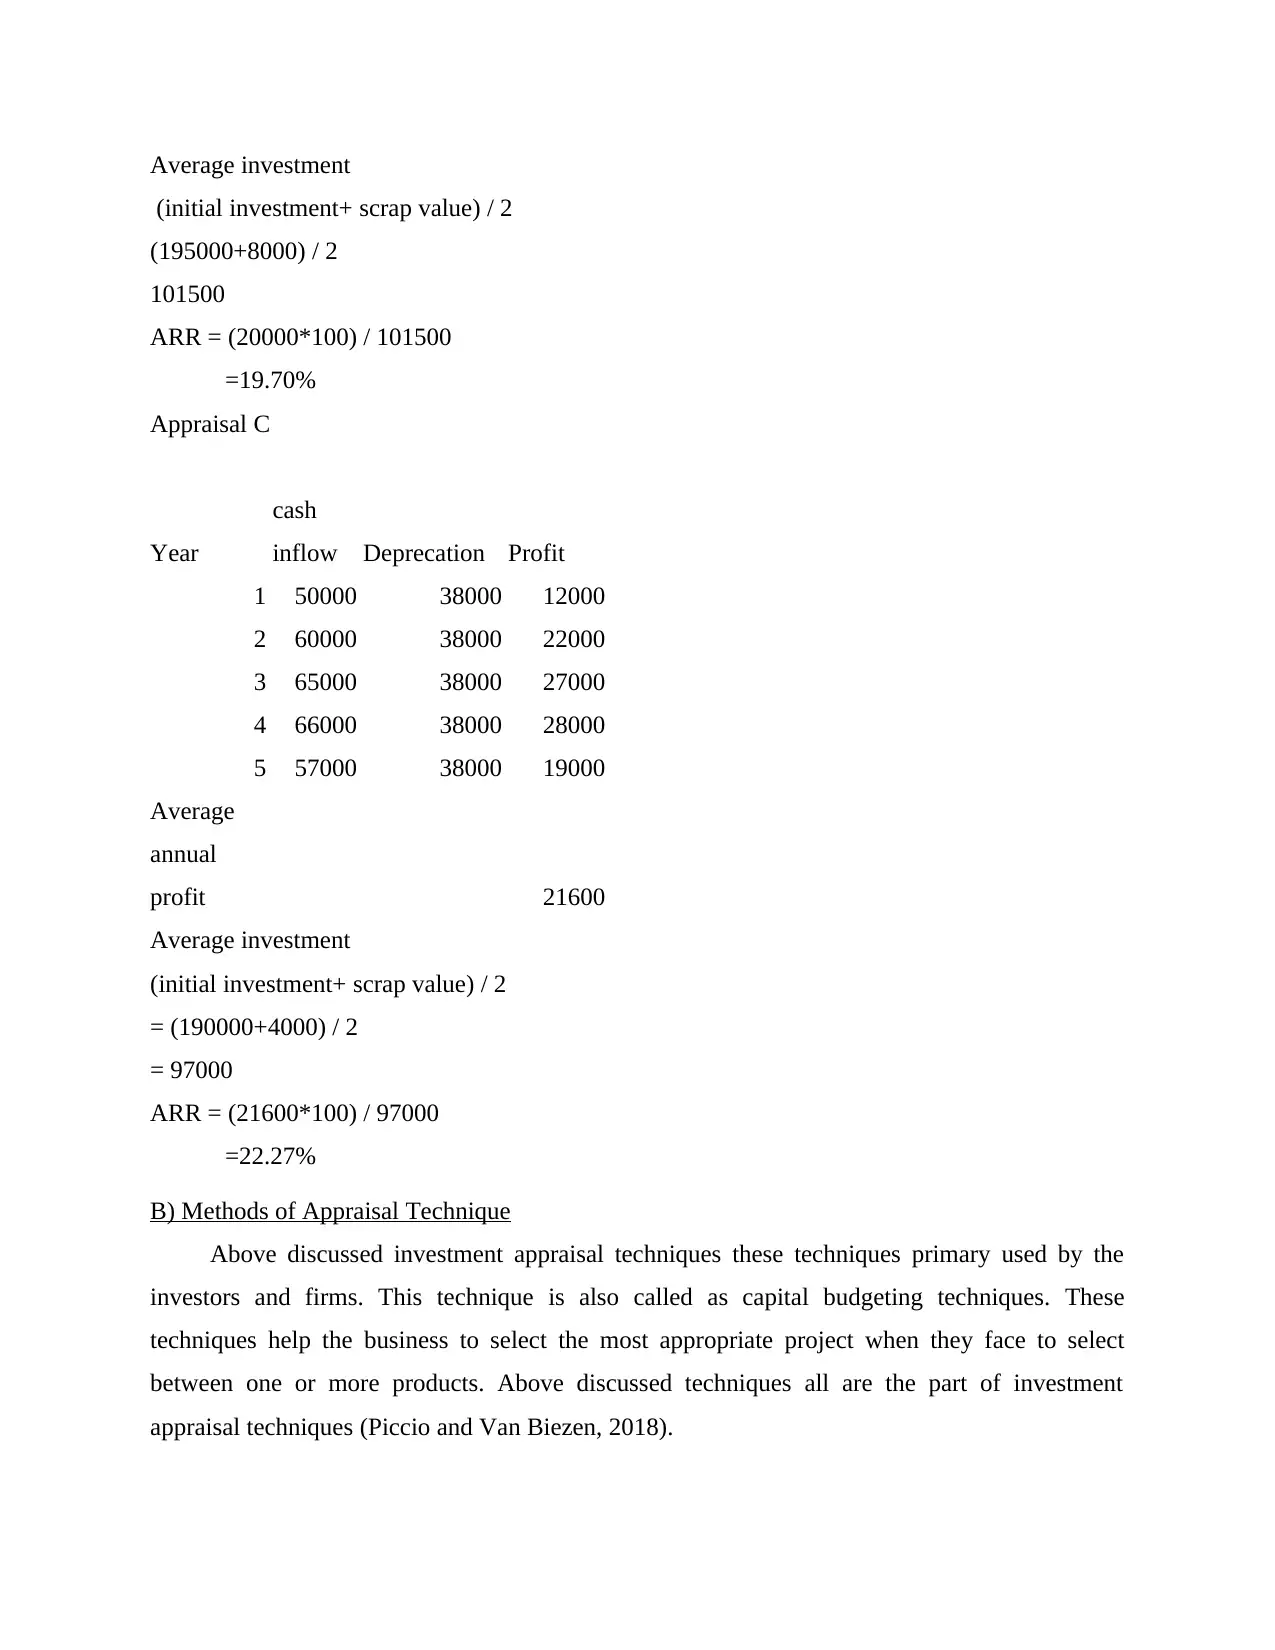
Average investment
(initial investment+ scrap value) / 2
(195000+8000) / 2
101500
ARR = (20000*100) / 101500
=19.70%
Appraisal C
Year
cash
inflow Deprecation Profit
1 50000 38000 12000
2 60000 38000 22000
3 65000 38000 27000
4 66000 38000 28000
5 57000 38000 19000
Average
annual
profit 21600
Average investment
(initial investment+ scrap value) / 2
= (190000+4000) / 2
= 97000
ARR = (21600*100) / 97000
=22.27%
B) Methods of Appraisal Technique
Above discussed investment appraisal techniques these techniques primary used by the
investors and firms. This technique is also called as capital budgeting techniques. These
techniques help the business to select the most appropriate project when they face to select
between one or more products. Above discussed techniques all are the part of investment
appraisal techniques (Piccio and Van Biezen, 2018).
(initial investment+ scrap value) / 2
(195000+8000) / 2
101500
ARR = (20000*100) / 101500
=19.70%
Appraisal C
Year
cash
inflow Deprecation Profit
1 50000 38000 12000
2 60000 38000 22000
3 65000 38000 27000
4 66000 38000 28000
5 57000 38000 19000
Average
annual
profit 21600
Average investment
(initial investment+ scrap value) / 2
= (190000+4000) / 2
= 97000
ARR = (21600*100) / 97000
=22.27%
B) Methods of Appraisal Technique
Above discussed investment appraisal techniques these techniques primary used by the
investors and firms. This technique is also called as capital budgeting techniques. These
techniques help the business to select the most appropriate project when they face to select
between one or more products. Above discussed techniques all are the part of investment
appraisal techniques (Piccio and Van Biezen, 2018).
Paraphrase This Document
Need a fresh take? Get an instant paraphrase of this document with our AI Paraphraser
After analysing above techniques company should select project A for their business operations
in comparison to the other discussed projects. Company can choose project A because it provides
high return on investment as well as it effectively recovers the cost of investment in 2.58 years as
comparison to other project like project B recovers its cost of investment in 2.77 years and
Project C recover its cost of investment in 3.22 years. Appraisal1 net present value is 24150 on
the other side net present appraisal value are 4272 and 5921. Along with this Project A average
rate of return is 28.89%, project B average rate of return is 19.70 and project C average rate of
return is 22.27%
C) Capital Investment Appraisal Techniques
This technique is mainly used by the company management to take effective decision in regards
of project to take decision about the investment and how to finance them to achieve all the goals
of company. There are various ways to describe the capital budgeting decisions. Company
should choose that project which gives high profit and return of shareholders. There are various
capital investment appraisal techniques which are discussed below:
Payback Period: This period indicates the time require to cop up the original cash investment. It
states that total cash expenditure has to be equal to the duration of time require for the
cumulative total net cash flow from the investment. Investor can easily recover their investment
amount with the help of this method. There is various step that follow for calculating payback
period (Shanmuganathan, 2020).
Primary, analyse the project total cash flow
Calculate the estimated cash flow after the tax over the useful life of the project.
Advantages of Payback period
Simple: Payback period technique method is simple and effective as this method help the
company that don't have big amount of investment.
Quick solution: Payback period method is easy and effective to calculate. Owners can
efficiently able to calculate specific project payback period. This support the owner to make
accurate and fast decision, which is essential for the companies with scared resources.
Disadvantages of Payback period
Not considered time value of money: Pay back not considered the time value of money because
it is not give accurate and clear picture as which one project is highly appropriate among two or
more projects (Tsindeliani, 2019).
Not considered projects profitability: It refers that payback period not effectively considered
project profitability it is basically considered inflow of cash up to the period till the original cost
of investment does not recovers.
Ignores the cash flow received after the payback period: Until the payback period has over
largest cash flow may not take place for some projects. May be due to these projects have high
investment return and project have short time for payback may be more preferable.
Average rate of return: It indicates to the rate of return percentage which is expected on
investment. In average rate of return, the average revenue of the asset of the company is divided
by the initial investment of the company. This ratio is calculated to know the expected return
during the lifetime of the asset. It is usually used when there are multiple projects. From different
projects, it provides different expected returns from various projects. It helps in calculating the
profitability of the business (Wang and et.al, 2020).
CONCLUSION
In this report the financial position of the Liver ton co. has been calculated. It is being calculated
with the help of the financial statements and the various ratios. These ratios include gross profit,
current ratio, debt equity, etc. Along with these the breakeven point and the margin of safety are
also calculated. The new strategies are formed according to the position being analysed by the
Liver-ton co. 's financial reports. The company has predicted the future returns with the help of
various analysis. Like average rate of return, net present value, payback period, etc.
REFERENCES
Books and Journals
Belousova and et.al, 2019. The financial literacy assessment among students majoring in the
field of finance. EurAsian Journal of BioSciences, 13(1). China's green finance and
economic growth. Resources Policy, 75. p.102476.
Choudhury, M.A., 2018. The ontological law of Tawhid contra ‘Shari’ah-compliance’in Islamic
portfolio finance. International Journal of Law and Management.
Elheddad and et.al, 2021. The effect of the Fourth Industrial Revolution on the environment: The
relationship between electronic finance and pollution in OECD countries. Technological
Forecasting and Social Change, 163. p.120485.
Hasan, Z., 2020. Risk and Islamic Finance: A Misconception Corrected. In handbook of research
on theory and practice of global Islamic finance (pp. 441-454). IGI Global.
Islam, R. and Ahmad, R., 2020. Applicability of Mudarabah and Musharakah as Islamic micro-
equity finance to underprivileged women in Malaysia. The European Journal of
Development Research, 32(1). pp.176-197.
Ledhem, M.A. and Mekidiche, M., 2021. Islamic finance and economic growth nexus: an
empirical evidence from Southeast Asia using dynamic panel one-step system GMM
analysis. Journal of Islamic Accounting and Business Research.
Liermann, V., Li, S. and Schaudinnus, N., 2019. Deep learning: An introduction. In The Impact
of Digital Transformation and Fintech on the Finance Professional (pp. 305-340). Palgrave
Macmillan, Cham.
Limani, Y., Hajrizi, E. and Stapleton, L., 2019. The Impact of Industry 4.0 on Advanced
Operations Management.
Lubin, D., 2018. Dance of the trillions: Developing countries and global finance. Brookings
Institution Press.
Mohan, P.S., 2022. Implementing nationally determined contributions under the Paris
agreement: an assessment of climate finance in Caribbean small island developing
states. Climate Policy. pp.1-9.
Mora and et.al, 2019. The effects of mean wind speed uncertainty on project finance debt sizing
for offshore wind farms. Applied Energy, 252. p.113419.
Piccio, D.R. and Van Biezen, I., 2018. Political finance and the cartel party thesis. In Handbook
of political party funding. Edward Elgar Publishing.
Shanmuganathan, M., 2020. Behavioural finance in an era of artificial intelligence: Longitudinal
case study of robo-advisors in investment decisions. Journal of Behavioral and
Experimental Finance, 27. p.100297.
Tsindeliani, I.A., 2019. Principles of the public financial law as the means of legal regulation of
public finance. Journal of Legal, Ethical and Regulatory Issues, 22(5). pp.1-12.
Wang and et.al, 2020. The impact of digital finance on financial efficiency. Managerial and
Decision Economics, 41(7). pp.1225-1236.
1 out of 16
Related Documents


Your All-in-One AI-Powered Toolkit for Academic Success.
+13062052269
info@desklib.com
Available 24*7 on WhatsApp / Email
![[object Object]](/_next/static/media/star-bottom.7253800d.svg)
Unlock your academic potential
© 2024 | Zucol Services PVT LTD | All rights reserved.