BUS0002 Finance Assessment: Market Share Analysis & Financials
VerifiedAdded on 2023/06/12
|34
|8924
|277
Report
AI Summary
This document presents a comprehensive finance assessment focusing on market share analysis and financial statement principles. It begins with an analysis of Arden Sunglass Ltd's monthly demand and sales data from 2001 to 2018, calculating average monthly market shares and evaluating a revised market strategy. The assessment explores various business options like customer promotions, competitor mergers, and branch expansions, using excel sheet calculations to decide the best options. Furthermore, it discusses the fundamental principles of financial statements and their components, providing a detailed overview of how organizations can leverage data analytics to inform marketing decisions and improve overall quality. Desklib offers similar solved assignments and past papers for students.

Running head: FINANCE
Finance
Name of the Student:
Name of the University:
Author’s Note:
Finance
Name of the Student:
Name of the University:
Author’s Note:
Paraphrase This Document
Need a fresh take? Get an instant paraphrase of this document with our AI Paraphraser
1
FINANCE
Table of Contents
Assessment 2...................................................................................................................................2
Answer to Question 1..................................................................................................................2
Answer to Question 2..................................................................................................................2
Average Monthly Market Shares.................................................................................................2
Answer to Question 3................................................................................................................12
Answer to Question 4................................................................................................................12
Answer to Question 5................................................................................................................12
Answer to Question 6................................................................................................................12
Answer to Question 7................................................................................................................18
Assessment 3.................................................................................................................................29
Introduction................................................................................................................................29
Overview of the Company.........................................................................................................29
Fundamental Principles of Financial Statement........................................................................29
Components of the Financial Statements..................................................................................32
Reference.......................................................................................................................................34
2
FINANCE
Assessment 2
Answer to Question 1
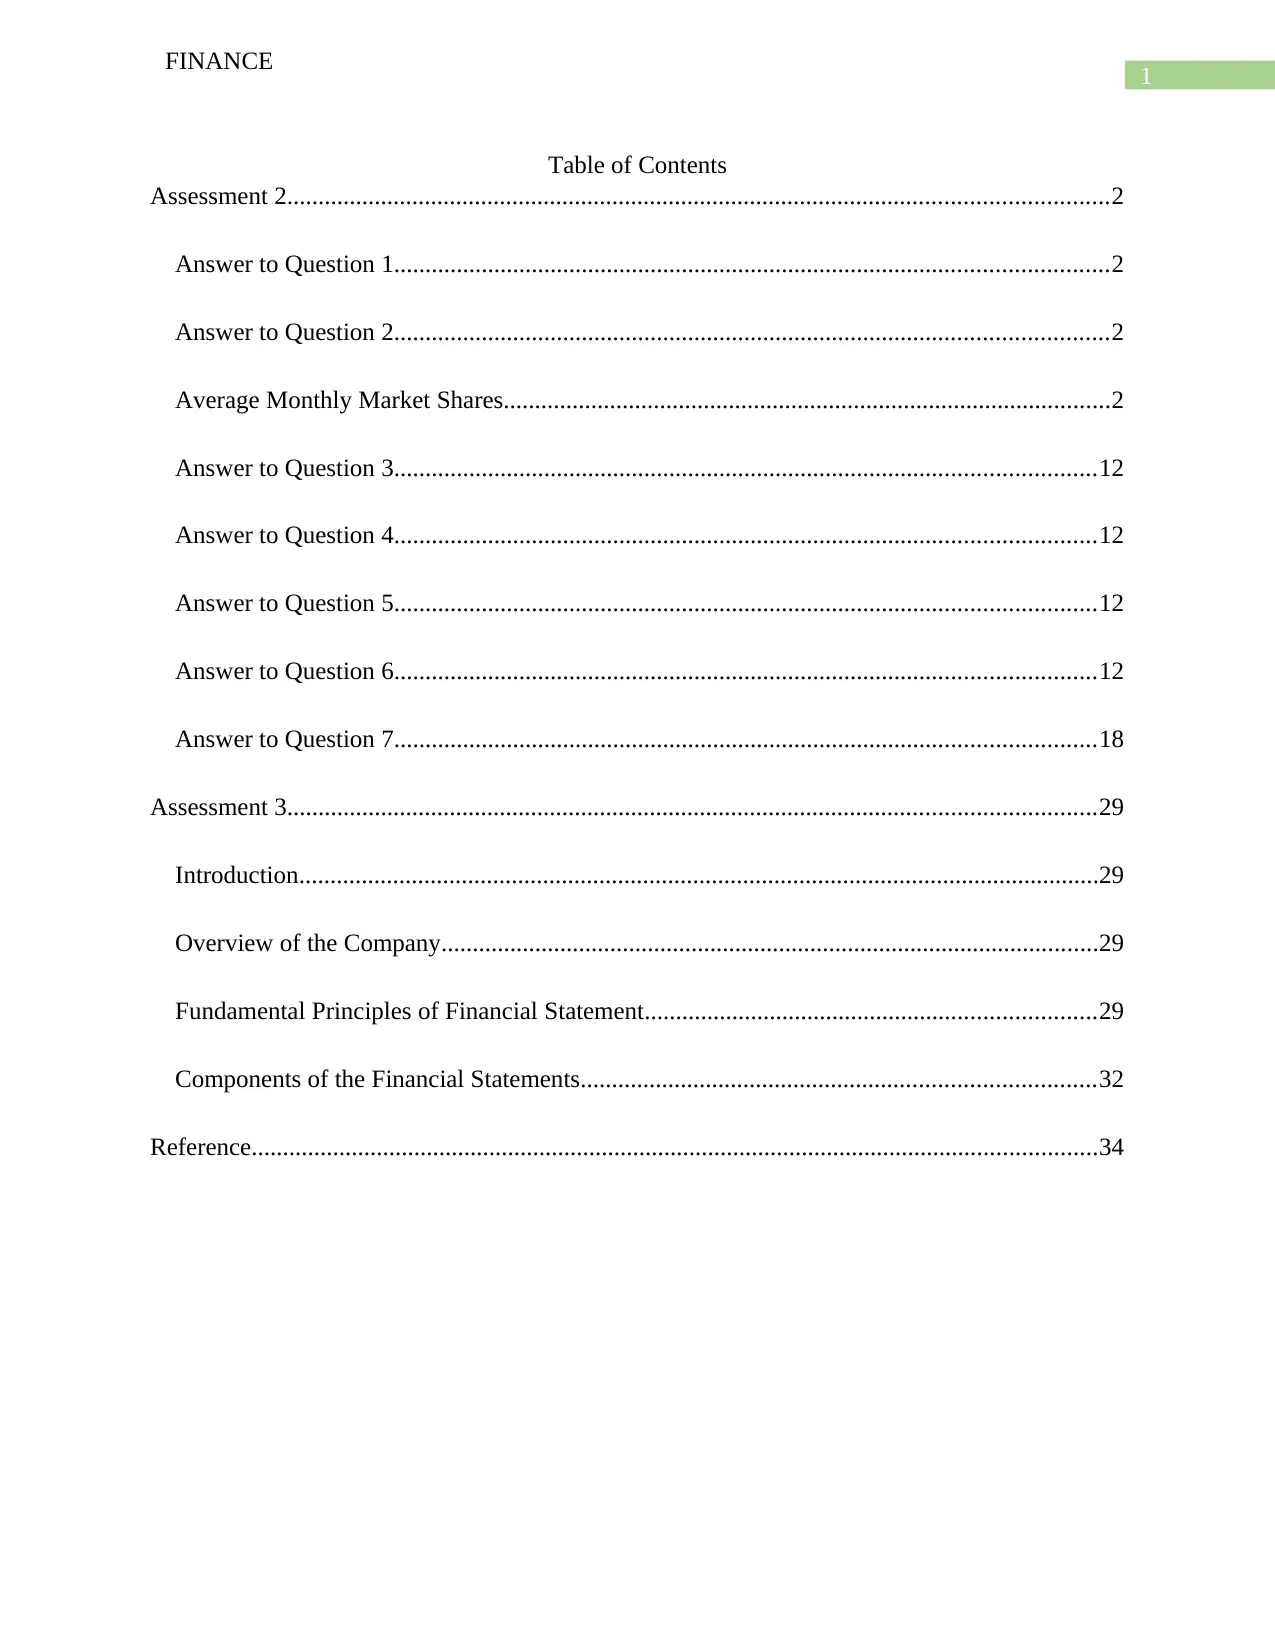
Figure 1: (Chart Showing Monthly Demand and Supply Analysis)
Source: (Created by the Author)
As per the given question which deals with the demand and sales of Arden Sunglass ltd
which operates in UK. As per the estimates and the figure which is shown above it can clearly be
identified that the demand for the products of the business is much more than what is supplied by
the company. The blue lines in the chart represents the demand for the products of the business
and the red lines show the sales of the business. The general trend shows that the demand for the
business is much higher tan what is supplied by the business.
Answer to Question 2
Average Monthly Market Shares
Year Month Demand (£) Sales (£)
Monthly Market
Share
Revised Market
Share
2001 Jan-01 £ £ 51.24%
FINANCE
Assessment 2
Answer to Question 1
Figure 1: (Chart Showing Monthly Demand and Supply Analysis)
Source: (Created by the Author)
As per the given question which deals with the demand and sales of Arden Sunglass ltd
which operates in UK. As per the estimates and the figure which is shown above it can clearly be
identified that the demand for the products of the business is much more than what is supplied by
the company. The blue lines in the chart represents the demand for the products of the business
and the red lines show the sales of the business. The general trend shows that the demand for the
business is much higher tan what is supplied by the business.
Answer to Question 2
Average Monthly Market Shares
Year Month Demand (£) Sales (£)
Monthly Market
Share
Revised Market
Share
2001 Jan-01 £ £ 51.24%
⊘ This is a preview!⊘
Do you want full access?
Subscribe today to unlock all pages.
Trusted by 1+ million students worldwide

3
FINANCE
3,68,551 1,88,833
2001 Feb-01
£
4,17,129
£
1,31,313 31.48%
2001 Mar-01
£
5,16,926
£
95,541 18.48% 25.92%
2001 Apr-01
£
6,50,967
£
1,08,844 16.72% 26.09%
2001 May-01
£
7,06,384
£
1,59,208 22.54% 30.80%
2001 Jun-01
£
7,55,445
£
2,33,739 30.94% 35.91%
2001 Jul-01
£
7,03,159
£
3,30,675 47.03% 46.81%
2001 Aug-01
£
6,20,501
£
3,47,421 55.99% 45.99%
2001 Sep-01
£
5,54,541
£
3,92,409 70.76% 55.81%
2001 Oct-01
£
4,52,446
£
3,56,307 78.75% 57.42%
2001 Nov-01
£
3,71,170
£
3,07,694 82.90% 55.49%
2001 Dec-01
£
3,34,718
£
2,33,252 69.69% 51.55%
2002 Jan-02
£
3,57,444
£
1,52,285 42.60% 41.03%
2002 Feb-02
£
4,34,993
£
1,24,103 28.53% 37.08%
2002 Mar-02
£
5,22,225
£
1,49,449 28.62% 41.81%
2002 Apr-02
£
6,35,459
£
1,48,283 23.33% 34.09%
2002 May-02
£
7,21,944
£
1,86,184 25.79% 35.65%
2002 Jun-02
£
7,64,136
£
2,34,520 30.69% 36.91%
2002 Jul-02
£
7,27,818
£
3,18,466 43.76% 44.11%
2002 Aug-02
£
6,46,976
£
3,34,721 51.74% 43.80%
2002 Sep-02
£
5,46,411
£
3,53,894 64.77% 48.62%
2002 Oct-02
£
4,34,262
£
3,69,437 85.07% 57.10%
2002 Nov-02
£
3,78,414
£
2,80,724 74.18% 51.38%
2002 Dec-02
£
3,54,169
£
2,23,584 63.13% 51.49%
Paraphrase This Document
Need a fresh take? Get an instant paraphrase of this document with our AI Paraphraser
4
FINANCE
2003 Jan-03
£
3,89,224
£
1,96,541 50.50% 51.94%
2003 Feb-03
£
4,79,703
£
1,57,239 32.78% 44.40%
2003 Mar-03
£
5,43,848
£
1,30,796 24.05% 33.60%
2003 Apr-03
£
6,67,792
£
1,62,568 24.34% 33.89%
2003 May-03
£
7,24,583
£
2,04,618 28.24% 37.62%
2003 Jun-03
£
7,49,334
£
2,18,974 29.22% 32.79%
2003 Jul-03
£
7,21,558
£
3,10,977 43.10% 42.92%
2003 Aug-03
£
6,73,315
£
3,49,912 51.97% 46.70%
2003 Sep-03
£
5,46,640
£
4,03,055 73.73% 55.86%
2003 Oct-03
£
4,51,759
£
3,46,284 76.65% 51.43%
2003 Nov-03
£
3,73,478
£
3,31,439 88.74% 60.63%
2003 Dec-03
£
3,53,049
£
2,40,809 68.21% 53.30%
2004 Jan-04
£
3,68,165
£
2,14,897 58.37% 57.54%
2004 Feb-04
£
4,70,002
£
1,11,597 23.74% 31.61%
2004 Mar-04
£
5,66,494
£
1,14,126 20.15% 31.00%
2004 Apr-04
£
6,82,433
£
1,25,591 18.40% 26.72%
2004 May-04
£
7,48,126
£
2,02,967 27.13% 35.83%
2004 Jun-04
£
7,76,188
£
2,72,444 35.10% 39.92%
2004 Jul-04
£
7,56,433
£
3,37,146 44.57% 45.07%
2004 Aug-04
£
6,54,757
£
3,95,260 60.37% 50.92%
2004 Sep-04
£
5,76,538
£
3,53,852 61.38% 46.78%
2004 Oct-04
£
4,55,581
£
3,66,877 80.53% 56.03%
2004 Nov-04
£
3,91,628
£
3,19,445 81.57% 55.41%
2004 Dec-04 £ £ 64.28% 52.36%

5
FINANCE
3,71,070 2,38,536
2005 Jan-05
£
3,88,952
£
2,12,728 54.69% 54.32%
2005 Feb-05
£
4,96,429
£
1,57,913 31.81% 42.56%
2005 Mar-05
£
5,96,610
£
1,59,828 26.79% 41.09%
2005 Apr-05
£
6,89,463
£
1,50,522 21.83% 30.32%
2005 May-05
£
7,56,782
£
2,06,948 27.35% 34.69%
2005 Jun-05
£
7,87,665
£
2,81,104 35.69% 40.77%
2005 Jul-05
£
7,61,154
£
3,00,531 39.48% 39.71%
2005 Aug-05
£
6,61,650
£
3,87,069 58.50% 49.14%
2005 Sep-05
£
5,80,530
£
3,80,822 65.60% 50.03%
2005 Oct-05
£
4,90,041
£
3,44,330 70.27% 52.04%
2005 Nov-05
£
3,93,041
£
3,55,658 90.49% 61.26%
2005 Dec-05
£
3,74,507
£
2,36,762 63.22% 48.31%
2006 Jan-06
£
4,14,412
£
1,89,410 45.71% 48.19%
2006 Feb-06
£
4,62,493
£
1,79,046 38.71% 47.81%
2006 Mar-06
£
5,86,895
£
1,35,035 23.01% 32.58%
2006 Apr-06
£
7,08,987
£
1,74,693 24.64% 37.77%
2006 May-06
£
7,48,793
£
1,73,687 23.20% 29.59%
2006 Jun-06
£
7,76,754
£
2,74,845 35.38% 38.77%
2006 Jul-06
£
7,46,006
£
3,64,719 48.89% 48.71%
2006 Aug-06
£
7,00,271
£
3,81,602 54.49% 49.13%
2006 Sep-06
£
5,92,744
£
3,65,345 61.64% 48.97%
2006 Oct-06
£
4,95,922
£
4,00,814 80.82% 57.24%
2006 Nov-06
£
4,19,281
£
3,39,103 80.88% 57.21%
⊘ This is a preview!⊘
Do you want full access?
Subscribe today to unlock all pages.
Trusted by 1+ million students worldwide
6
FINANCE
2006 Dec-06
£
4,00,245
£
2,32,415 58.07% 46.87%
2007 Jan-07
£
4,13,332
£
1,87,342 45.32% 44.68%
2007 Feb-07
£
5,12,546
£
1,55,212 30.28% 38.78%
2007 Mar-07
£
6,02,873
£
1,22,653 20.34% 29.67%
2007 Apr-07
£
7,05,970
£
1,89,631 26.86% 37.00%
2007 May-07
£
7,65,270
£
2,31,431 30.24% 38.39%
2007 Jun-07
£
7,99,129
£
2,77,533 34.73% 39.31%
2007 Jul-07
£
7,55,094
£
3,67,372 48.65% 48.01%
2007 Aug-07
£
6,79,151
£
4,15,329 61.15% 51.97%
2007 Sep-07
£
6,16,253
£
4,19,558 68.08% 55.56%
2007 Oct-07
£
4,72,628
£
4,14,523 87.71% 61.04%
2007 Nov-07
£
3,99,200
£
3,01,126 75.43% 48.86%
2007 Dec-07
£
3,91,921
£
2,50,647 63.95% 53.03%
2008 Jan-08
£
4,27,679
£
1,78,605 41.76% 44.74%
2008 Feb-08
£
4,92,368
£
1,36,639 27.75% 34.86%
2008 Mar-08
£
6,14,959
£
1,43,836 23.39% 33.63%
2008 Apr-08
£
6,93,240
£
1,67,242 24.12% 33.97%
2008 May-08
£
7,99,444
£
2,17,811 27.25% 35.42%
2008 Jun-08
£
7,98,267
£
2,90,159 36.35% 41.86%
2008 Jul-08
£
7,95,411
£
3,71,498 46.71% 46.47%
2008 Aug-08
£
7,22,298
£
3,81,659 52.84% 47.81%
2008 Sep-08
£
6,27,368
£
4,07,801 65.00% 51.27%
2008 Oct-08
£
5,21,100
£
4,21,426 80.87% 58.35%
2008 Nov-08 £ £ 83.10% 54.54%
Paraphrase This Document
Need a fresh take? Get an instant paraphrase of this document with our AI Paraphraser

7
FINANCE
4,11,721 3,42,156
2008 Dec-08
£
3,83,842
£
2,75,783 71.85% 52.92%
2009 Jan-09
£
4,53,359
£
2,02,672 44.70% 49.23%
2009 Feb-09
£
5,17,732
£
1,72,103 33.24% 44.84%
2009 Mar-09
£
5,99,005
£
1,76,633 29.49% 38.96%
2009 Apr-09
£
7,31,081
£
1,62,386 22.21% 31.36%
2009 May-09
£
7,93,971
£
2,47,816 31.21% 41.37%
2009 Jun-09
£
8,05,458
£
3,04,580 37.81% 41.66%
2009 Jul-09
£
7,73,524
£
3,35,442 43.37% 42.25%
2009 Aug-09
£
7,10,963
£
4,24,563 59.72% 52.71%
2009 Sep-09
£
6,35,133
£
4,13,634 65.13% 53.47%
2009 Oct-09
£
5,12,081
£
3,79,183 74.05% 53.33%
2009 Nov-09
£
4,25,599
£
3,29,763 77.48% 51.92%
2009 Dec-09
£
4,29,413
£
2,88,527 67.19% 56.34%
2010 Jan-10
£
4,66,543
£
2,26,867 48.63% 53.31%
2010 Feb-10
£
5,33,329
£
2,00,340 37.56% 46.65%
2010 Mar-10
£
6,43,751
£
1,65,747 25.75% 35.53%
2010 Apr-10
£
7,39,483
£
1,81,876 24.59% 34.10%
2010 May-10
£
7,93,430
£
1,91,366 24.12% 29.73%
2010 Jun-10
£
8,36,175
£
2,58,123 30.87% 34.91%
2010 Jul-10
£
7,86,523
£
3,40,356 43.27% 42.90%
2010 Aug-10
£
7,34,067
£
3,83,218 52.20% 45.83%
2010 Sep-10
£
6,36,764
£
4,38,370 68.84% 55.74%
2010 Oct-10
£
5,05,462
£
3,73,699 73.93% 50.91%
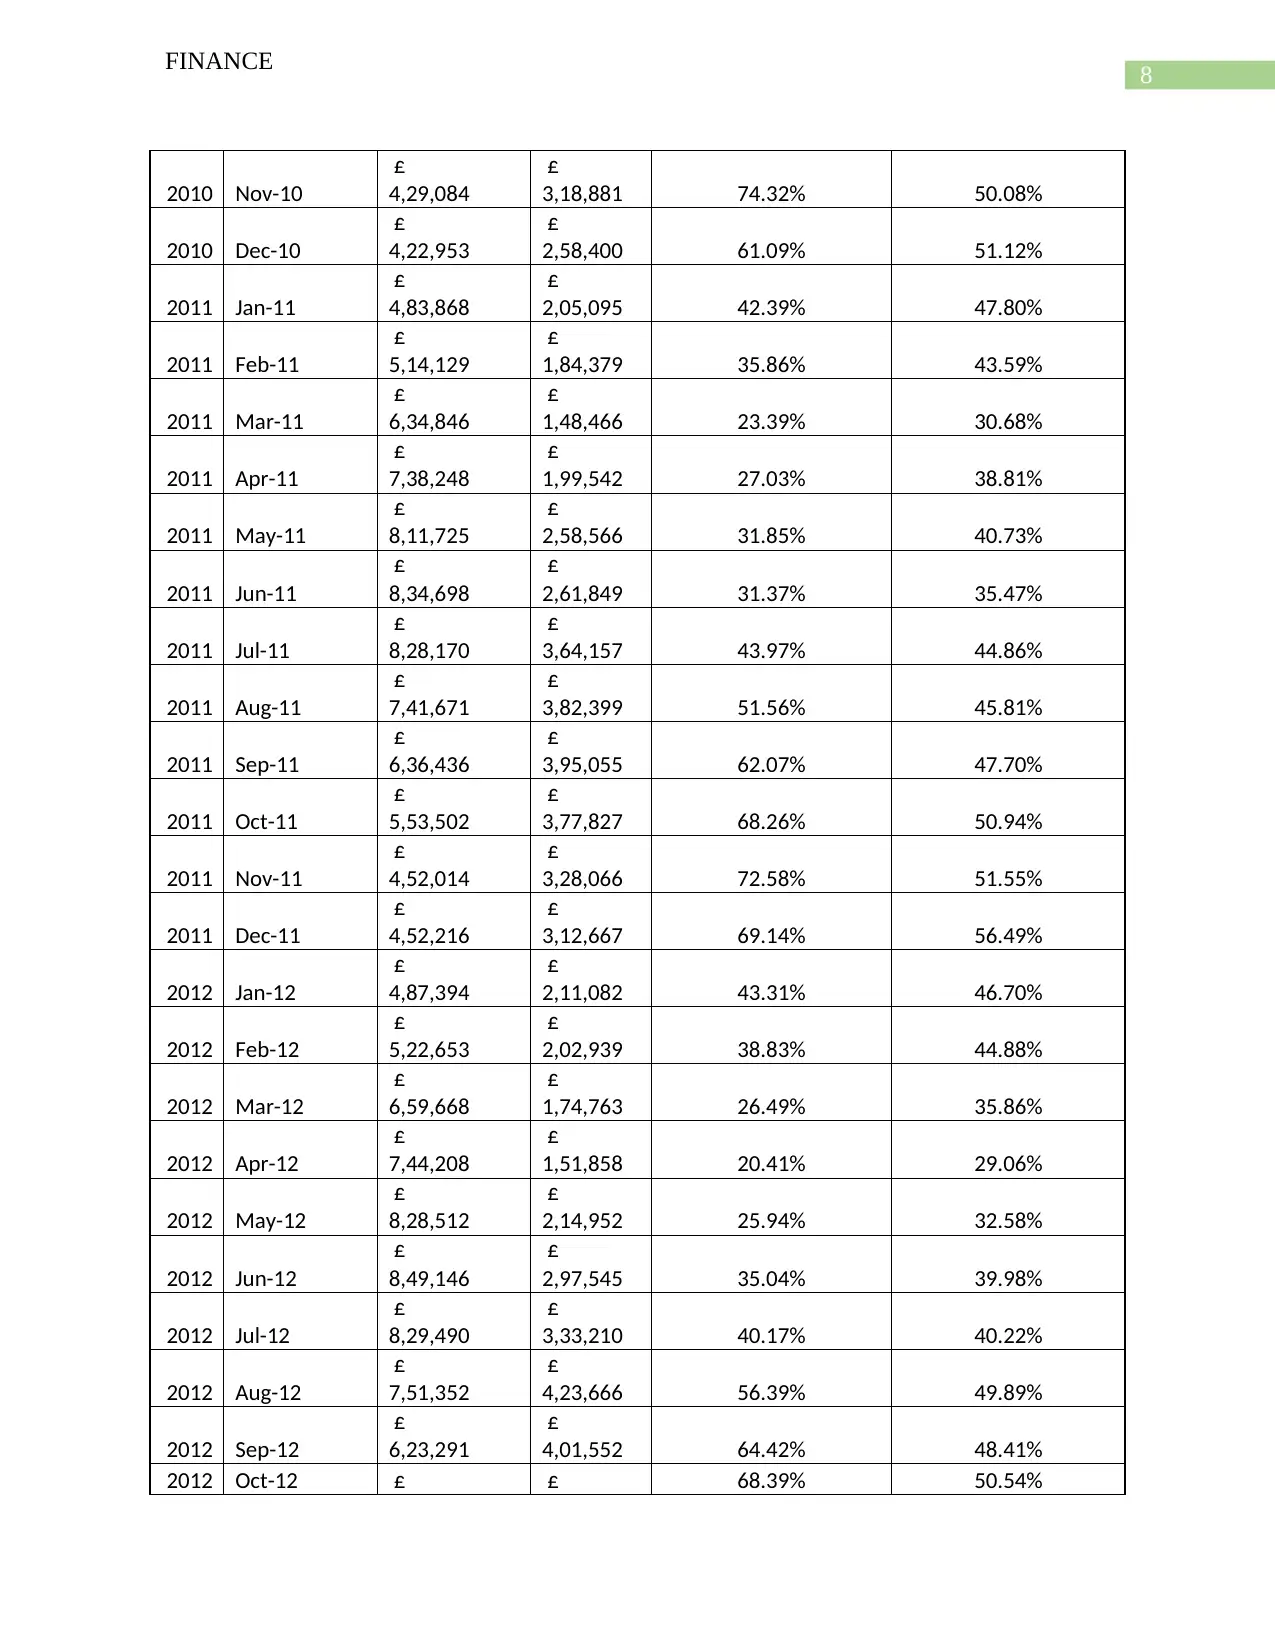
8
FINANCE
2010 Nov-10
£
4,29,084
£
3,18,881 74.32% 50.08%
2010 Dec-10
£
4,22,953
£
2,58,400 61.09% 51.12%
2011 Jan-11
£
4,83,868
£
2,05,095 42.39% 47.80%
2011 Feb-11
£
5,14,129
£
1,84,379 35.86% 43.59%
2011 Mar-11
£
6,34,846
£
1,48,466 23.39% 30.68%
2011 Apr-11
£
7,38,248
£
1,99,542 27.03% 38.81%
2011 May-11
£
8,11,725
£
2,58,566 31.85% 40.73%
2011 Jun-11
£
8,34,698
£
2,61,849 31.37% 35.47%
2011 Jul-11
£
8,28,170
£
3,64,157 43.97% 44.86%
2011 Aug-11
£
7,41,671
£
3,82,399 51.56% 45.81%
2011 Sep-11
£
6,36,436
£
3,95,055 62.07% 47.70%
2011 Oct-11
£
5,53,502
£
3,77,827 68.26% 50.94%
2011 Nov-11
£
4,52,014
£
3,28,066 72.58% 51.55%
2011 Dec-11
£
4,52,216
£
3,12,667 69.14% 56.49%
2012 Jan-12
£
4,87,394
£
2,11,082 43.31% 46.70%
2012 Feb-12
£
5,22,653
£
2,02,939 38.83% 44.88%
2012 Mar-12
£
6,59,668
£
1,74,763 26.49% 35.86%
2012 Apr-12
£
7,44,208
£
1,51,858 20.41% 29.06%
2012 May-12
£
8,28,512
£
2,14,952 25.94% 32.58%
2012 Jun-12
£
8,49,146
£
2,97,545 35.04% 39.98%
2012 Jul-12
£
8,29,490
£
3,33,210 40.17% 40.22%
2012 Aug-12
£
7,51,352
£
4,23,666 56.39% 49.89%
2012 Sep-12
£
6,23,291
£
4,01,552 64.42% 48.41%
2012 Oct-12 £ £ 68.39% 50.54%
⊘ This is a preview!⊘
Do you want full access?
Subscribe today to unlock all pages.
Trusted by 1+ million students worldwide
9
FINANCE
5,55,211 3,79,735
2012 Nov-12
£
4,77,199
£
3,61,852 75.83% 58.06%
2012 Dec-12
£
4,51,020
£
2,83,640 62.89% 51.09%
2013 Jan-13
£
5,03,591
£
2,61,158 51.86% 54.73%
2013 Feb-13
£
5,41,958
£
1,78,947 33.02% 39.68%
2013 Mar-13
£
6,44,774
£
1,68,390 26.12% 33.44%
2013 Apr-13
£
7,41,074
£
1,66,317 22.44% 30.69%
2013 May-13
£
8,29,153
£
2,53,373 30.56% 39.30%
2013 Jun-13
£
8,31,079
£
2,79,125 33.59% 37.66%
2013 Jul-13
£
8,43,282
£
3,97,302 47.11% 47.92%
2013 Aug-13
£
7,47,221
£
4,07,504 54.54% 49.03%
2013 Sep-13
£
6,70,408
£
4,39,103 65.50% 52.07%
2013 Oct-13
£
5,33,377
£
4,23,265 79.36% 56.65%
2013 Nov-13
£
4,72,841
£
3,61,822 76.52% 53.97%
2013 Dec-13
£
4,35,820
£
2,84,288 65.23% 53.30%
2014 Jan-14
£
4,75,700
£
2,14,241 45.04% 45.31%
2014 Feb-14
£
5,54,336
£
2,04,660 36.92% 46.96%
2014 Mar-14
£
6,70,708
£
1,95,692 29.18% 41.14%
2014 Apr-14
£
7,61,764
£
2,08,952 27.43% 37.69%
2014 May-14
£
8,35,209
£
2,53,961 30.41% 37.86%
2014 Jun-14
£
8,64,701
£
3,36,268 38.89% 44.14%
2014 Jul-14
£
8,38,229
£
3,78,643 45.17% 45.34%
2014 Aug-14
£
7,73,076
£
4,19,389 54.25% 48.50%
2014 Sep-14
£
6,62,804
£
4,56,313 68.85% 54.44%
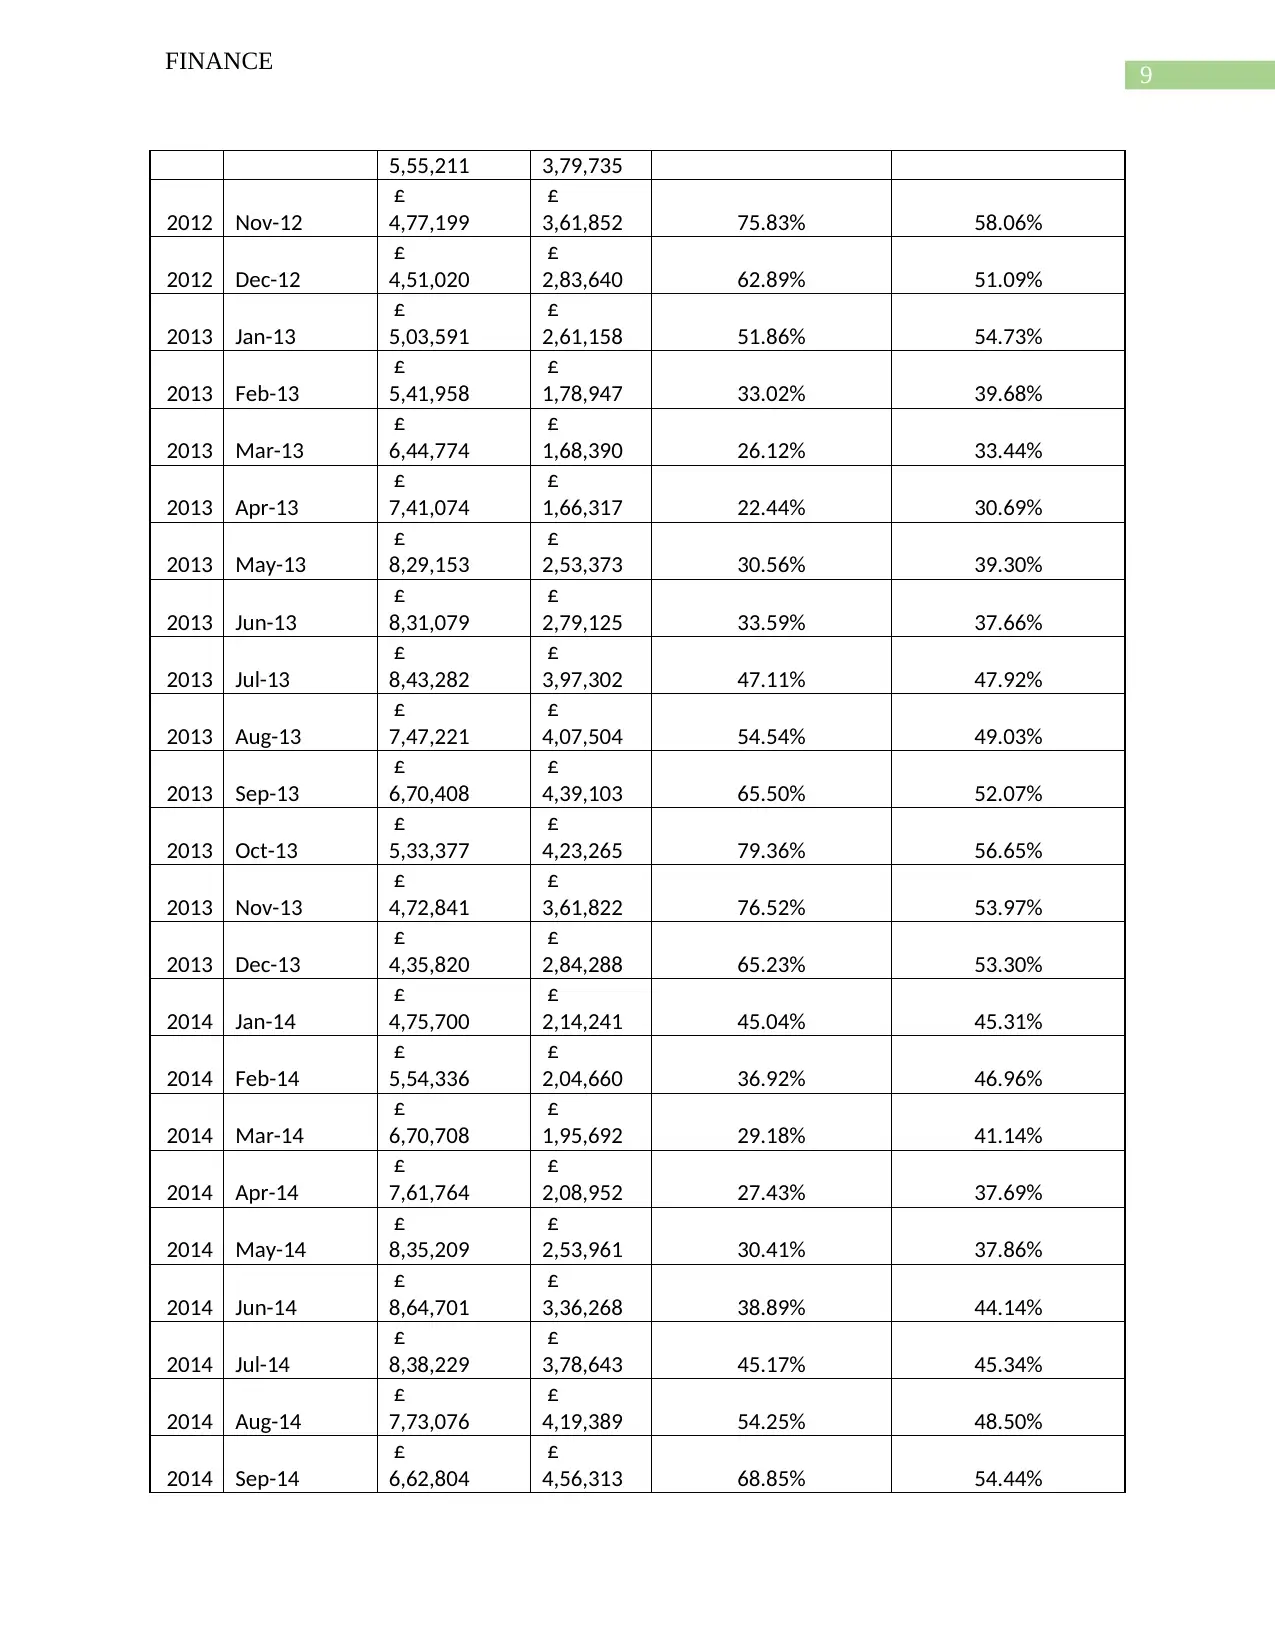
Paraphrase This Document
Need a fresh take? Get an instant paraphrase of this document with our AI Paraphraser
10
FINANCE
2014 Oct-14
£
5,41,434
£
4,39,824 81.23% 56.89%
2014 Nov-14
£
5,13,704
£
3,68,689 71.77% 55.63%
2014 Dec-14
£
4,54,391
£
3,38,282 74.45% 62.48%
2015 Jan-15
£
5,05,783
£
2,49,627 49.35% 48.59%
2015 Feb-15
£
5,94,044
£
1,78,664 30.08% 39.32%
2015 Mar-15
£
6,89,387
£
1,56,912 22.76% 31.02%
2015 Apr-15
£
7,92,840
£
2,31,568 29.21% 38.98%
2015 May-15
£
8,57,460
£
2,41,777 28.20% 35.07%
2015 Jun-15
£
8,50,573
£
2,99,204 35.18% 37.74%
2015 Jul-15
£
8,52,187
£
4,05,570 47.59% 47.30%
2015 Aug-15
£
7,85,422
£
4,06,918 51.81% 47.84%
2015 Sep-15
£
6,97,142
£
4,06,795 58.35% 47.74%
2015 Oct-15
£
5,99,251
£
3,91,781 65.38% 49.88%
2015 Nov-15
£
5,20,934
£
3,94,270 75.69% 56.56%
2015 Dec-15
£
4,50,174
£
2,78,326 61.83% 46.45%
2016 Jan-16
£
5,16,842
£
2,18,522 42.28% 41.95%
2016 Feb-16
£
5,65,665
£
2,08,426 36.85% 46.30%
2016 Mar-16
£
6,99,158
£
1,96,521 28.11% 38.02%
2016 Apr-16
£
8,08,765
£
2,19,456 27.13% 38.80%
2016 May-16
£
8,47,392
£
2,39,685 28.29% 34.28%
2016 Jun-16
£
8,79,403
£
2,88,358 32.79% 35.65%
2016 Jul-16
£
8,42,308
£
3,55,794 42.24% 41.99%
2016 Aug-16
£
7,84,861
£
4,48,950 57.20% 51.05%
2016 Sep-16 £ £ 60.90% 50.64%
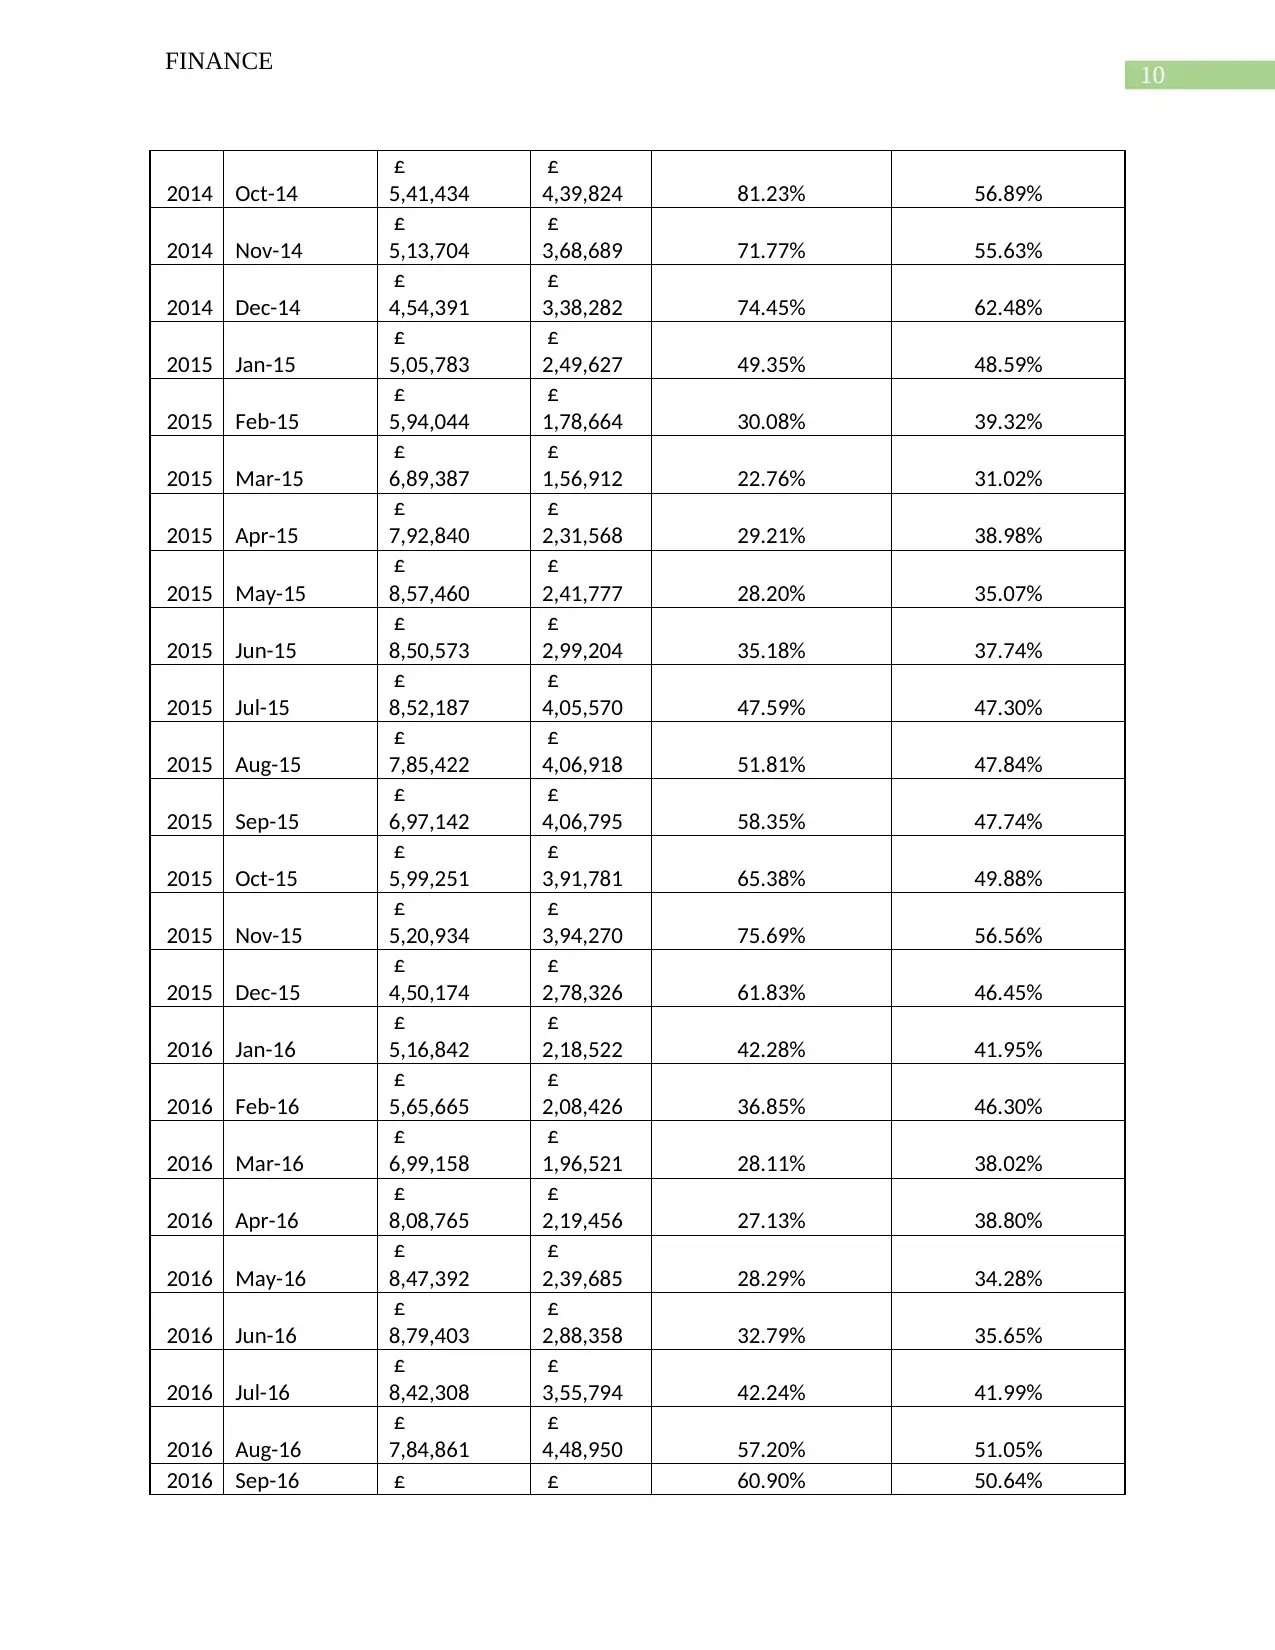
11
FINANCE
7,00,383 4,26,546
2016 Oct-16
£
5,94,204
£
4,48,496 75.48% 57.14%
2016 Nov-16
£
4,93,375
£
3,96,732 80.41% 56.64%
2016 Dec-16
£
4,73,624
£
3,45,353 72.92% 58.12%
2017 Jan-17
£
5,41,584
£
2,55,315 47.14% 51.75%
2017 Feb-17
£
5,87,806
£
2,13,980 36.40% 45.18%
2017 Mar-17
£
7,06,489
£
2,16,828 30.69% 40.04%
2017 Apr-17
£
7,98,722
£
2,31,211 28.95% 39.33%
2017 May-17
£
8,89,284
£
2,74,710 30.89% 38.88%
2017 Jun-17
£
8,71,860
£
3,32,658 38.16% 41.65%
2017 Jul-17
£
8,76,995
£
3,94,499 44.98% 44.36%
2017 Aug-17
£
8,17,547
£
4,56,476 55.83% 52.36%
2017 Sep-17
£
6,81,290
£
4,50,068 66.06% 51.32%
2017 Oct-17
£
5,79,437
£
4,57,468 78.95% 55.96%
2017 Nov-17
£
5,40,300
£
3,59,933 66.62% 52.83%
2017 Dec-17
£
5,19,108
£
3,02,636 58.30% 52.23%
2018 Jan-18
£
5,45,416
£
2,84,025 52.07% 52.57%
Average Monthly
Share 48.16% 45.17%
As shown in the above table the average monthly shares for all the years comes to about
48.16% which more than the revised market share which is computed considering the sales
which are related to each month happens in two months earlier.
⊘ This is a preview!⊘
Do you want full access?
Subscribe today to unlock all pages.
Trusted by 1+ million students worldwide
1 out of 34
Related Documents


Your All-in-One AI-Powered Toolkit for Academic Success.
+13062052269
info@desklib.com
Available 24*7 on WhatsApp / Email
![[object Object]](/_next/static/media/star-bottom.7253800d.svg)
Unlock your academic potential
Copyright © 2020–2026 A2Z Services. All Rights Reserved. Developed and managed by ZUCOL.