Accounting and Finance for Managers: Company Performance and Financing
VerifiedAdded on 2022/12/29
|12
|3060
|48
Report
AI Summary
This report presents a detailed financial analysis and comparison of three companies: Green Core Group Plc, Hilton Food Group Plc, and Premier Foods Plc. Section A focuses on the overview, strategies, and financial and non-financial ratio analysis of each company, including ROE, ROCE, profit margin, and asset turnover, spanning three years. The analysis highlights key performance indicators and trends, offering insights into each company's strengths and weaknesses. Section B delves into financing methods, differentiating between internal and external sources, and discussing retained earnings, equity financing, and debt financing. The report provides a comprehensive understanding of financial performance, ratio analysis, and funding strategies, providing a basis for informed decision-making.

Accounting and Finance for
Managers
Managers
Paraphrase This Document
Need a fresh take? Get an instant paraphrase of this document with our AI Paraphraser
Table of Contents
INTRODUCTION ..........................................................................................................................3
SECTION A ....................................................................................................................................3
SECTION B ....................................................................................................................................9
CONCLUSION .............................................................................................................................11
REFERENCE.................................................................................................................................12
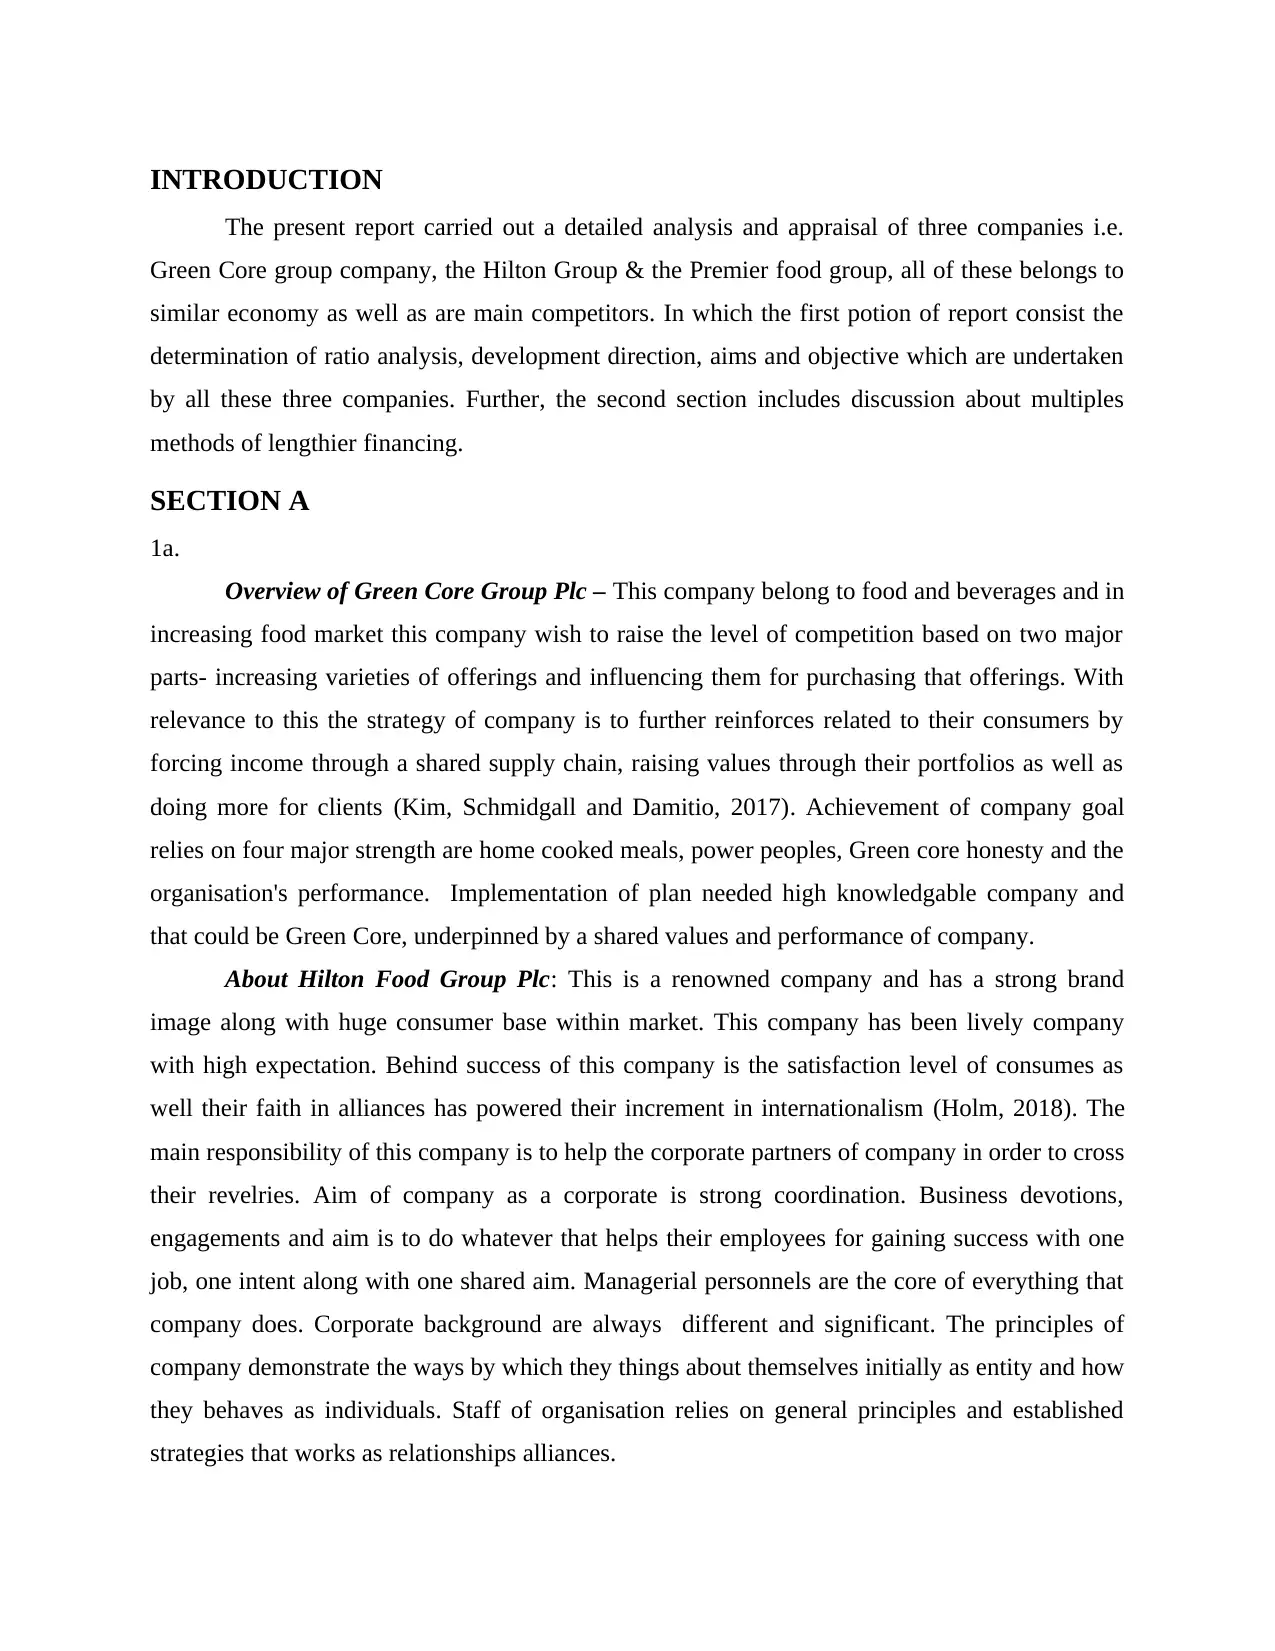
INTRODUCTION
The present report carried out a detailed analysis and appraisal of three companies i.e.
Green Core group company, the Hilton Group & the Premier food group, all of these belongs to
similar economy as well as are main competitors. In which the first potion of report consist the
determination of ratio analysis, development direction, aims and objective which are undertaken
by all these three companies. Further, the second section includes discussion about multiples
methods of lengthier financing.
SECTION A
1a.
Overview of Green Core Group Plc – This company belong to food and beverages and in
increasing food market this company wish to raise the level of competition based on two major
parts- increasing varieties of offerings and influencing them for purchasing that offerings. With
relevance to this the strategy of company is to further reinforces related to their consumers by
forcing income through a shared supply chain, raising values through their portfolios as well as
doing more for clients (Kim, Schmidgall and Damitio, 2017). Achievement of company goal
relies on four major strength are home cooked meals, power peoples, Green core honesty and the
organisation's performance. Implementation of plan needed high knowledgable company and
that could be Green Core, underpinned by a shared values and performance of company.
About Hilton Food Group Plc: This is a renowned company and has a strong brand
image along with huge consumer base within market. This company has been lively company
with high expectation. Behind success of this company is the satisfaction level of consumes as
well their faith in alliances has powered their increment in internationalism (Holm, 2018). The
main responsibility of this company is to help the corporate partners of company in order to cross
their revelries. Aim of company as a corporate is strong coordination. Business devotions,
engagements and aim is to do whatever that helps their employees for gaining success with one
job, one intent along with one shared aim. Managerial personnels are the core of everything that
company does. Corporate background are always different and significant. The principles of
company demonstrate the ways by which they things about themselves initially as entity and how
they behaves as individuals. Staff of organisation relies on general principles and established
strategies that works as relationships alliances.
⊘ This is a preview!⊘
Do you want full access?
Subscribe today to unlock all pages.
Trusted by 1+ million students worldwide
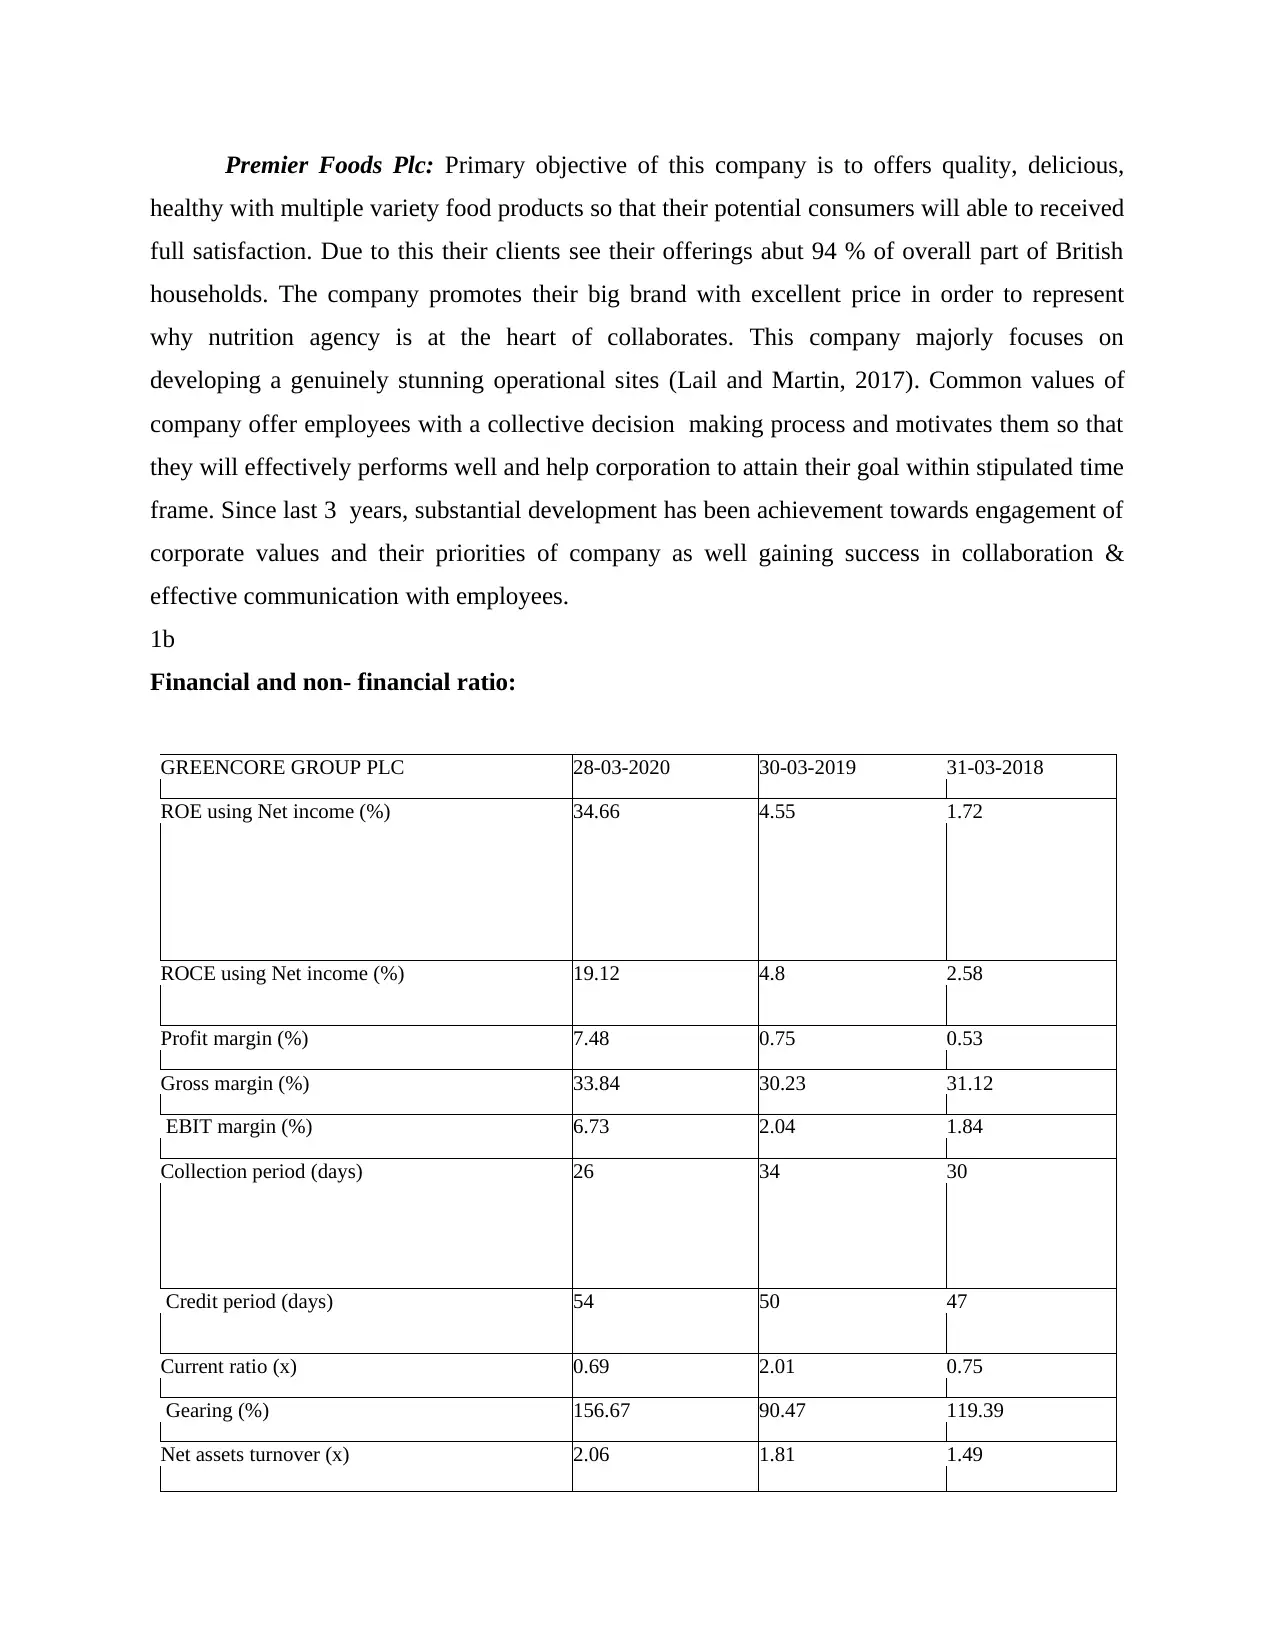
Premier Foods Plc: Primary objective of this company is to offers quality, delicious,
healthy with multiple variety food products so that their potential consumers will able to received
full satisfaction. Due to this their clients see their offerings abut 94 % of overall part of British
households. The company promotes their big brand with excellent price in order to represent
why nutrition agency is at the heart of collaborates. This company majorly focuses on
developing a genuinely stunning operational sites (Lail and Martin, 2017). Common values of
company offer employees with a collective decision making process and motivates them so that
they will effectively performs well and help corporation to attain their goal within stipulated time
frame. Since last 3 years, substantial development has been achievement towards engagement of
corporate values and their priorities of company as well gaining success in collaboration &
effective communication with employees.
1b
Financial and non- financial ratio:
GREENCORE GROUP PLC 28-03-2020 30-03-2019 31-03-2018
ROE using Net income (%) 34.66 4.55 1.72
ROCE using Net income (%) 19.12 4.8 2.58
Profit margin (%) 7.48 0.75 0.53
Gross margin (%) 33.84 30.23 31.12
EBIT margin (%) 6.73 2.04 1.84
Collection period (days) 26 34 30
Credit period (days) 54 50 47
Current ratio (x) 0.69 2.01 0.75
Gearing (%) 156.67 90.47 119.39
Net assets turnover (x) 2.06 1.81 1.49
Paraphrase This Document
Need a fresh take? Get an instant paraphrase of this document with our AI Paraphraser
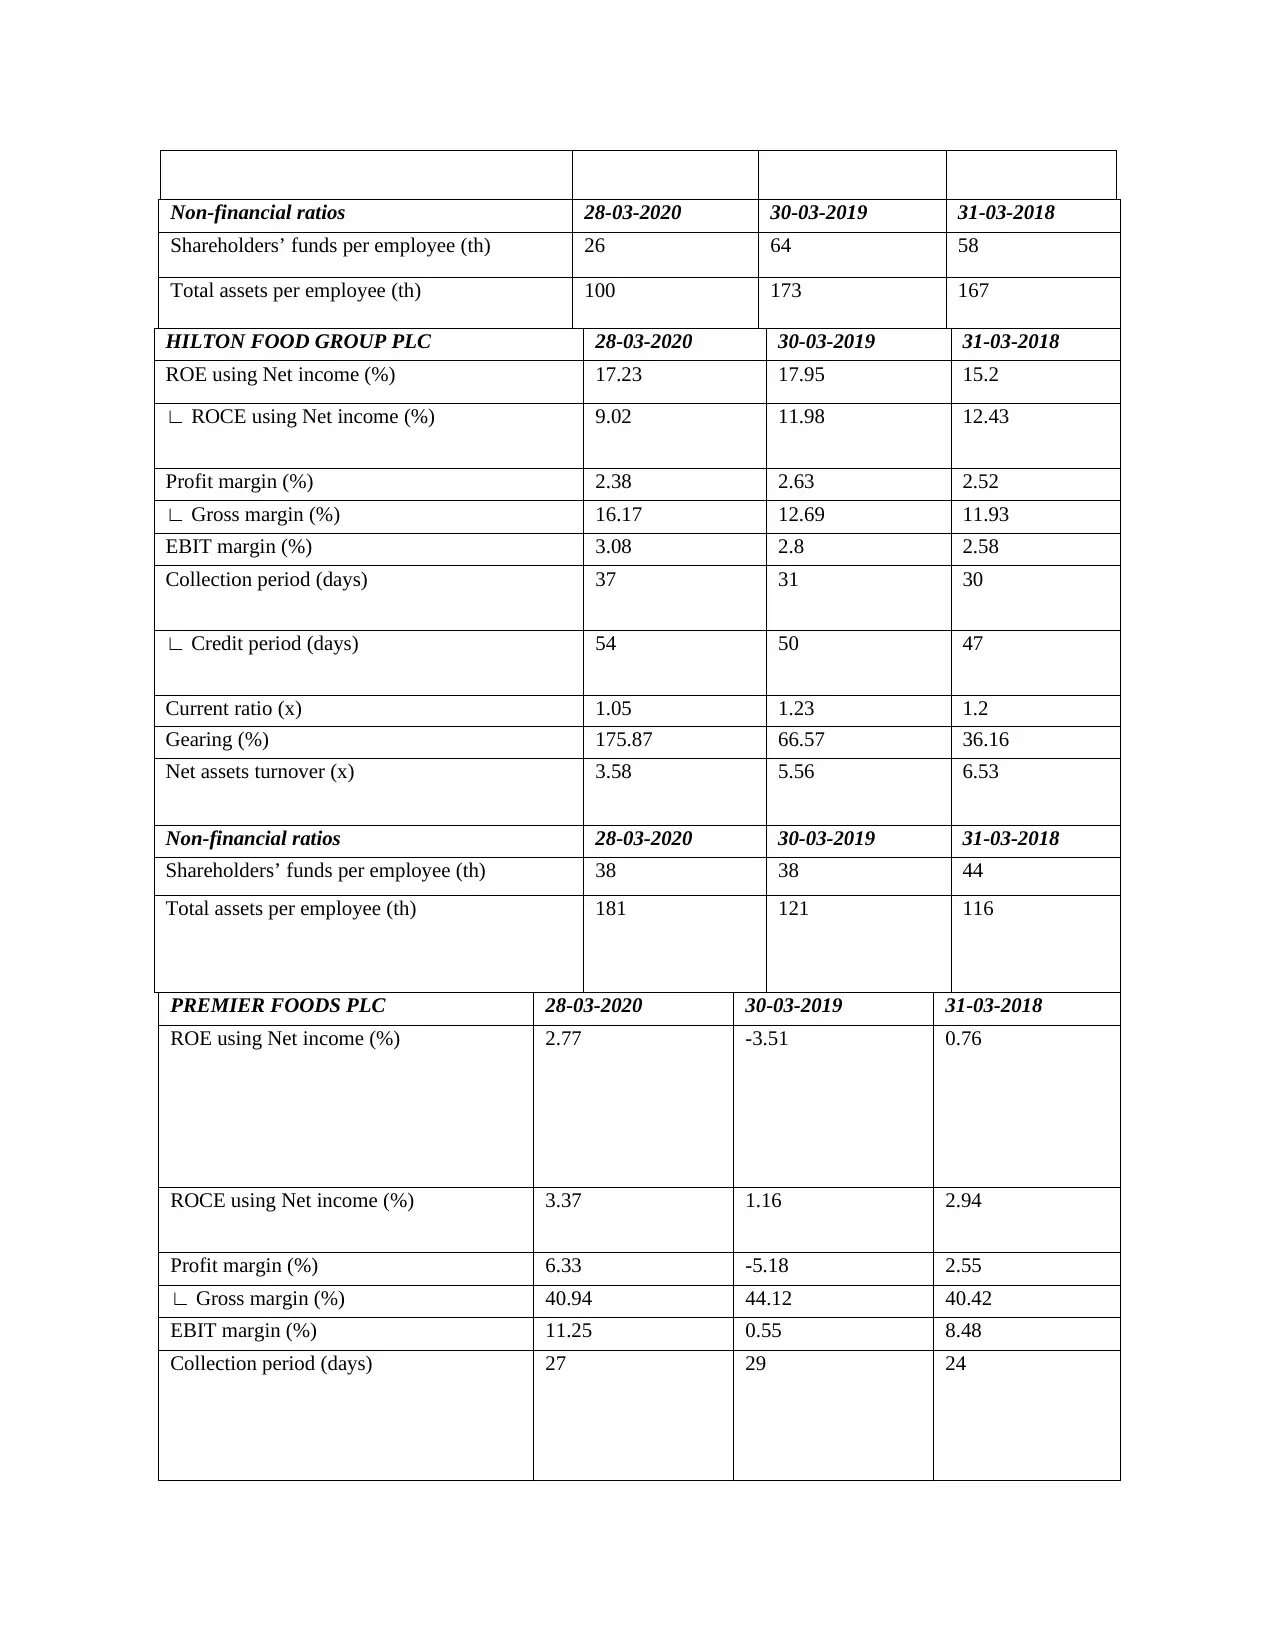
Non-financial ratios 28-03-2020 30-03-2019 31-03-2018
Shareholders’ funds per employee (th) 26 64 58
Total assets per employee (th) 100 173 167
HILTON FOOD GROUP PLC 28-03-2020 30-03-2019 31-03-2018
ROE using Net income (%) 17.23 17.95 15.2
∟ ROCE using Net income (%) 9.02 11.98 12.43
Profit margin (%) 2.38 2.63 2.52
∟ Gross margin (%) 16.17 12.69 11.93
EBIT margin (%) 3.08 2.8 2.58
Collection period (days) 37 31 30
∟ Credit period (days) 54 50 47
Current ratio (x) 1.05 1.23 1.2
Gearing (%) 175.87 66.57 36.16
Net assets turnover (x) 3.58 5.56 6.53
Non-financial ratios 28-03-2020 30-03-2019 31-03-2018
Shareholders’ funds per employee (th) 38 38 44
Total assets per employee (th) 181 121 116
PREMIER FOODS PLC 28-03-2020 30-03-2019 31-03-2018
ROE using Net income (%) 2.77 -3.51 0.76
ROCE using Net income (%) 3.37 1.16 2.94
Profit margin (%) 6.33 -5.18 2.55
∟ Gross margin (%) 40.94 44.12 40.42
EBIT margin (%) 11.25 0.55 8.48
Collection period (days) 27 29 24
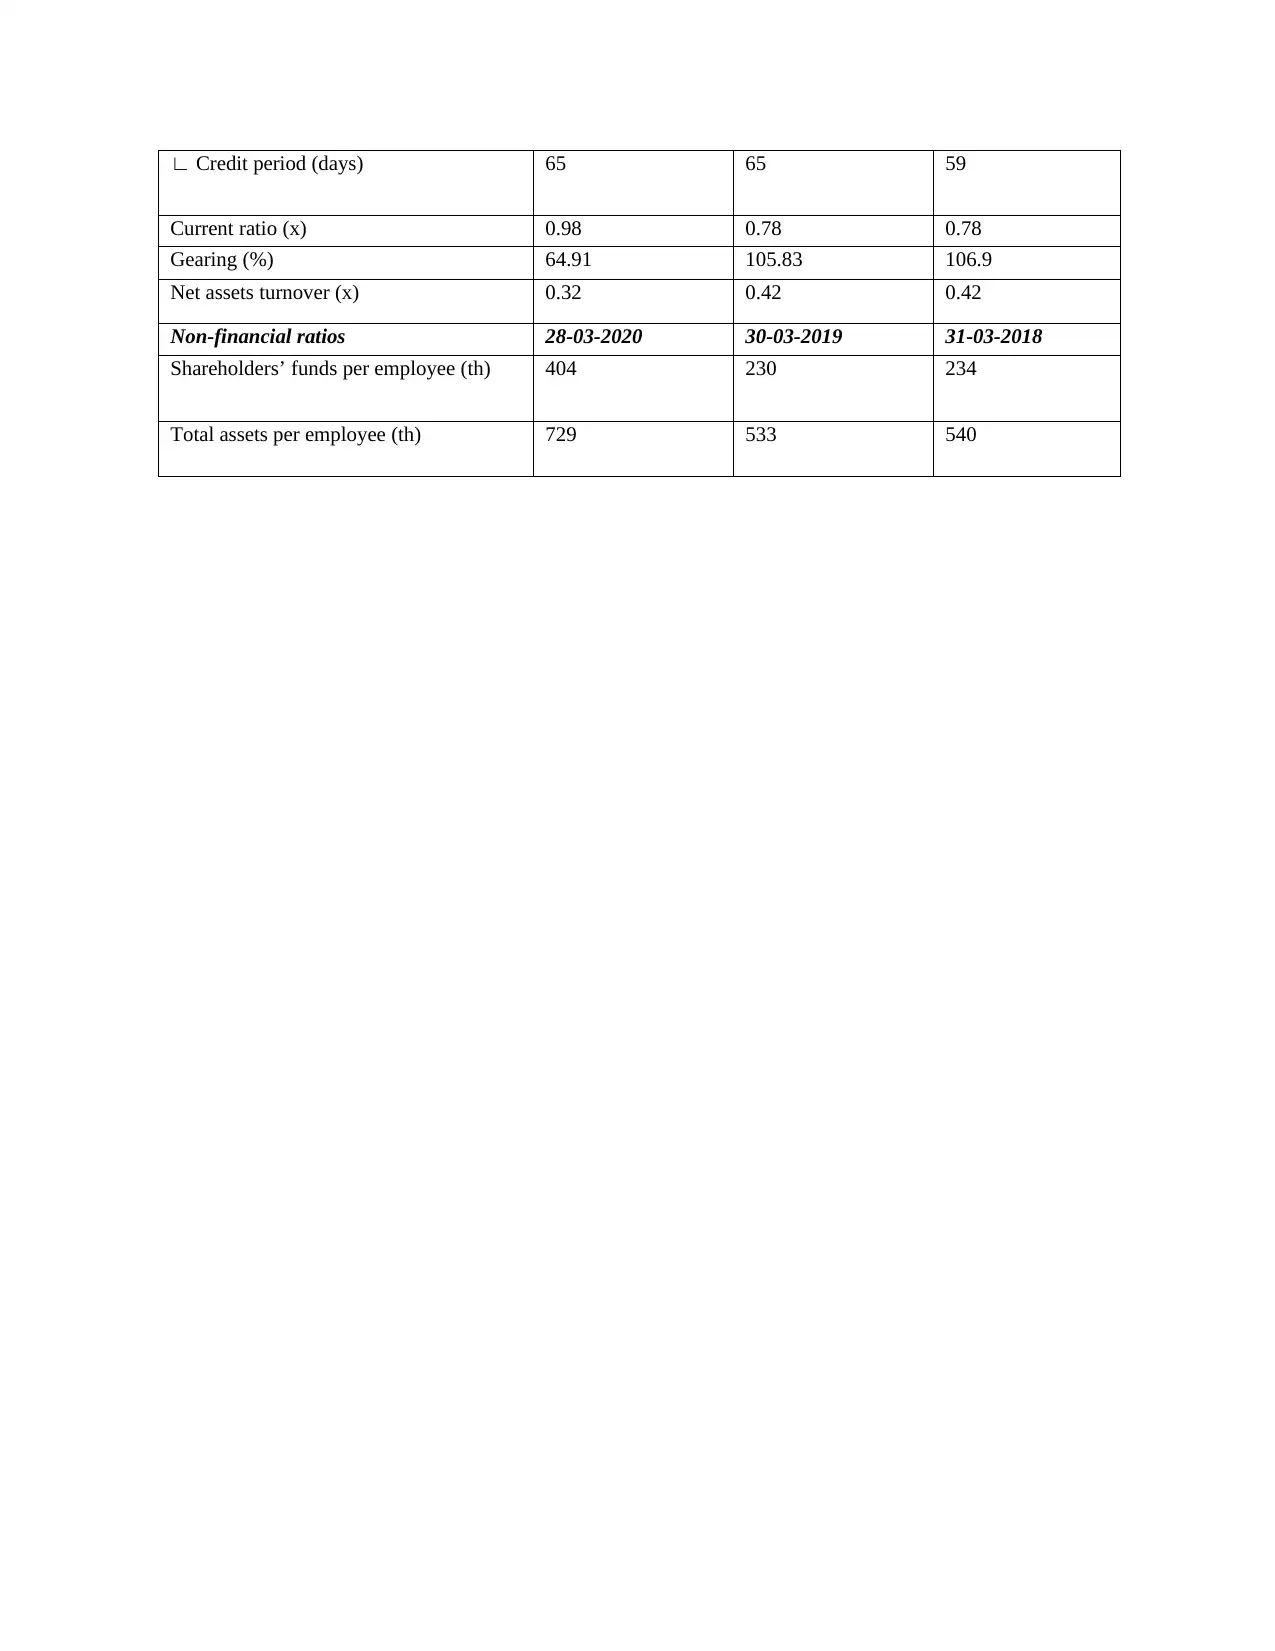
∟ Credit period (days) 65 65 59
Current ratio (x) 0.98 0.78 0.78
Gearing (%) 64.91 105.83 106.9
Net assets turnover (x) 0.32 0.42 0.42
Non-financial ratios 28-03-2020 30-03-2019 31-03-2018
Shareholders’ funds per employee (th) 404 230 234
Total assets per employee (th) 729 533 540
Current ratio (x) 0.98 0.78 0.78
Gearing (%) 64.91 105.83 106.9
Net assets turnover (x) 0.32 0.42 0.42
Non-financial ratios 28-03-2020 30-03-2019 31-03-2018
Shareholders’ funds per employee (th) 404 230 234
Total assets per employee (th) 729 533 540
⊘ This is a preview!⊘
Do you want full access?
Subscribe today to unlock all pages.
Trusted by 1+ million students worldwide
ROE with the help of net income( %)-
Analyses- From above mentioned table, it has been observed that the return on earning in
context of Green core has improved in year 2020 in comparison to 2019. That's leads to a
prominent improvement in productivity of significant company that produces return. Whereas
the success of Hilton hotel was almost similar in both year 2019 and 2020. in which the
suggestion for them is to attain respectable equity yields. On the other hand, it has been seen that
the productivity of premier food corporation is very poor as compare to other two business unit.
ROCE ( %)
Analyses- Accordance to above mentioned figure, it has been found that the profitability
ratio offers by Green Core Group is better than other two firm and that is near to 19.12 % with
one exception that some of Hilton business ratio was decreased about 2.96 % in year 2020.
Efficiency of Premier business is inefficient as compare to other companies from above
proportion and that refers to increment n capital expenditures.
Net profit margin
Analysis- As far the business of Green core company grows, it can be said that their
effectiveness during year 2020 compare to year 2019 has raised with a significant amount. On
the other hand premier food corporation had adverse effects of owing higher prices and their
operating revenue is around -5.18 %. it would not be nice condition over the enhance success of
Hilton Food manufacturer during those 3 years.
Gross margin-
Analysis- In all three years the productivity related to Green Core business and Premier
Fast Food chain is same. Likewise premier food manufacturer has strong off than other two
business in a same manner. On the other hand, relation to two other firm the performance of
Hilton food manufacturer is low and this is because of increment in sales rates and decrements in
earnings.
EBIT -
Interpretation- On annual basis the Hilton Food corporation is able to retain their profits
until the magnitude of constant depreciation and amortization describes their development.
Where as Green core business & premier food corporation gain a steady declination in 2019 and
achieve sustainable production in 2020.
Collection period-
Paraphrase This Document
Need a fresh take? Get an instant paraphrase of this document with our AI Paraphraser
Interpretation- Premier business may be claimed as they are able to recover their
receivables from other two companies within stipulated time frame in context of creditors
payment period. Even though, Hilton Food corporation seeks to reimburse their debtors for a
quite bit longer. Over that, Green core company is able to lower their turnaround time related to
trade debts in a small duration of year 2020 compare to 2019.
Credit period-
Interpretation- From above table it has been found that the payment period of both Hilton
and Green core corporation are similar under the same period which tends to clear legal and
policy. Apart from that, premier food Plc takes more times in order to meet their commitments.
Current ratio-
Analysis- From above illustration it can be said that the current ratio need to be presumed
to be 2 and that is only maintained by the Green core Plc in year 2019 at this extent. On the other
hand the two companies were reluctant to do so because of higher current obligations.
Net assets turnover ratio-
Interpretation- Net assets turnover ratio is generally prepared with the aim of handling
assets with much less timeline & cost and from above stated map it can be said that Hilton Food
corporation manges that effectively. Where as premier nutrition has low proportion that states
that they are not able to regulated their assets effectively.
Shareholders funds per employees-
Analysis- From above illustration, it can be said that there is a big difference among two
companies- premier and Hilton, since Premier Food corporation has strong recruiting funds and
that are approximately multiples of 3 than majority of these two companies.
Total assets per employee-
Interpretation- There is a substantial gap among two companies and Premier food
manufacturer has sufficient staff for operating business activities and in facts have 5 times more
than majority of two companies.
1c
From above mentioned reviews of all companies, it can be said that the Green Core
company got the best rank in context of performance. As they are effectively able to generate ore
incomes along with dividends in optimised manner and that refers to a biggest investment
potentials.
Investment enticement refers to a situation in which consumers has potential to benefits
something that is related to gaining except chances (De Villiers and Maroun, 2017). The aim to
developing wealth by functioning the advantages is related to management of money. Here,
Green Core manufacturer provides an excellent opportunities to their potential consumers as they
will able to produce greater yields in upcoming year.
SECTION B
2a.
From very ongoing existence of finances, the term internal data via finances are produces
by economic systems. These refers to borrowing/ lending or capital initially identified by
business as opposed to financing like loan issued by financial individual as various environment
(Makrani and Matoufi, 2019). Financial information channels are incomes generated,
investments/ assets disposition along with comprehensive managing of cash flow funds. Internal
organisational larger resources are acquirable to business entities are as:
Retained earning- Delayed revenue mentioned on financial statements are known as an
inherent financial resources for companies based on sole so that it will able to become final
income of institution. Retained earning refers to incomes that leftover after the distribution which
have been paid to shareholders or stockholders (Statman, 2018). Interest incomes except
lengthier rentals and obligation are lengthener resources of corporate financing in which no
mandatory maturity occurs. Earning related with the loaned funds are not specified as a fixed
obligation on annual fees or repayment period.
Equity financing- Equity investment refers to selling of sample weight for getting more
money. Shareholders who buy stocks also get right related to the voting. Equity capital may be
related with the selling of fair values, like new stocks, ordinary shares equity options etc. a
business unit which faces the needs of funds in order to expand business seeks to acquire in two
different manners and that are debt and equity (Fu-le, 2018). Equity finance demesne selling of
leftover values and provides a shares to consumers related to business unit in exchanges of cash.
The percentage of business that is offered in equity relies on how much investments has spent in
business in ending of funds and what are the valued expenditure. For instance an expenditure
who spend $ 600, 000 initially to a firm and then eventually own all the reaming stocks.
Debt financing- Debt funding occur when a company increase their funds by selling their
debts securities to peoples or to those firm who are interest in investments for cash flow or
⊘ This is a preview!⊘
Do you want full access?
Subscribe today to unlock all pages.
Trusted by 1+ million students worldwide
capital spending. Person/ entities act as borrowers in exchange of loan money and they assured a
guarantee related with the principles and interest on loan will be returned. There are three
method could be acquired by companies related to security of funds by funding i.e. capital,
borrowing or combination of both. Equity tends a portion of companies share. It provides a
benefit related to profit to potential investors so that it will not become necessary to repaid in
full. If business goes in flop, then equity shares are those who comes in line for earning
compensation. Where as other path is debt financing, in this business increase their money by
issuing the debts.
Term loan- term loan refers to a loan that is taken by individual from back for a specific
amount for a specific repayments schedule, it is either fixed or floating interest rate. For a
existing small corporation with strong or solid financial reports, the rate of loan is also fixed
(Corrales, Fenwick and Haapio, 2019). Additionally, in order to decline the sum of interest as
well as overall cost of mortgage, loan rate could involve high lump sum. In financing business
the revolving loan is normally between one to 25 years for machinery, property development or
for system equipment written off. Sometime a small organisation uses money as a revolving loan
in order to purchase capital assets for operating the operation or function of company like
machinery or new home. Any company which borrow money according to their requirement on
monthly basis will be return by them after completion of month. Most of the bank have build
term-loan programs primarily to supports the company in effective manner.
2b
Retained earning- It is a predominated famous approach in order to lengthier the funds in
all chosen companies. This help in using the leftover income of company even though it has
certain consequences towards rights of present stakeholders of group (Jones and et.al., 2018).
Underneath is a comprehensive discussion in context of how this origin will influence the
interest of all parties with relevance to Green Core Group:
Stockholders or shareholders- Overall equity of investors along with financial trust of
investors would got affects if they are using retained earning as the retained earning leads to a
dispersed among existing managers.
Provider or lenders- allocation of cash flow would effects the image of companies along
with creditors an this is illustrated by shortcomings of company in current realistic situation.
Paraphrase This Document
Need a fresh take? Get an instant paraphrase of this document with our AI Paraphraser
Employees: Use of reaming benefits directly affects the funds of company which are
allotted to employees. Each specific employees declines the wealth and that can affects the
performance of employees in order to get financial success (Scase and Goffee, 2017). This leads
to an increment in size of employees and that turn to unemployment.
CONCLUSION
From above discussed report it has been expressed that components of finance related
with the corporate plays essential roles in order to manage all function or activities of finance.
Companies run their operation with the help of assets along with funds and if company do not
posses any kind of funds then they do not have direct impact thorough market. Mangers of
organisation will guide and monitor related with the flow of resources as well as guide a course
of operation by effectively paying contribution towards profitability & expenditure of company.
REFERENCE
Books & Journal
Corrales, M., Fenwick, M. and Haapio, H. eds., 2019. Legal Tech, Smart Contracts and
Blockchain. Springer.
De Villiers, C. and Maroun, W. eds., 2017. Sustainability accounting and integrated reporting.
Routledge.
Fu-le, W. A. N. G., 2018. Does Managers' Moods Really Matter in Disclosure? Evidence from
IPOs Roadshow. Business Management Journal. (2). p.8.
Holm, L., 2018. Cost Accounting and Financial Management for Construction Project
Managers. Routledge.
Jones, C., and et.al., 2018. Financial Management for Nurse Managers and Executives-E-Book.
Elsevier Health Sciences.
Kim, M., Schmidgall, R. S. and Damitio, J. W., 2017. Key managerial accounting skills for
lodging industry managers: The third phase of a repeated cross-sectional
study. International Journal of Hospitality & Tourism Administration. 18(1). pp.23-40.
Lail, B. E. and Martin, G. W., 2017. Are entrenched managers’ accounting choices more
predictive of future cash flows?. Journal of Business Finance & Accounting. 44(5-6).
pp.593-610.
Makrani, S. V. M. and Matoufi, A., 2019. The impact of accounting estimates on performance-
emphasizing managers’ Myopia. SMART Journal of Business Management Studies. 15(1).
pp.29-38.
Scase, R. and Goffee, R., 2017. Reluctant Managers (Routledge Revivals): Their Work and
Lifestyles. Routledge.
Statman, M., 2018. Behavioral Finance Lessons for Asset Managers. The Journal of Portfolio
Management. 44(7). pp.135-147.
⊘ This is a preview!⊘
Do you want full access?
Subscribe today to unlock all pages.
Trusted by 1+ million students worldwide
1 out of 12
Related Documents


Your All-in-One AI-Powered Toolkit for Academic Success.
+13062052269
info@desklib.com
Available 24*7 on WhatsApp / Email
![[object Object]](/_next/static/media/star-bottom.7253800d.svg)
Unlock your academic potential
Copyright © 2020–2026 A2Z Services. All Rights Reserved. Developed and managed by ZUCOL.