7111AFE Assignment: Analysis of Wesfarmers Annual Report 2018
VerifiedAdded on 2022/10/15
|14
|2178
|10
Report
AI Summary
This report presents a financial analysis of the Wesfarmers Group, focusing on its 2018 annual report. The analysis includes an examination of the company's consolidated statement of financial position, income statement, and key financial ratios such as current, quick, cash, debt, and profitability ratios. The report compares Wesfarmers with its competitor, Woolworths, highlighting differences in financial performance and position. The analysis covers depreciation methods, intangible assets, revenue streams, and profit margins. The report concludes with a decision based on the financial analysis, offering investment recommendations. The analysis also includes ratio analysis, comparing Wesfarmers to Woolworths across various financial metrics. The report provides a detailed overview of the company's financial health and strategic decision-making.

Finance
Paraphrase This Document
Need a fresh take? Get an instant paraphrase of this document with our AI Paraphraser
FINANCE 1
Part A: Motivation
The main competitor of Wesfarmers Group is Woolworths. These two companies operate the
business in the same industry that is supermarket and grocery retains chain. The brand image of
the companies is also similar as these have similar line of business. It has been found that the
organization structures of both the companies is not similar to that of Wesfarmers management
as the management of Wesfarmers divided into two parts such as retail and industrial and the
other business and the management structure of Woolworths is not divided into parts it is in the
form of top and bottom management (Wesfarmers Group, 2018). For the comparison, it is
required that both the companies follows the similar accounting principles for all financial
activities but it is observed that both the companies does not follows the similar principles which
is main limitation that makes the process of comparison difficult. It has been found that both the
companies record the items in financial report as per the different method such as fair value or
cost value. Woolworths recorded the inventory as the cost value or net realizable value and
Wesfarmers record the inventory on the purchase value. The financial statements of both the
companies have been analyzed with the help of financial ratios. One of the limitation is that the
comparison has been done on the financial basis not on the non-financial information due to
which it is difficult to find the differences among them (Zainudin, and Hashim, 2016).
FINANCE 2
Part B: Analysis Report
B1. Wesfarmers Only Consolidated Statement of Financial Position for 2018 only
1. Wesfarmers Group uses the straight line method of deprecation to record the plant and
equipment. The company disclose assumed useful live for depreciation purpose of plant
and equipment is between the time period of 3 and 40 years.
2. The recoverable amount is calculated of individual assets. The recoverable amount of
assets is calculated by subtracting the cost, value in use from the fair value. The
recoverable amount of the company is $1167 million which was recognised in
impairment expenses.
3. In the beginning of the year 2018, the addition amount of Plant and Equipment is $1013.
The net assets disposed are $555 m and total assets disposed are 987 in the year 2018.
The depreciation expense of the year is 913 (Wesfarmers Group, 2018).
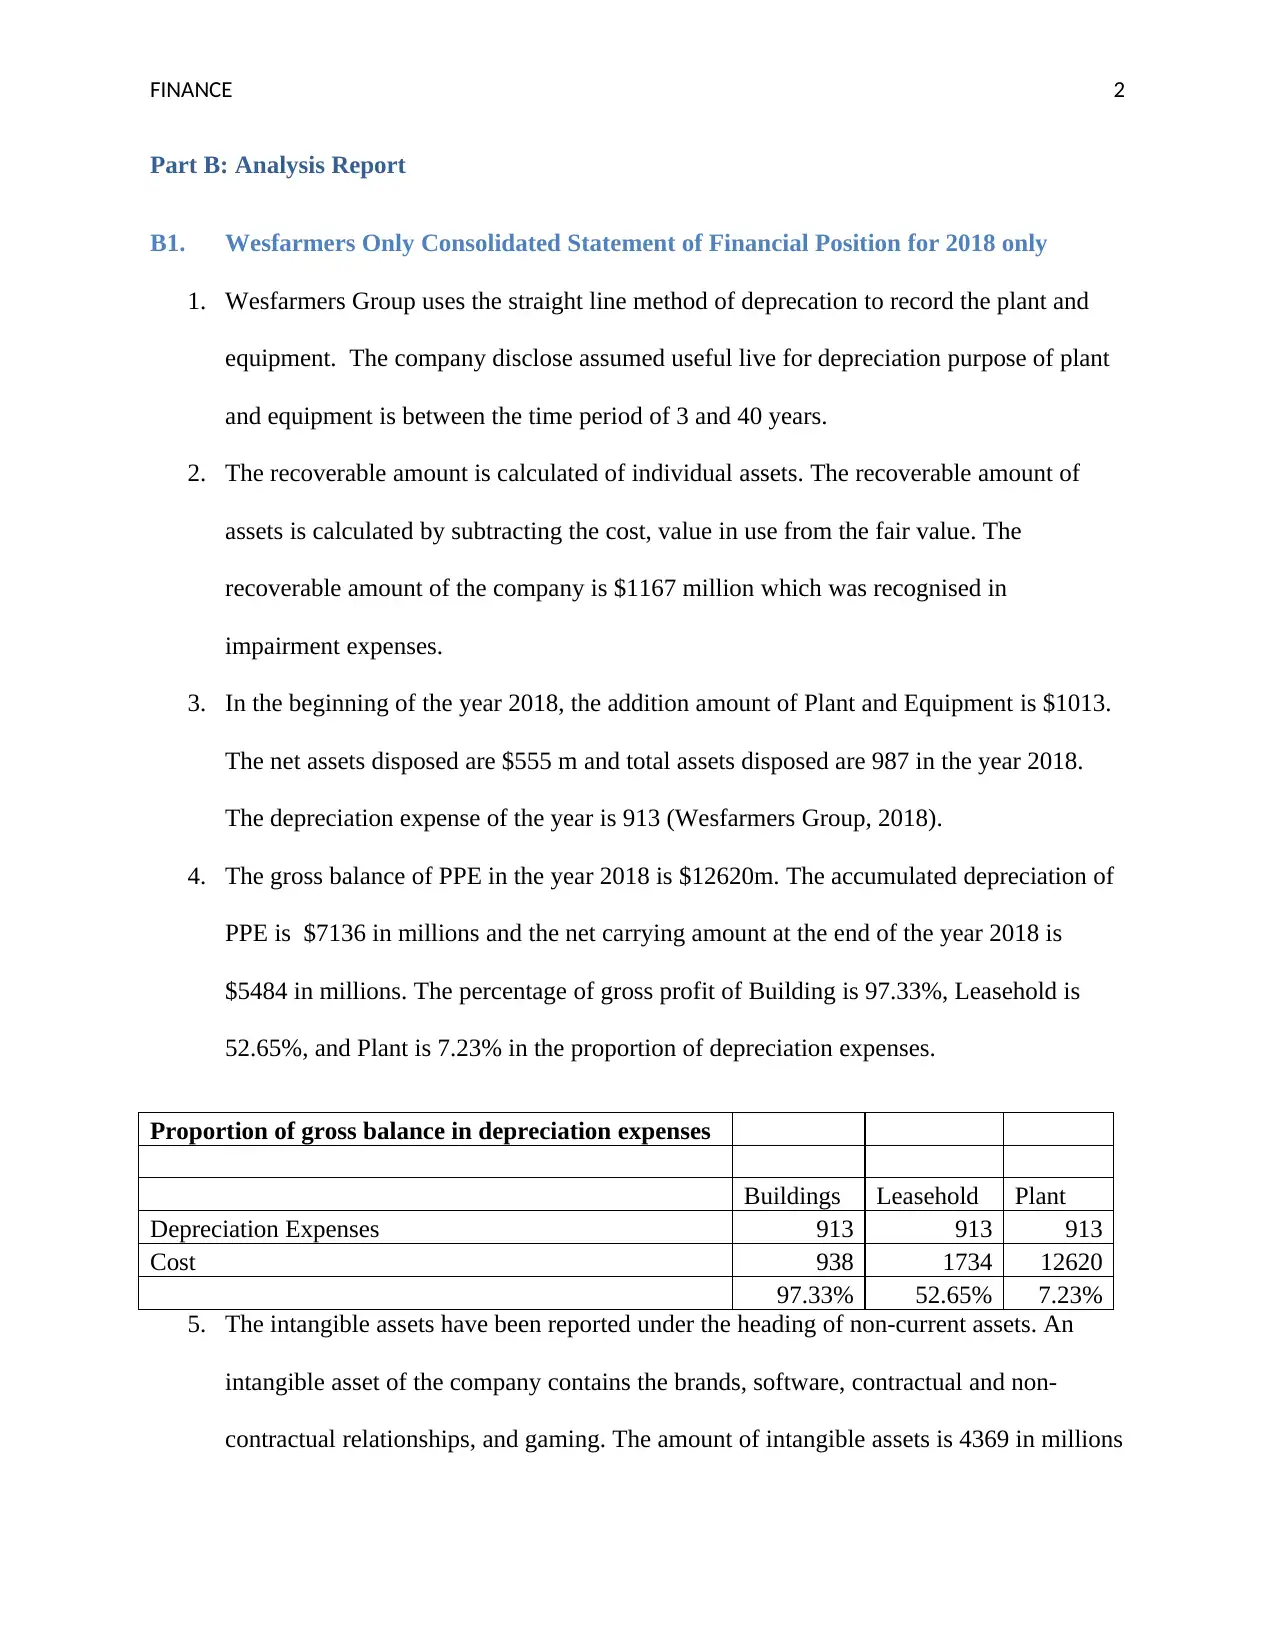
4. The gross balance of PPE in the year 2018 is $12620m. The accumulated depreciation of
PPE is $7136 in millions and the net carrying amount at the end of the year 2018 is
$5484 in millions. The percentage of gross profit of Building is 97.33%, Leasehold is
52.65%, and Plant is 7.23% in the proportion of depreciation expenses.
Proportion of gross balance in depreciation expenses
Buildings Leasehold Plant
Depreciation Expenses 913 913 913
Cost 938 1734 12620
97.33% 52.65% 7.23%
5. The intangible assets have been reported under the heading of non-current assets. An
intangible asset of the company contains the brands, software, contractual and non-
contractual relationships, and gaming. The amount of intangible assets is 4369 in millions
Part B: Analysis Report
B1. Wesfarmers Only Consolidated Statement of Financial Position for 2018 only
1. Wesfarmers Group uses the straight line method of deprecation to record the plant and
equipment. The company disclose assumed useful live for depreciation purpose of plant
and equipment is between the time period of 3 and 40 years.
2. The recoverable amount is calculated of individual assets. The recoverable amount of
assets is calculated by subtracting the cost, value in use from the fair value. The
recoverable amount of the company is $1167 million which was recognised in
impairment expenses.
3. In the beginning of the year 2018, the addition amount of Plant and Equipment is $1013.
The net assets disposed are $555 m and total assets disposed are 987 in the year 2018.
The depreciation expense of the year is 913 (Wesfarmers Group, 2018).
4. The gross balance of PPE in the year 2018 is $12620m. The accumulated depreciation of
PPE is $7136 in millions and the net carrying amount at the end of the year 2018 is
$5484 in millions. The percentage of gross profit of Building is 97.33%, Leasehold is
52.65%, and Plant is 7.23% in the proportion of depreciation expenses.
Proportion of gross balance in depreciation expenses
Buildings Leasehold Plant
Depreciation Expenses 913 913 913
Cost 938 1734 12620
97.33% 52.65% 7.23%
5. The intangible assets have been reported under the heading of non-current assets. An
intangible asset of the company contains the brands, software, contractual and non-
contractual relationships, and gaming. The amount of intangible assets is 4369 in millions
⊘ This is a preview!⊘
Do you want full access?
Subscribe today to unlock all pages.
Trusted by 1+ million students worldwide
FINANCE 3
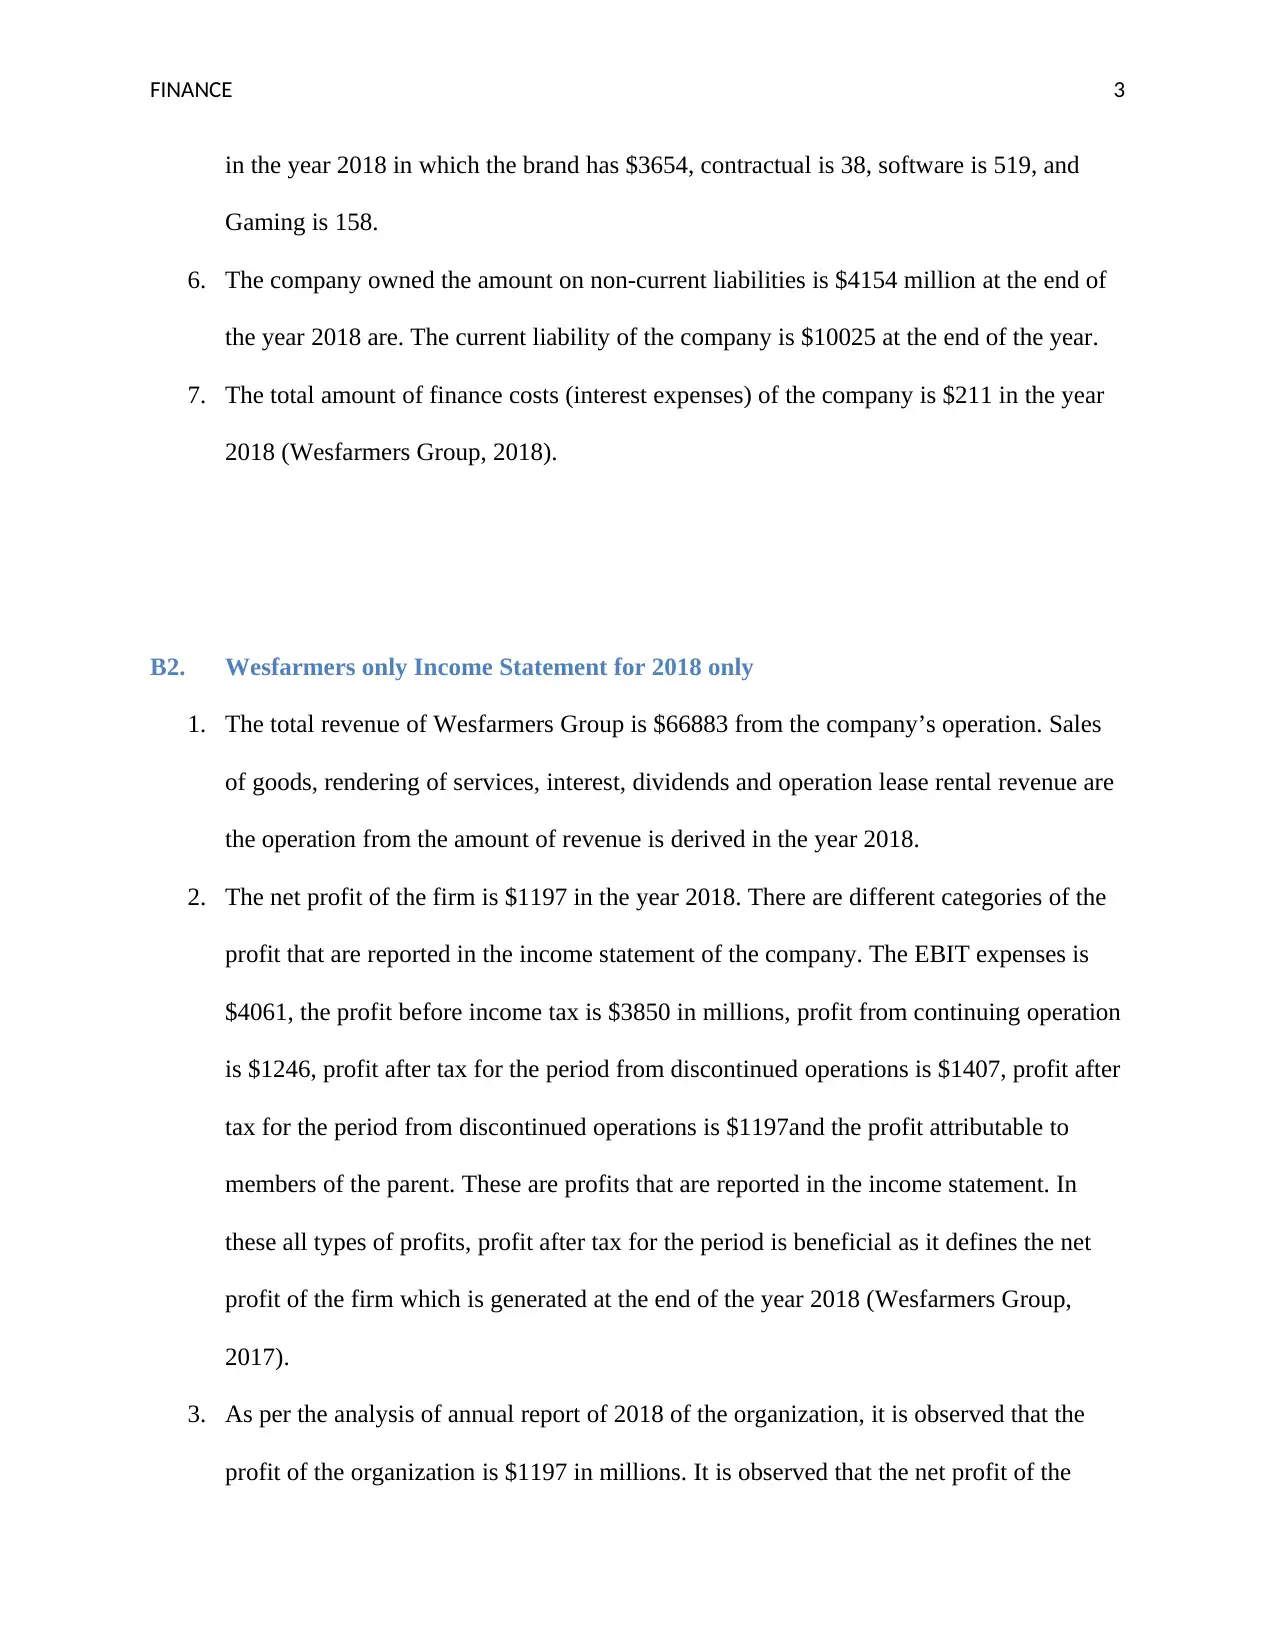
in the year 2018 in which the brand has $3654, contractual is 38, software is 519, and
Gaming is 158.
6. The company owned the amount on non-current liabilities is $4154 million at the end of
the year 2018 are. The current liability of the company is $10025 at the end of the year.
7. The total amount of finance costs (interest expenses) of the company is $211 in the year
2018 (Wesfarmers Group, 2018).
B2. Wesfarmers only Income Statement for 2018 only
1. The total revenue of Wesfarmers Group is $66883 from the company’s operation. Sales
of goods, rendering of services, interest, dividends and operation lease rental revenue are
the operation from the amount of revenue is derived in the year 2018.
2. The net profit of the firm is $1197 in the year 2018. There are different categories of the
profit that are reported in the income statement of the company. The EBIT expenses is
$4061, the profit before income tax is $3850 in millions, profit from continuing operation
is $1246, profit after tax for the period from discontinued operations is $1407, profit after
tax for the period from discontinued operations is $1197and the profit attributable to
members of the parent. These are profits that are reported in the income statement. In
these all types of profits, profit after tax for the period is beneficial as it defines the net
profit of the firm which is generated at the end of the year 2018 (Wesfarmers Group,
2017).
3. As per the analysis of annual report of 2018 of the organization, it is observed that the
profit of the organization is $1197 in millions. It is observed that the net profit of the
Paraphrase This Document
Need a fresh take? Get an instant paraphrase of this document with our AI Paraphraser
FINANCE 4
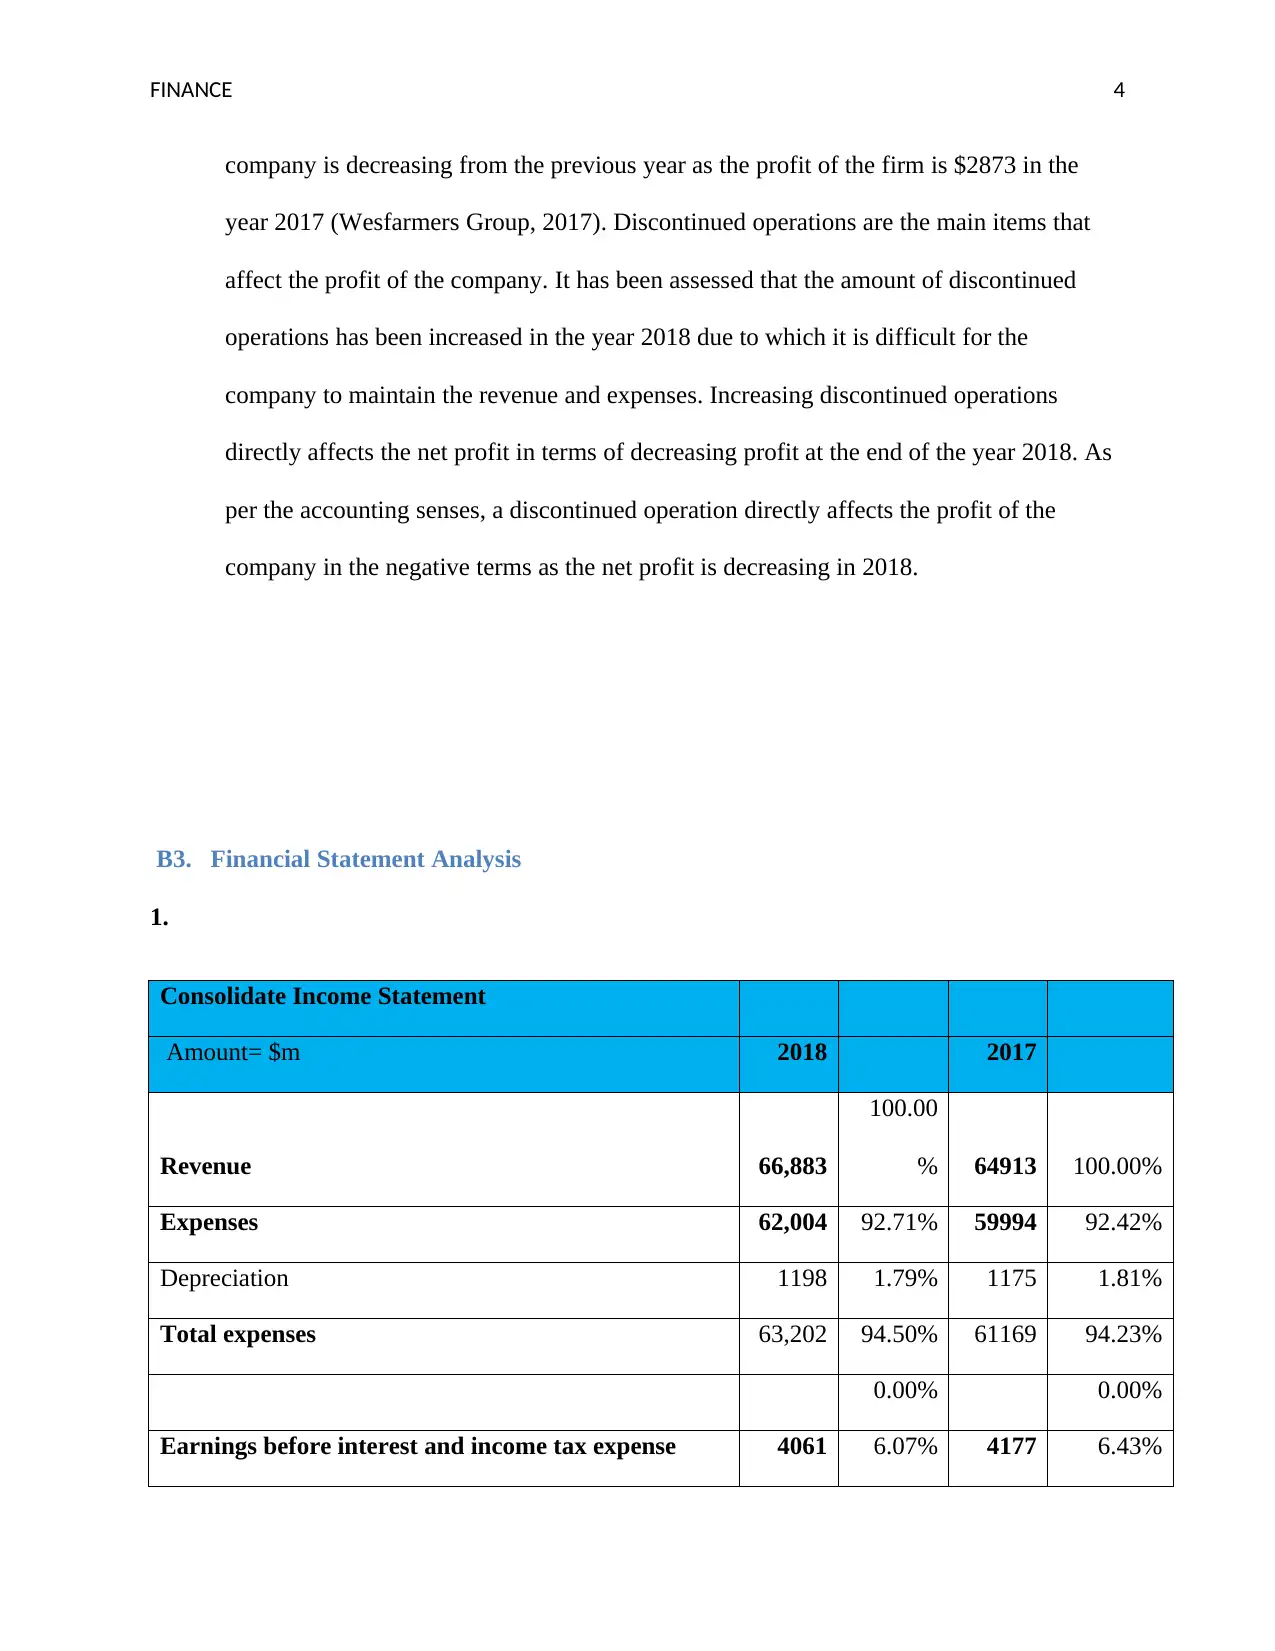
company is decreasing from the previous year as the profit of the firm is $2873 in the
year 2017 (Wesfarmers Group, 2017). Discontinued operations are the main items that
affect the profit of the company. It has been assessed that the amount of discontinued
operations has been increased in the year 2018 due to which it is difficult for the
company to maintain the revenue and expenses. Increasing discontinued operations
directly affects the net profit in terms of decreasing profit at the end of the year 2018. As
per the accounting senses, a discontinued operation directly affects the profit of the
company in the negative terms as the net profit is decreasing in 2018.
B3. Financial Statement Analysis
1.
Consolidate Income Statement
Amount= $m 2018 2017
Revenue 66,883
100.00
% 64913 100.00%
Expenses 62,004 92.71% 59994 92.42%
Depreciation 1198 1.79% 1175 1.81%
Total expenses 63,202 94.50% 61169 94.23%
0.00% 0.00%
Earnings before interest and income tax expense 4061 6.07% 4177 6.43%
FINANCE 5
(EBIT)
Finance costs 211 0.32% 248 0.38%
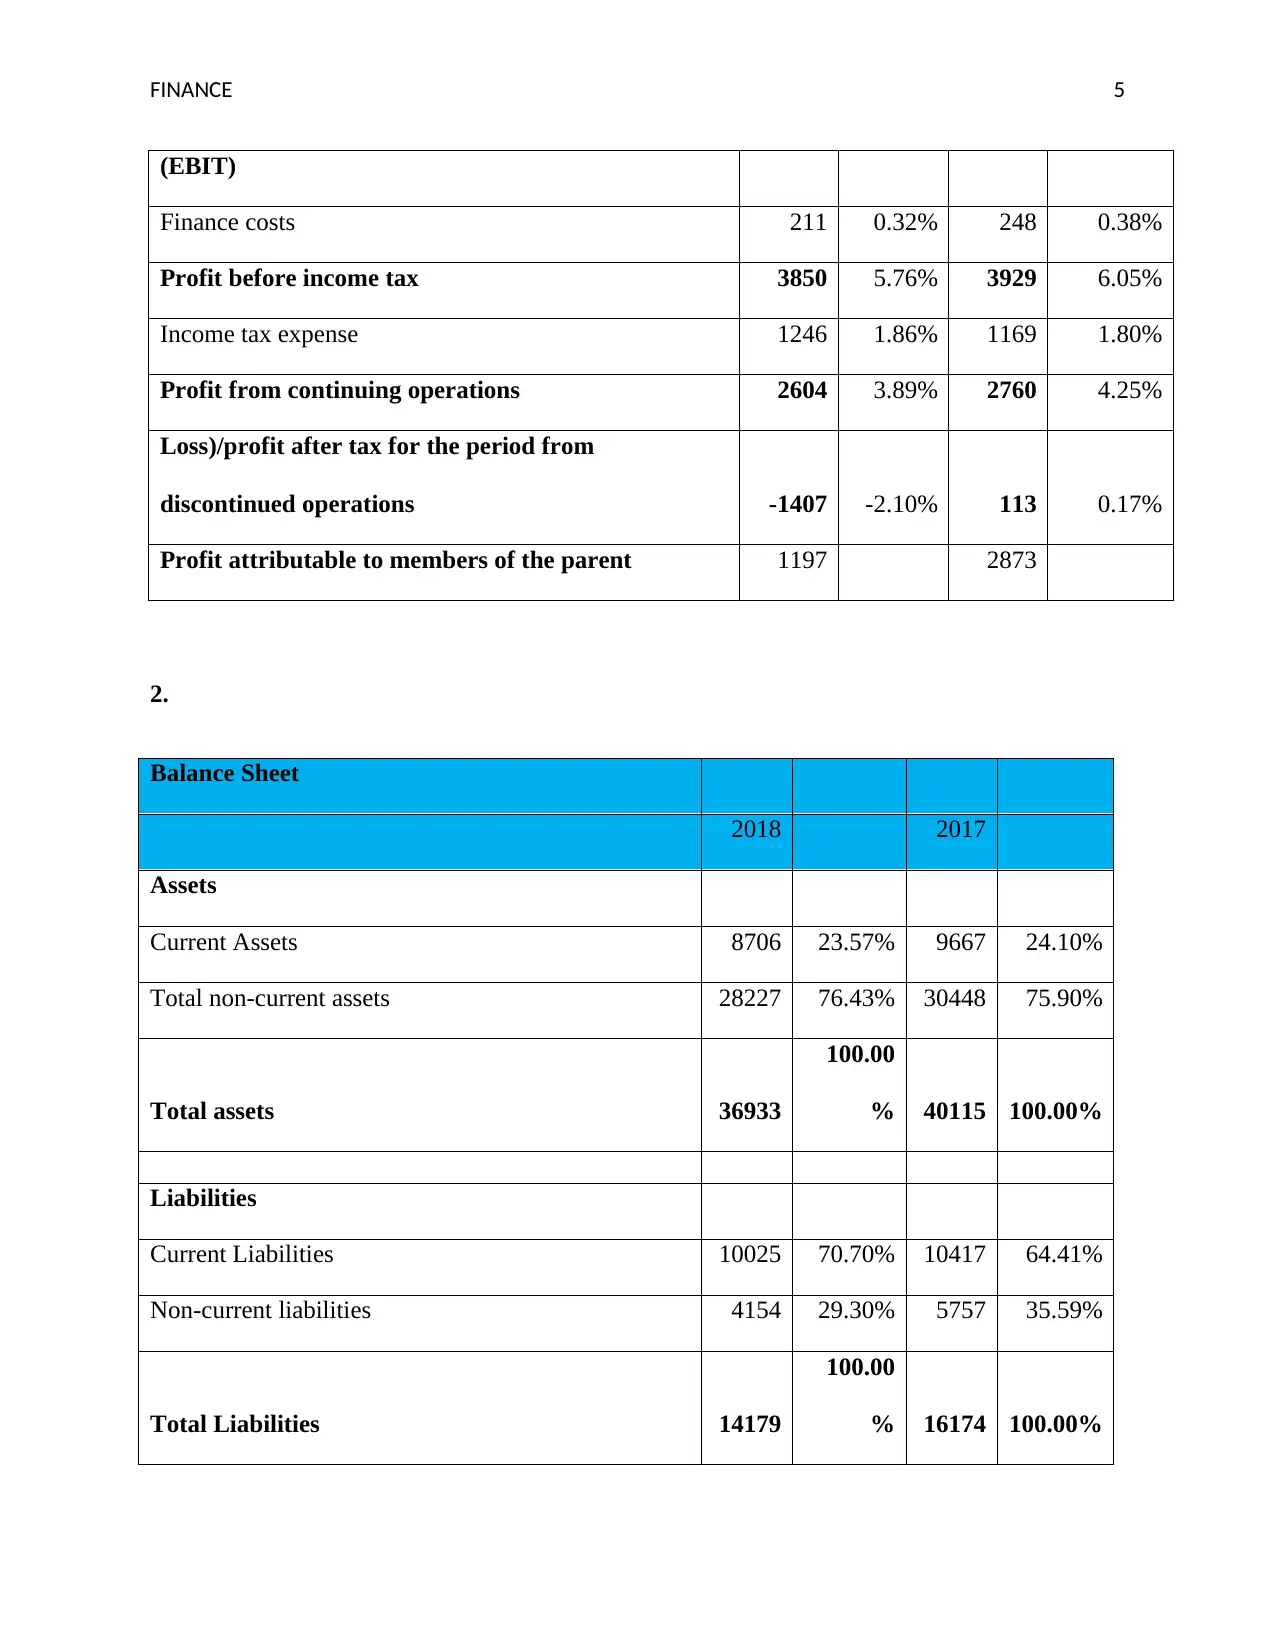
Profit before income tax 3850 5.76% 3929 6.05%
Income tax expense 1246 1.86% 1169 1.80%
Profit from continuing operations 2604 3.89% 2760 4.25%
Loss)/profit after tax for the period from
discontinued operations -1407 -2.10% 113 0.17%
Profit attributable to members of the parent 1197 2873
2.
Balance Sheet
2018 2017
Assets
Current Assets 8706 23.57% 9667 24.10%
Total non-current assets 28227 76.43% 30448 75.90%
Total assets 36933
100.00
% 40115 100.00%
Liabilities
Current Liabilities 10025 70.70% 10417 64.41%
Non-current liabilities 4154 29.30% 5757 35.59%
Total Liabilities 14179
100.00
% 16174 100.00%
(EBIT)
Finance costs 211 0.32% 248 0.38%
Profit before income tax 3850 5.76% 3929 6.05%
Income tax expense 1246 1.86% 1169 1.80%
Profit from continuing operations 2604 3.89% 2760 4.25%
Loss)/profit after tax for the period from
discontinued operations -1407 -2.10% 113 0.17%
Profit attributable to members of the parent 1197 2873
2.
Balance Sheet
2018 2017
Assets
Current Assets 8706 23.57% 9667 24.10%
Total non-current assets 28227 76.43% 30448 75.90%
Total assets 36933
100.00
% 40115 100.00%
Liabilities
Current Liabilities 10025 70.70% 10417 64.41%
Non-current liabilities 4154 29.30% 5757 35.59%
Total Liabilities 14179
100.00
% 16174 100.00%
⊘ This is a preview!⊘
Do you want full access?
Subscribe today to unlock all pages.
Trusted by 1+ million students worldwide
FINANCE 6
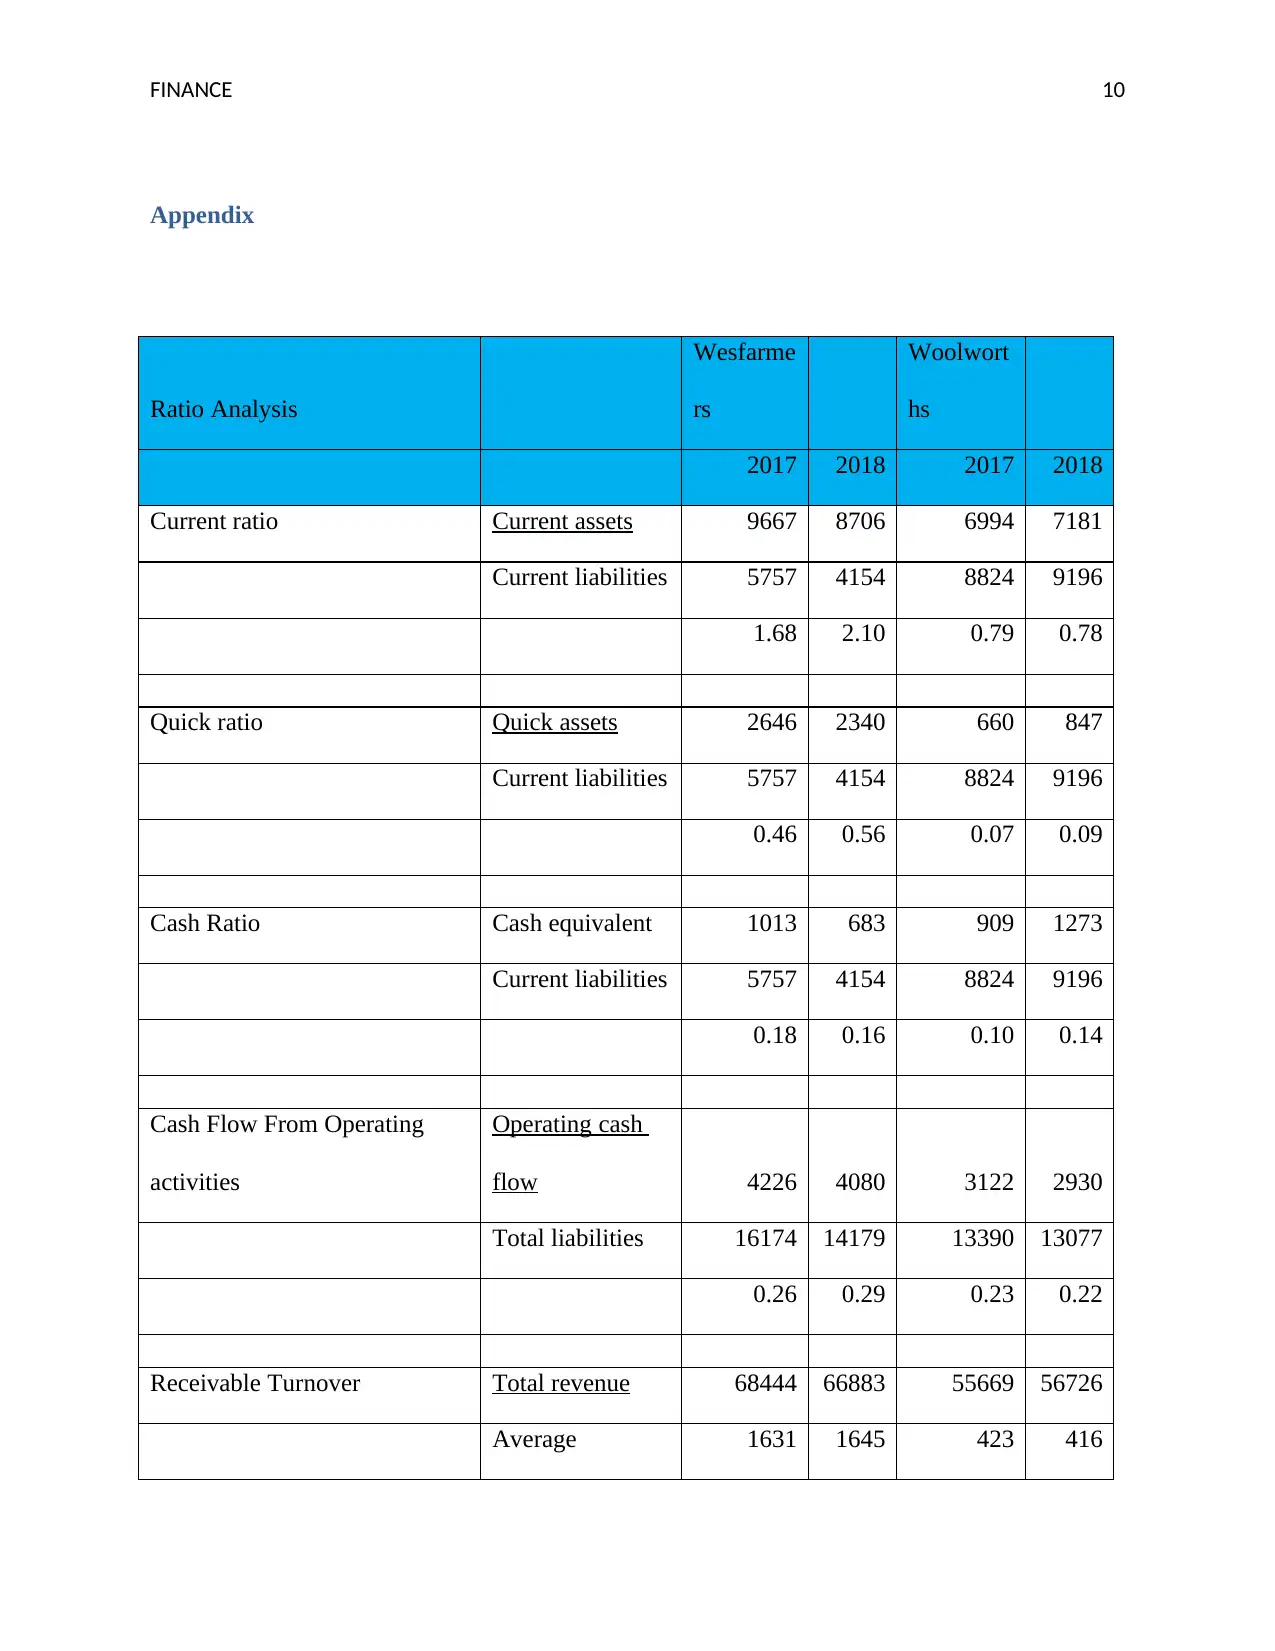
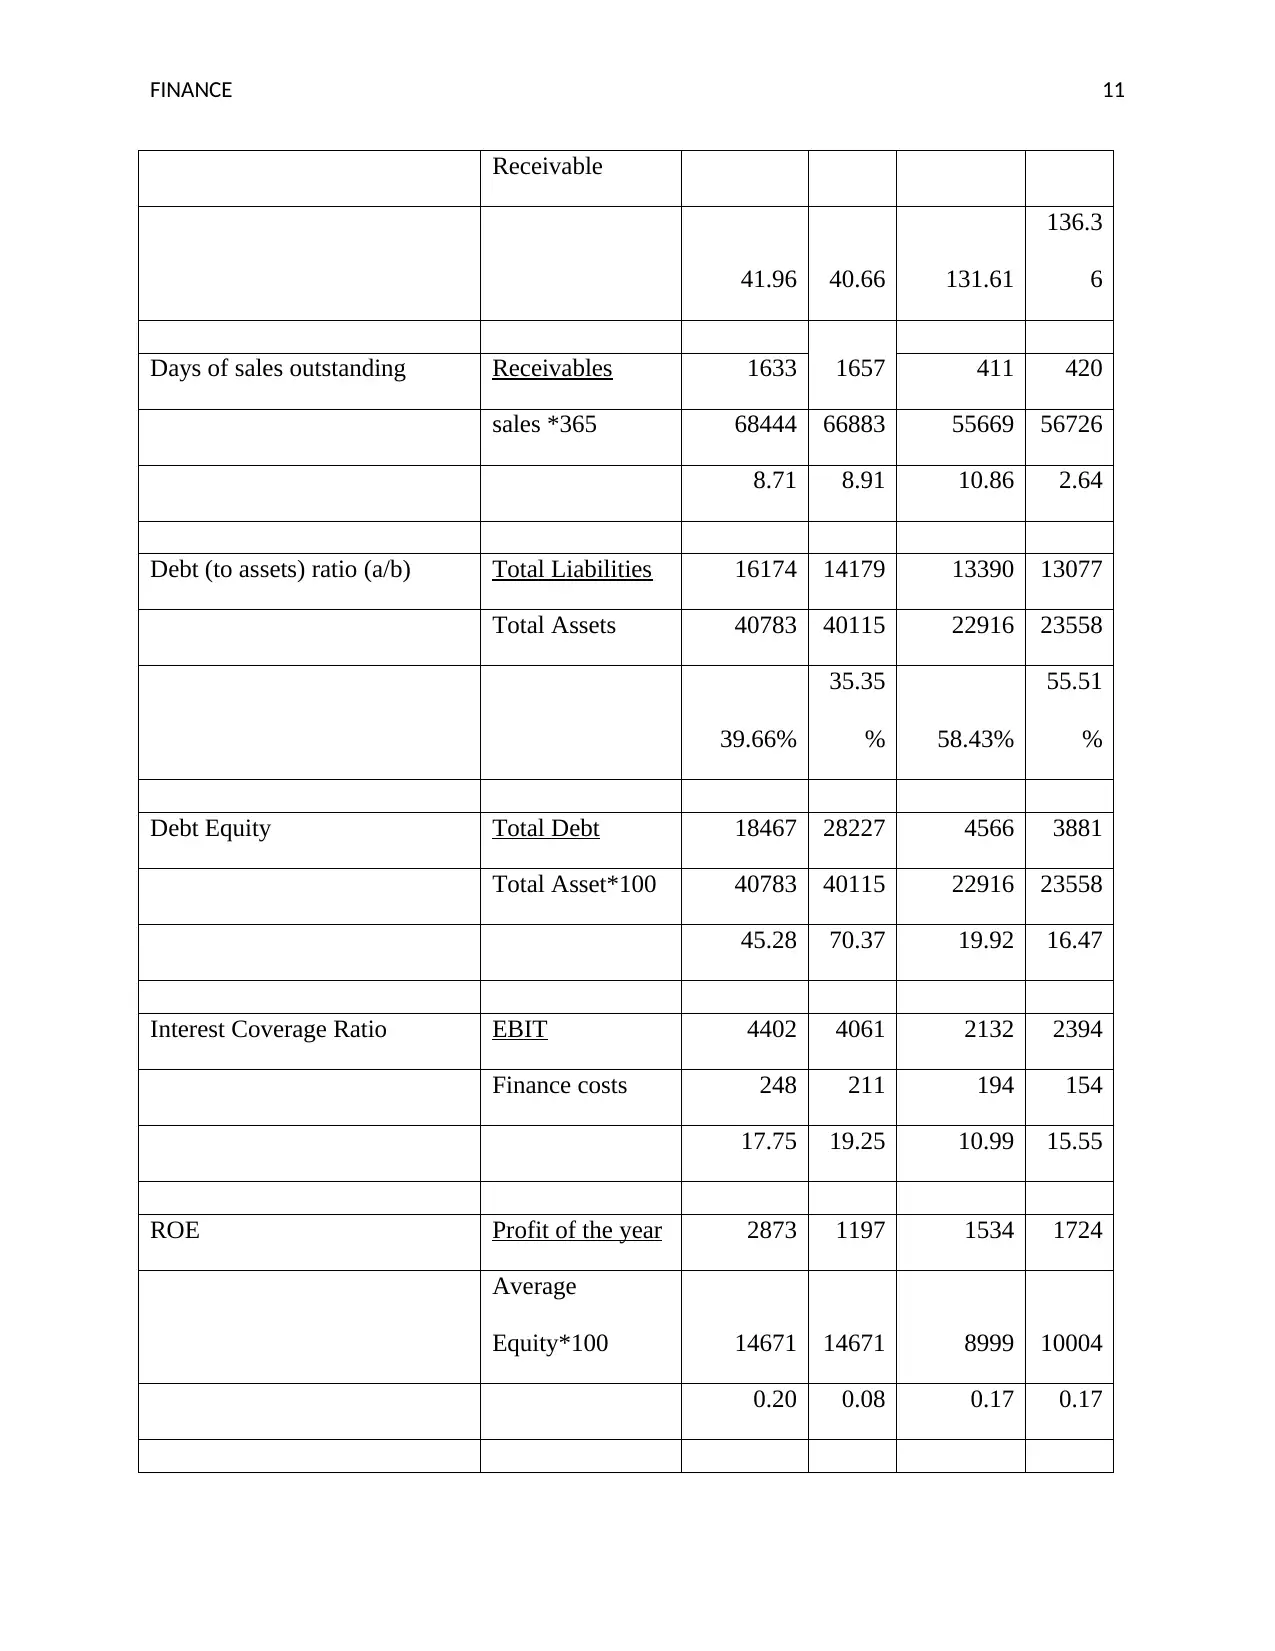
3. Appendix
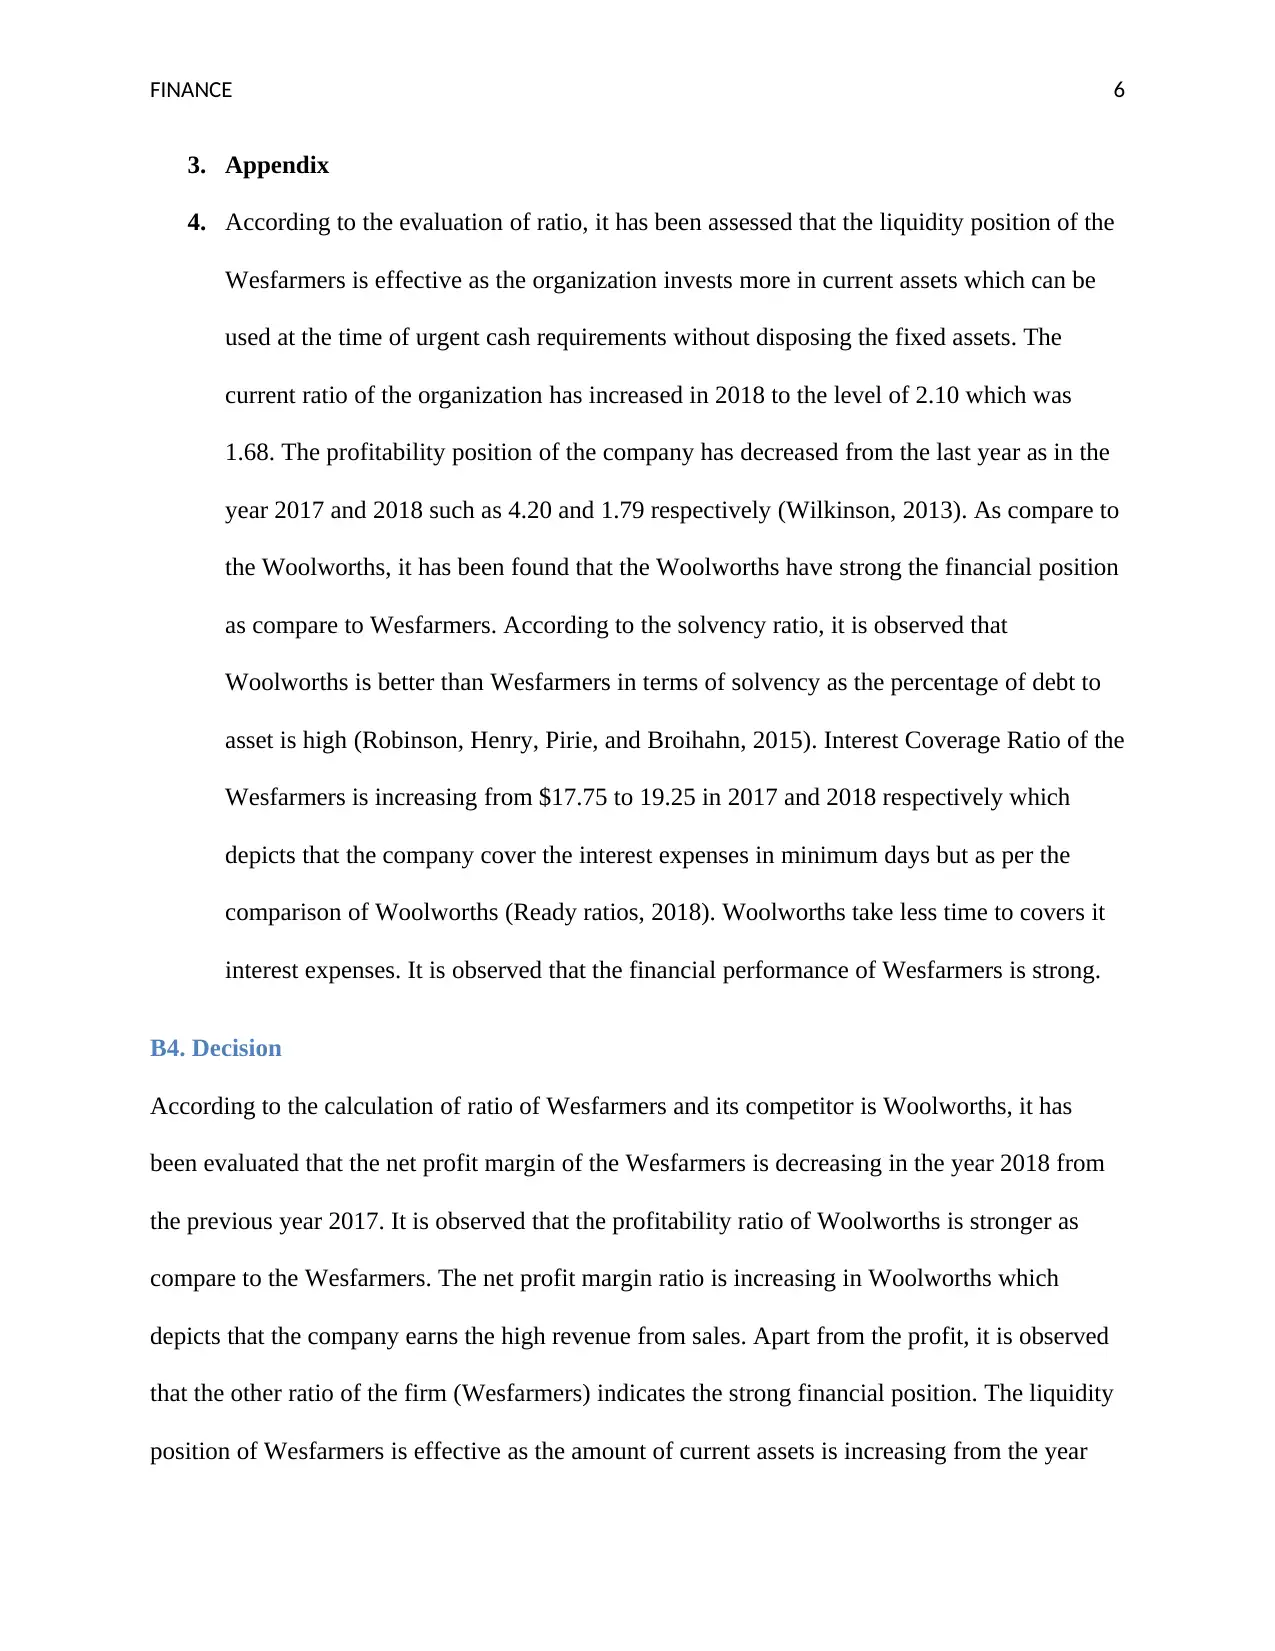
4. According to the evaluation of ratio, it has been assessed that the liquidity position of the
Wesfarmers is effective as the organization invests more in current assets which can be
used at the time of urgent cash requirements without disposing the fixed assets. The
current ratio of the organization has increased in 2018 to the level of 2.10 which was
1.68. The profitability position of the company has decreased from the last year as in the
year 2017 and 2018 such as 4.20 and 1.79 respectively (Wilkinson, 2013). As compare to
the Woolworths, it has been found that the Woolworths have strong the financial position
as compare to Wesfarmers. According to the solvency ratio, it is observed that
Woolworths is better than Wesfarmers in terms of solvency as the percentage of debt to
asset is high (Robinson, Henry, Pirie, and Broihahn, 2015). Interest Coverage Ratio of the
Wesfarmers is increasing from $17.75 to 19.25 in 2017 and 2018 respectively which
depicts that the company cover the interest expenses in minimum days but as per the
comparison of Woolworths (Ready ratios, 2018). Woolworths take less time to covers it
interest expenses. It is observed that the financial performance of Wesfarmers is strong.
B4. Decision
According to the calculation of ratio of Wesfarmers and its competitor is Woolworths, it has
been evaluated that the net profit margin of the Wesfarmers is decreasing in the year 2018 from
the previous year 2017. It is observed that the profitability ratio of Woolworths is stronger as
compare to the Wesfarmers. The net profit margin ratio is increasing in Woolworths which
depicts that the company earns the high revenue from sales. Apart from the profit, it is observed
that the other ratio of the firm (Wesfarmers) indicates the strong financial position. The liquidity
position of Wesfarmers is effective as the amount of current assets is increasing from the year
3. Appendix
4. According to the evaluation of ratio, it has been assessed that the liquidity position of the
Wesfarmers is effective as the organization invests more in current assets which can be
used at the time of urgent cash requirements without disposing the fixed assets. The
current ratio of the organization has increased in 2018 to the level of 2.10 which was
1.68. The profitability position of the company has decreased from the last year as in the
year 2017 and 2018 such as 4.20 and 1.79 respectively (Wilkinson, 2013). As compare to
the Woolworths, it has been found that the Woolworths have strong the financial position
as compare to Wesfarmers. According to the solvency ratio, it is observed that
Woolworths is better than Wesfarmers in terms of solvency as the percentage of debt to
asset is high (Robinson, Henry, Pirie, and Broihahn, 2015). Interest Coverage Ratio of the
Wesfarmers is increasing from $17.75 to 19.25 in 2017 and 2018 respectively which
depicts that the company cover the interest expenses in minimum days but as per the
comparison of Woolworths (Ready ratios, 2018). Woolworths take less time to covers it
interest expenses. It is observed that the financial performance of Wesfarmers is strong.
B4. Decision
According to the calculation of ratio of Wesfarmers and its competitor is Woolworths, it has
been evaluated that the net profit margin of the Wesfarmers is decreasing in the year 2018 from
the previous year 2017. It is observed that the profitability ratio of Woolworths is stronger as
compare to the Wesfarmers. The net profit margin ratio is increasing in Woolworths which
depicts that the company earns the high revenue from sales. Apart from the profit, it is observed
that the other ratio of the firm (Wesfarmers) indicates the strong financial position. The liquidity
position of Wesfarmers is effective as the amount of current assets is increasing from the year
Paraphrase This Document
Need a fresh take? Get an instant paraphrase of this document with our AI Paraphraser
FINANCE 7
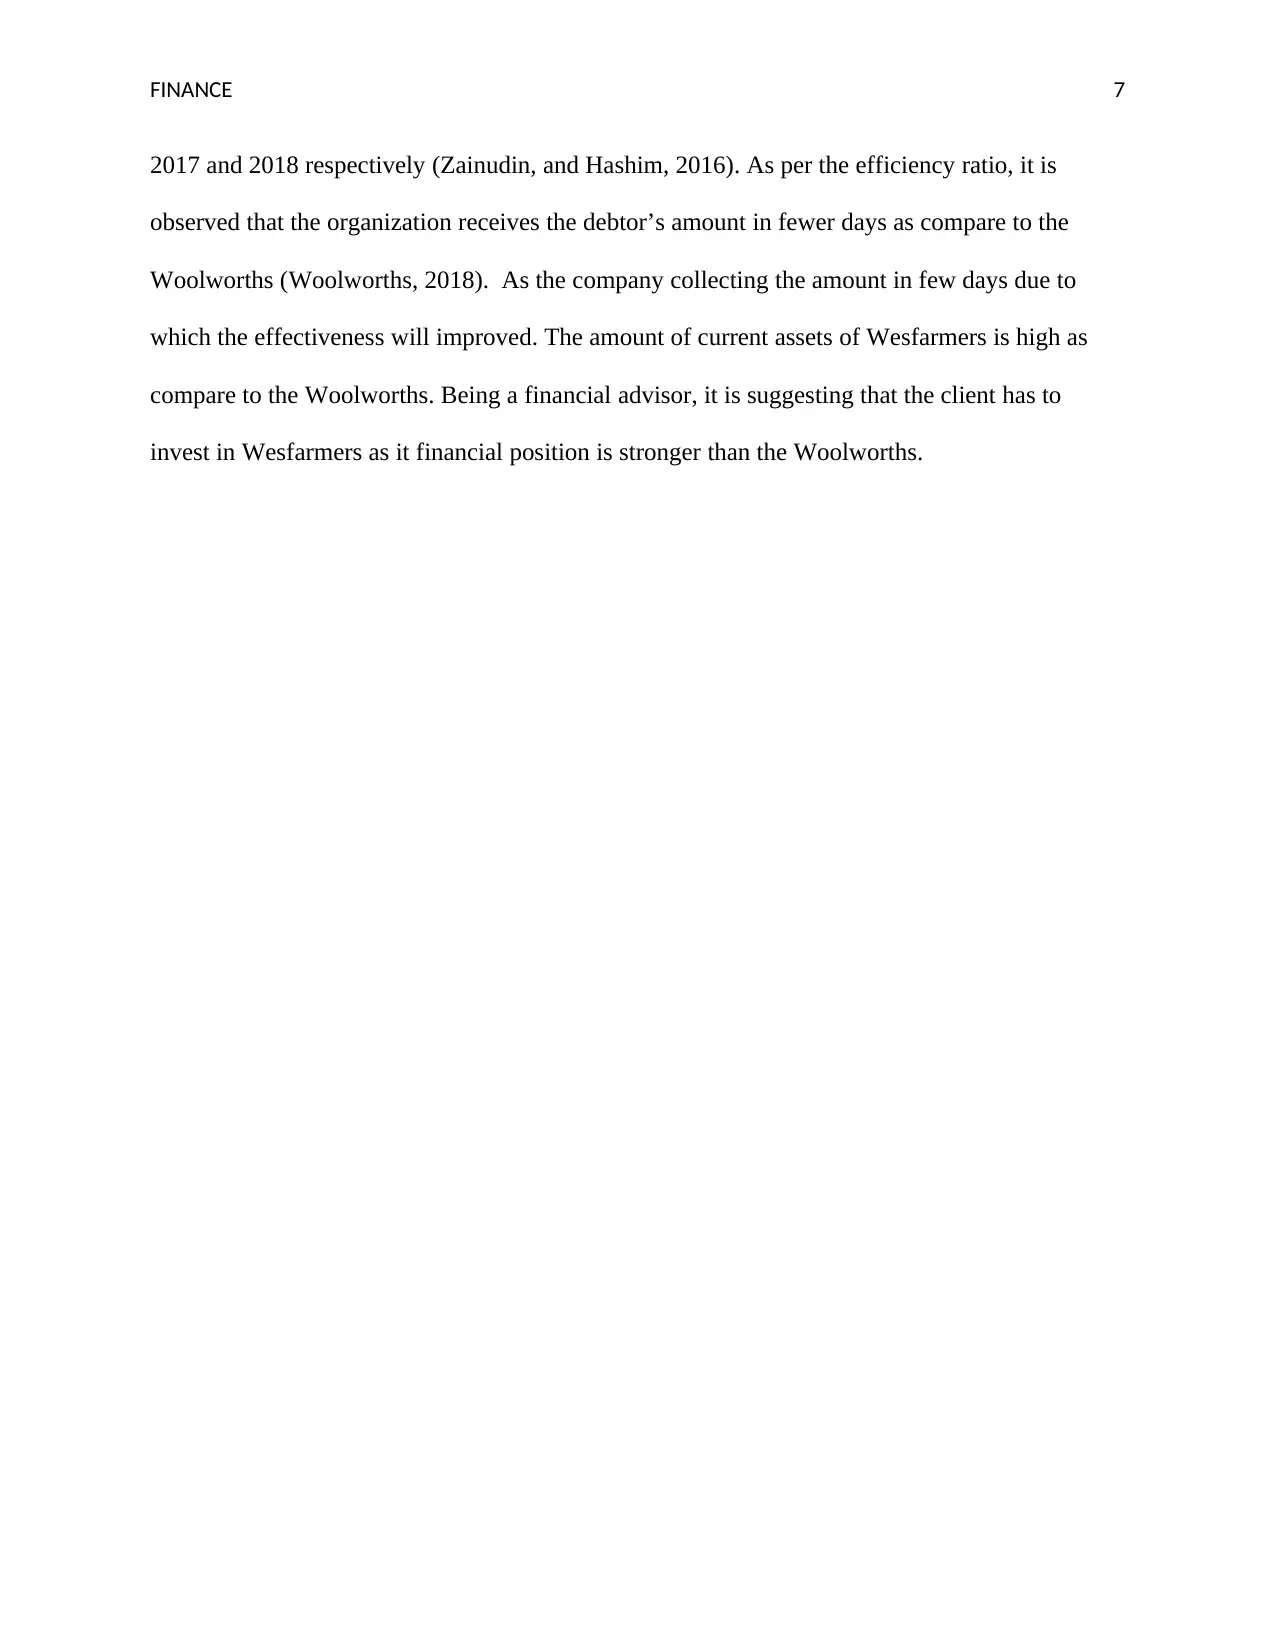
2017 and 2018 respectively (Zainudin, and Hashim, 2016). As per the efficiency ratio, it is
observed that the organization receives the debtor’s amount in fewer days as compare to the
Woolworths (Woolworths, 2018). As the company collecting the amount in few days due to
which the effectiveness will improved. The amount of current assets of Wesfarmers is high as
compare to the Woolworths. Being a financial advisor, it is suggesting that the client has to
invest in Wesfarmers as it financial position is stronger than the Woolworths.
FINANCE 8
References
Gitman, L. J., Juchau, R., and Flanagan, J. (2015). Principles of managerial finance. Pearson
Higher Education AU.
Ready ratios. (2018) Interest Coverage Ratio (ICR). [online] Available From:
https://www.readyratios.com/reference/debt/interest_coverage_ratio_icr.html [Accessed
24/09/19].
Robinson, T.R., Henry, E., Pirie, W.L. and Broihahn, M.A. (2015) International financial
statement analysis. John Wiley & Sons.
Schroeder, R.G., Clark, M.W. and Cathey, J.M. (2019) Financial accounting theory and
analysis: text and cases. John Wiley & Sons.
Wesfarmers Group. (2017) Annual Report 2017. [online] Available From:
https://www.wesfarmers.com.au/docs/default-source/default-document-library/2017-annual-
report.pdf?sfvrsn=0 [Accessed 24/09/19].
Wesfarmers Group. (2018) Annual Report 2018. [online] Available From:
https://www.wesfarmers.com.au/docs/default-source/asx-announcements/2018-annual-
report.pdf?sfvrsn=0 [Accessed 24/09/19].
Wilkinson, J. (2013) Operating Profit Margin Ratio. [online] Available From:
https://strategiccfo.com/operating-profit-margin-ratio/ [Accessed 24/09/19].
Williams, E. E., and Dobelman, J. A. (2017) Financial statement analysis. World Scientific
Book Chapters, 109-169.
⊘ This is a preview!⊘
Do you want full access?
Subscribe today to unlock all pages.
Trusted by 1+ million students worldwide
FINANCE 9
Woolworths. (2018) Annual Report 2018. [online] Available From:
https://www.woolworthsgroup.com.au/icms_docs/195396_annual-report-2018.pdf [Accessed
24/09/19].
Zainudin, E. F., and Hashim, H. A. (2016) Detecting fraudulent financial reporting using
financial ratio. Journal of Financial Reporting and Accounting, 14(2), 266-278.
1.
Paraphrase This Document
Need a fresh take? Get an instant paraphrase of this document with our AI Paraphraser
FINANCE 10
Appendix
Ratio Analysis
Wesfarme
rs
Woolwort
hs
2017 2018 2017 2018
Current ratio Current assets 9667 8706 6994 7181
Current liabilities 5757 4154 8824 9196
1.68 2.10 0.79 0.78
Quick ratio Quick assets 2646 2340 660 847
Current liabilities 5757 4154 8824 9196
0.46 0.56 0.07 0.09
Cash Ratio Cash equivalent 1013 683 909 1273
Current liabilities 5757 4154 8824 9196
0.18 0.16 0.10 0.14
Cash Flow From Operating
activities
Operating cash
flow 4226 4080 3122 2930
Total liabilities 16174 14179 13390 13077
0.26 0.29 0.23 0.22
Receivable Turnover Total revenue 68444 66883 55669 56726
Average 1631 1645 423 416
FINANCE 11
Receivable
41.96 40.66 131.61
136.3
6
Days of sales outstanding Receivables 1633 1657 411 420
sales *365 68444 66883 55669 56726
8.71 8.91 10.86 2.64
Debt (to assets) ratio (a/b) Total Liabilities 16174 14179 13390 13077
Total Assets 40783 40115 22916 23558
39.66%
35.35
% 58.43%
55.51
%
Debt Equity Total Debt 18467 28227 4566 3881
Total Asset*100 40783 40115 22916 23558
45.28 70.37 19.92 16.47
Interest Coverage Ratio EBIT 4402 4061 2132 2394
Finance costs 248 211 194 154
17.75 19.25 10.99 15.55
ROE Profit of the year 2873 1197 1534 1724
Average
Equity*100 14671 14671 8999 10004
0.20 0.08 0.17 0.17
⊘ This is a preview!⊘
Do you want full access?
Subscribe today to unlock all pages.
Trusted by 1+ million students worldwide
1 out of 14
Related Documents


Your All-in-One AI-Powered Toolkit for Academic Success.
+13062052269
info@desklib.com
Available 24*7 on WhatsApp / Email
![[object Object]](/_next/static/media/star-bottom.7253800d.svg)
Unlock your academic potential
Copyright © 2020–2026 A2Z Services. All Rights Reserved. Developed and managed by ZUCOL.