Weighted Average Cost of Capital (WACC) and Financial Analysis of GSK
VerifiedAdded on 2020/03/23
|25
|5958
|46
Report
AI Summary
This report provides a comprehensive financial analysis of GlaxoSmithKline (GSK), focusing on the calculation and interpretation of its Weighted Average Cost of Capital (WACC). The analysis utilizes financial statements, including balance sheets, income statements, and cash flow statements, from 2012 to 2016 to determine the WACC using different methodologies. The report examines the impact of borrowed funds, equity funds, and dividend payments on the cost of capital, comparing results based on current year figures, five-year averages, and cash outflow data. The report also includes a financial analysis of GSK's performance, including profitability, liquidity, and solvency ratios, and discusses the implications of the findings for the company's financial health and future performance. The report highlights the importance of assumptions and their impact on the WACC calculation and concludes with a best judgment for the company's WACC based on the provided financial data.
Running Head: FINANCE
Finance
Name of the Student:
Name of the University:
Authors Note
Finance
Name of the Student:
Name of the University:
Authors Note
Paraphrase This Document
Need a fresh take? Get an instant paraphrase of this document with our AI Paraphraser
1FINANCE
Table of Contents
Stage 1:............................................................................................................................................2
Stage 2:............................................................................................................................................9
Stage 3:..........................................................................................................................................17
References:....................................................................................................................................22
2FINANCE
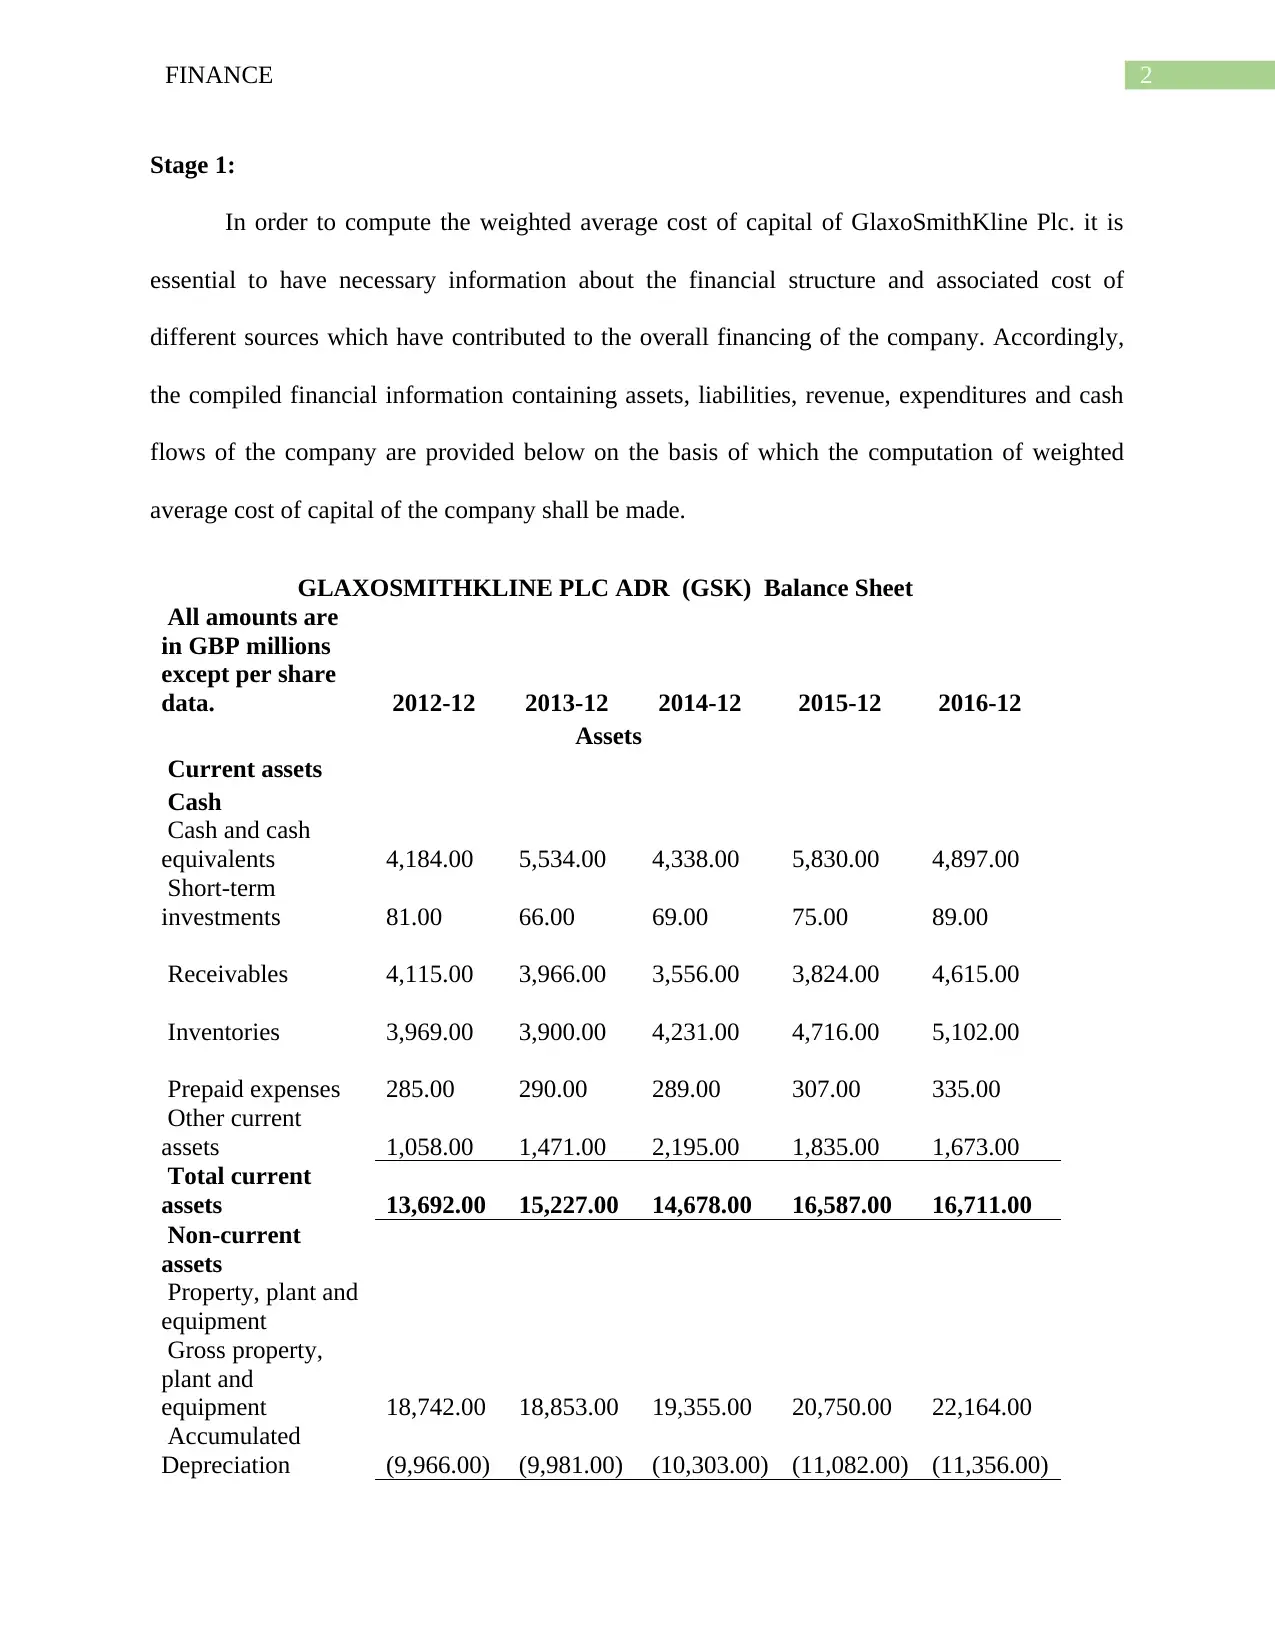
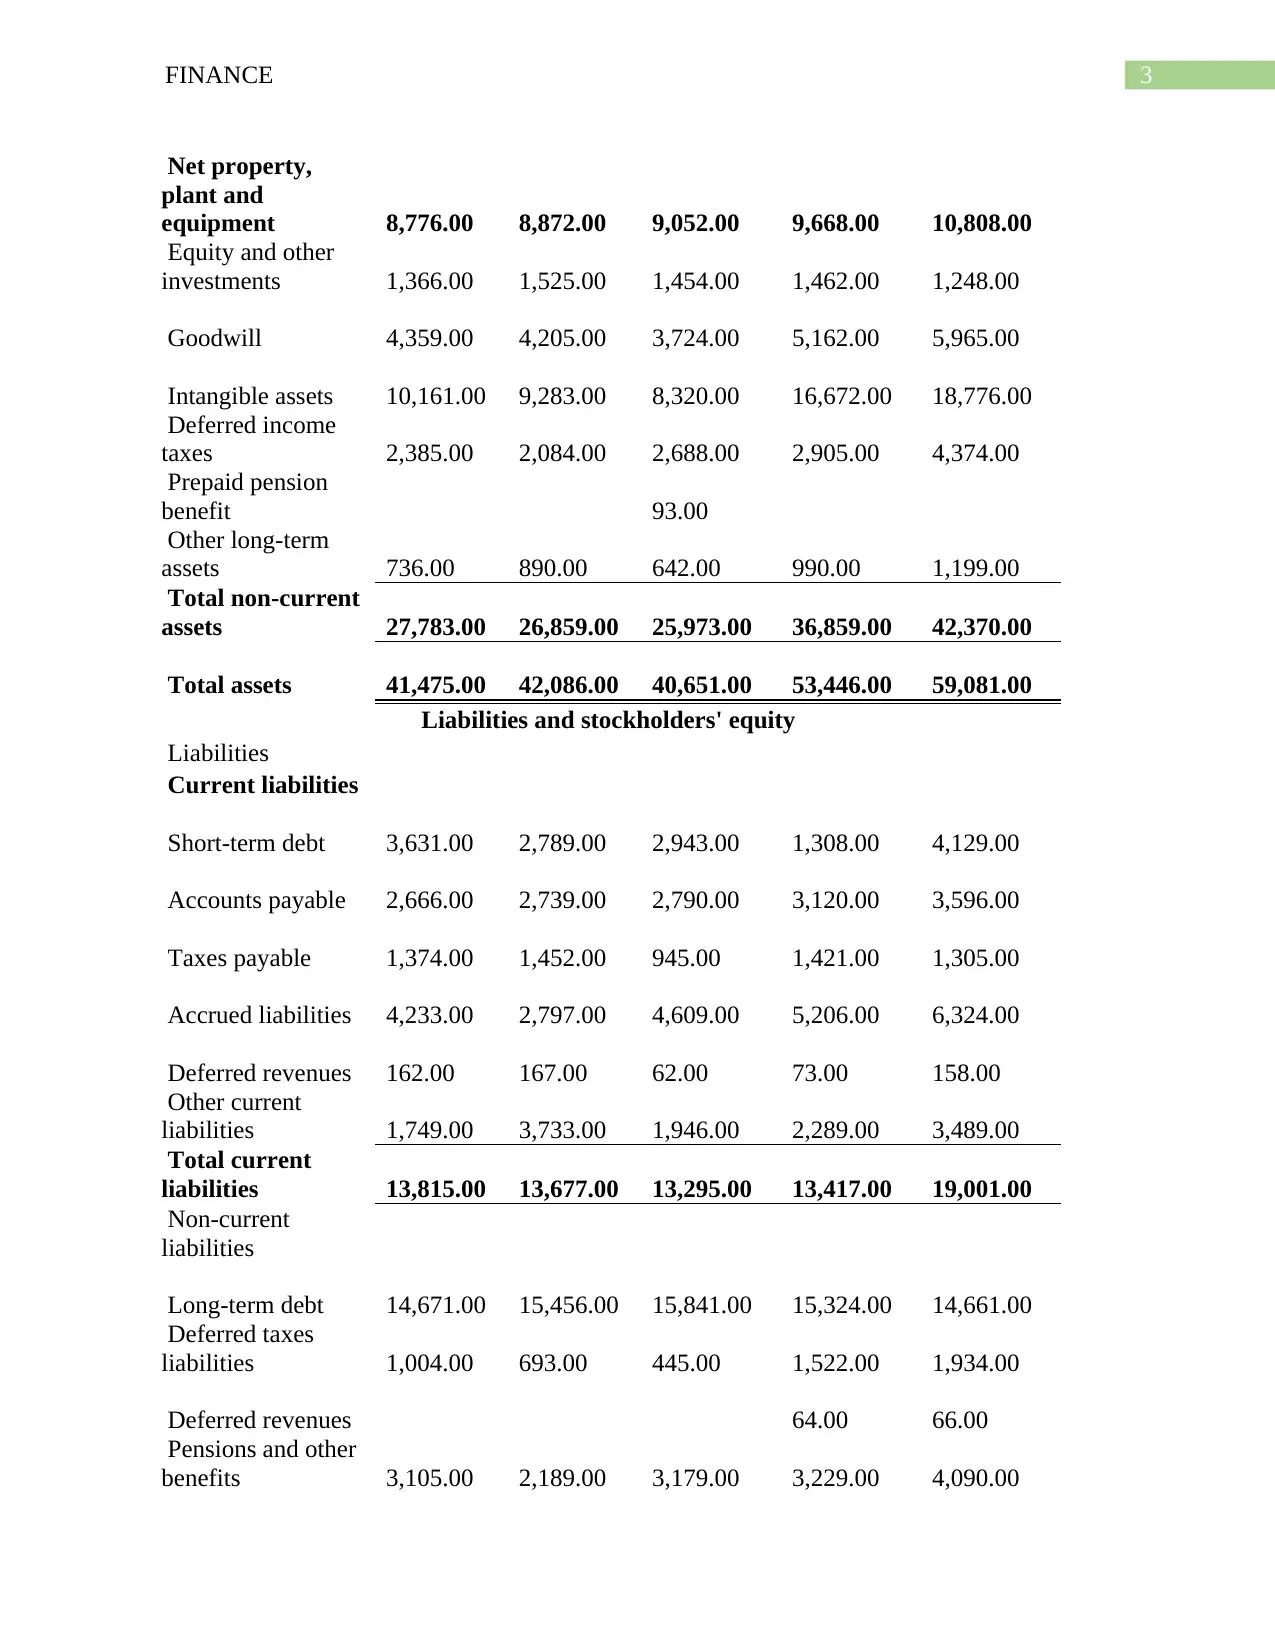
Stage 1:
In order to compute the weighted average cost of capital of GlaxoSmithKline Plc. it is
essential to have necessary information about the financial structure and associated cost of
different sources which have contributed to the overall financing of the company. Accordingly,
the compiled financial information containing assets, liabilities, revenue, expenditures and cash
flows of the company are provided below on the basis of which the computation of weighted
average cost of capital of the company shall be made.
GLAXOSMITHKLINE PLC ADR (GSK) Balance Sheet
All amounts are
in GBP millions
except per share
data. 2012-12 2013-12 2014-12 2015-12 2016-12
Assets
Current assets
Cash
Cash and cash
equivalents 4,184.00 5,534.00 4,338.00 5,830.00 4,897.00
Short-term
investments 81.00 66.00 69.00 75.00 89.00
Receivables 4,115.00 3,966.00 3,556.00 3,824.00 4,615.00
Inventories 3,969.00 3,900.00 4,231.00 4,716.00 5,102.00
Prepaid expenses 285.00 290.00 289.00 307.00 335.00
Other current
assets 1,058.00 1,471.00 2,195.00 1,835.00 1,673.00
Total current
assets 13,692.00 15,227.00 14,678.00 16,587.00 16,711.00
Non-current
assets
Property, plant and
equipment
Gross property,
plant and
equipment 18,742.00 18,853.00 19,355.00 20,750.00 22,164.00
Accumulated
Depreciation (9,966.00) (9,981.00) (10,303.00) (11,082.00) (11,356.00)
⊘ This is a preview!⊘
Do you want full access?
Subscribe today to unlock all pages.
Trusted by 1+ million students worldwide
3FINANCE
Net property,
plant and
equipment 8,776.00 8,872.00 9,052.00 9,668.00 10,808.00
Equity and other
investments 1,366.00 1,525.00 1,454.00 1,462.00 1,248.00
Goodwill 4,359.00 4,205.00 3,724.00 5,162.00 5,965.00
Intangible assets 10,161.00 9,283.00 8,320.00 16,672.00 18,776.00
Deferred income
taxes 2,385.00 2,084.00 2,688.00 2,905.00 4,374.00
Prepaid pension
benefit 93.00
Other long-term
assets 736.00 890.00 642.00 990.00 1,199.00
Total non-current
assets 27,783.00 26,859.00 25,973.00 36,859.00 42,370.00
Total assets 41,475.00 42,086.00 40,651.00 53,446.00 59,081.00
Liabilities and stockholders' equity
Liabilities
Current liabilities
Short-term debt 3,631.00 2,789.00 2,943.00 1,308.00 4,129.00
Accounts payable 2,666.00 2,739.00 2,790.00 3,120.00 3,596.00
Taxes payable 1,374.00 1,452.00 945.00 1,421.00 1,305.00
Accrued liabilities 4,233.00 2,797.00 4,609.00 5,206.00 6,324.00
Deferred revenues 162.00 167.00 62.00 73.00 158.00
Other current
liabilities 1,749.00 3,733.00 1,946.00 2,289.00 3,489.00
Total current
liabilities 13,815.00 13,677.00 13,295.00 13,417.00 19,001.00
Non-current
liabilities
Long-term debt 14,671.00 15,456.00 15,841.00 15,324.00 14,661.00
Deferred taxes
liabilities 1,004.00 693.00 445.00 1,522.00 1,934.00
Deferred revenues 64.00 66.00
Pensions and other
benefits 3,105.00 2,189.00 3,179.00 3,229.00 4,090.00
Paraphrase This Document
Need a fresh take? Get an instant paraphrase of this document with our AI Paraphraser
4FINANCE
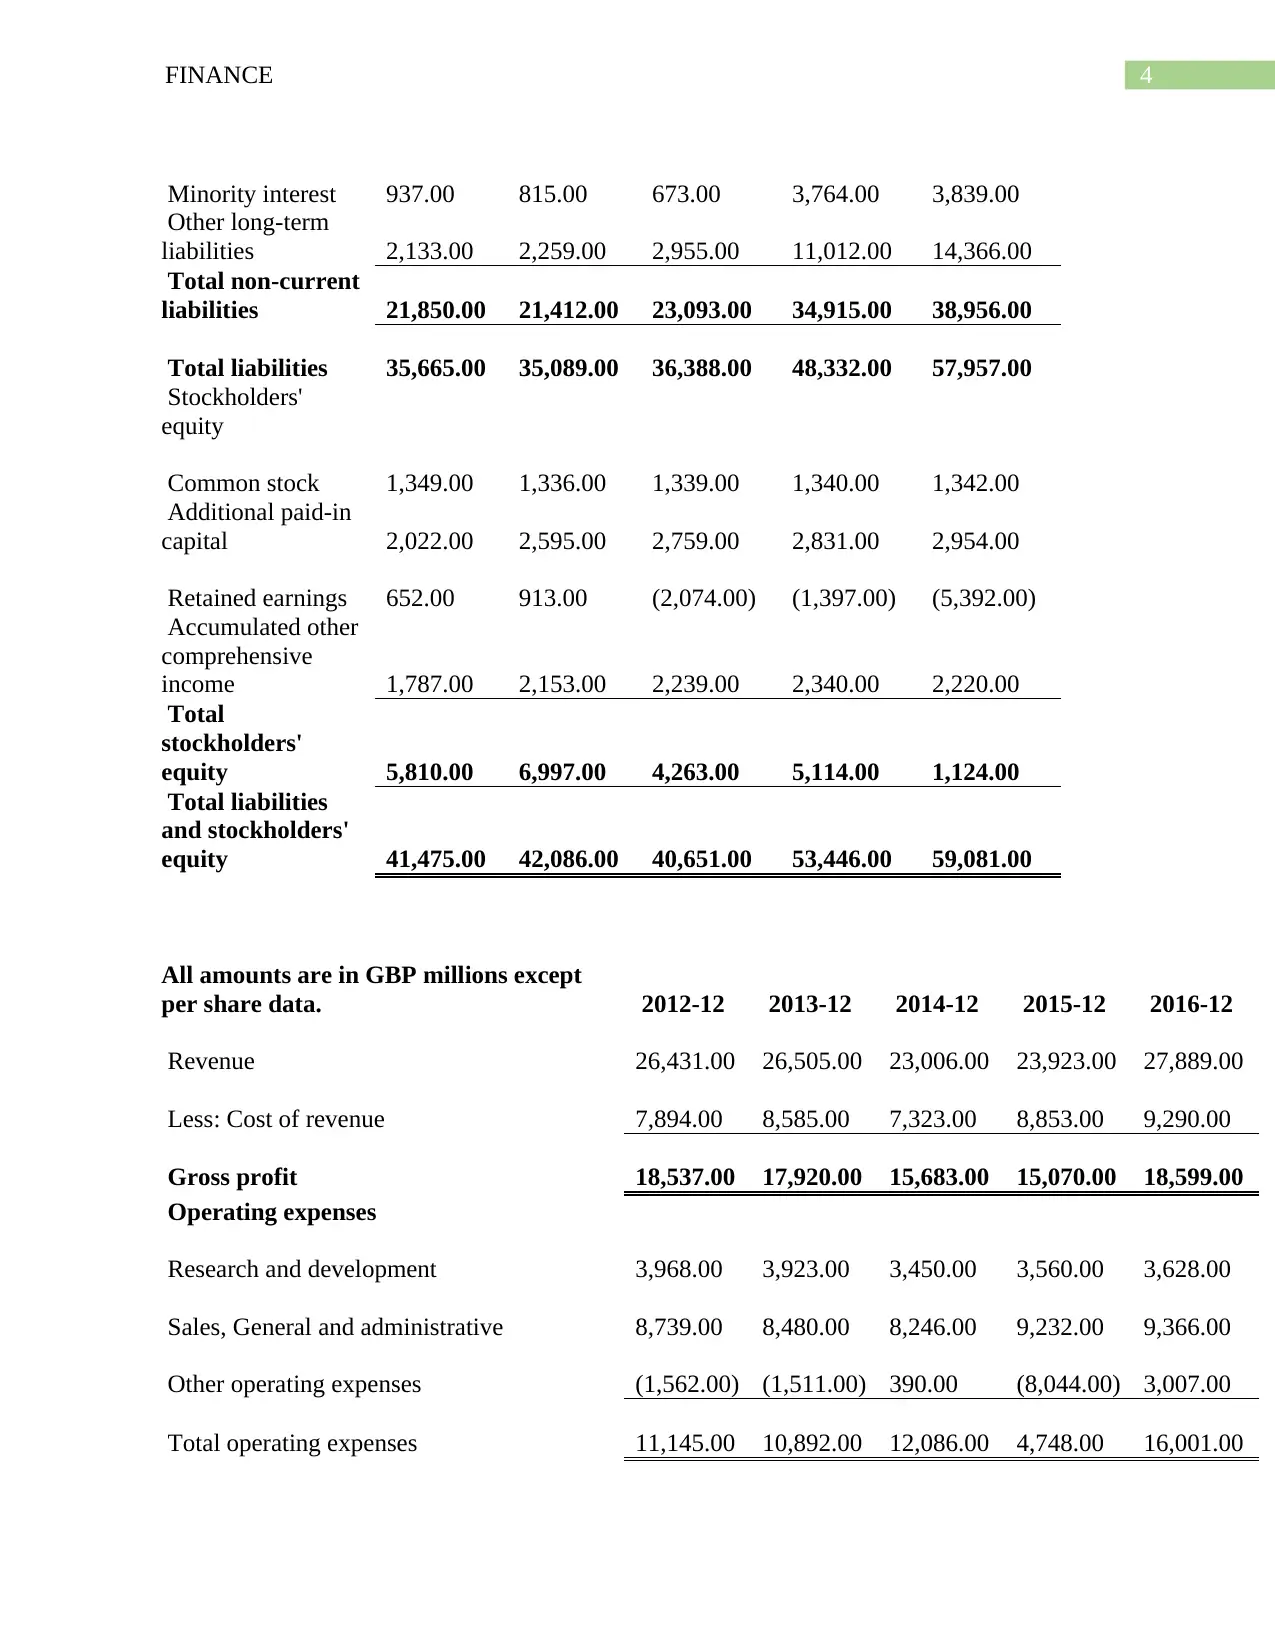
Minority interest 937.00 815.00 673.00 3,764.00 3,839.00
Other long-term
liabilities 2,133.00 2,259.00 2,955.00 11,012.00 14,366.00
Total non-current
liabilities 21,850.00 21,412.00 23,093.00 34,915.00 38,956.00
Total liabilities 35,665.00 35,089.00 36,388.00 48,332.00 57,957.00
Stockholders'
equity
Common stock 1,349.00 1,336.00 1,339.00 1,340.00 1,342.00
Additional paid-in
capital 2,022.00 2,595.00 2,759.00 2,831.00 2,954.00
Retained earnings 652.00 913.00 (2,074.00) (1,397.00) (5,392.00)
Accumulated other
comprehensive
income 1,787.00 2,153.00 2,239.00 2,340.00 2,220.00
Total
stockholders'
equity 5,810.00 6,997.00 4,263.00 5,114.00 1,124.00
Total liabilities
and stockholders'
equity 41,475.00 42,086.00 40,651.00 53,446.00 59,081.00
All amounts are in GBP millions except
per share data. 2012-12 2013-12 2014-12 2015-12 2016-12
Revenue 26,431.00 26,505.00 23,006.00 23,923.00 27,889.00
Less: Cost of revenue 7,894.00 8,585.00 7,323.00 8,853.00 9,290.00
Gross profit 18,537.00 17,920.00 15,683.00 15,070.00 18,599.00
Operating expenses
Research and development 3,968.00 3,923.00 3,450.00 3,560.00 3,628.00
Sales, General and administrative 8,739.00 8,480.00 8,246.00 9,232.00 9,366.00
Other operating expenses (1,562.00) (1,511.00) 390.00 (8,044.00) 3,007.00
Total operating expenses 11,145.00 10,892.00 12,086.00 4,748.00 16,001.00
5FINANCE
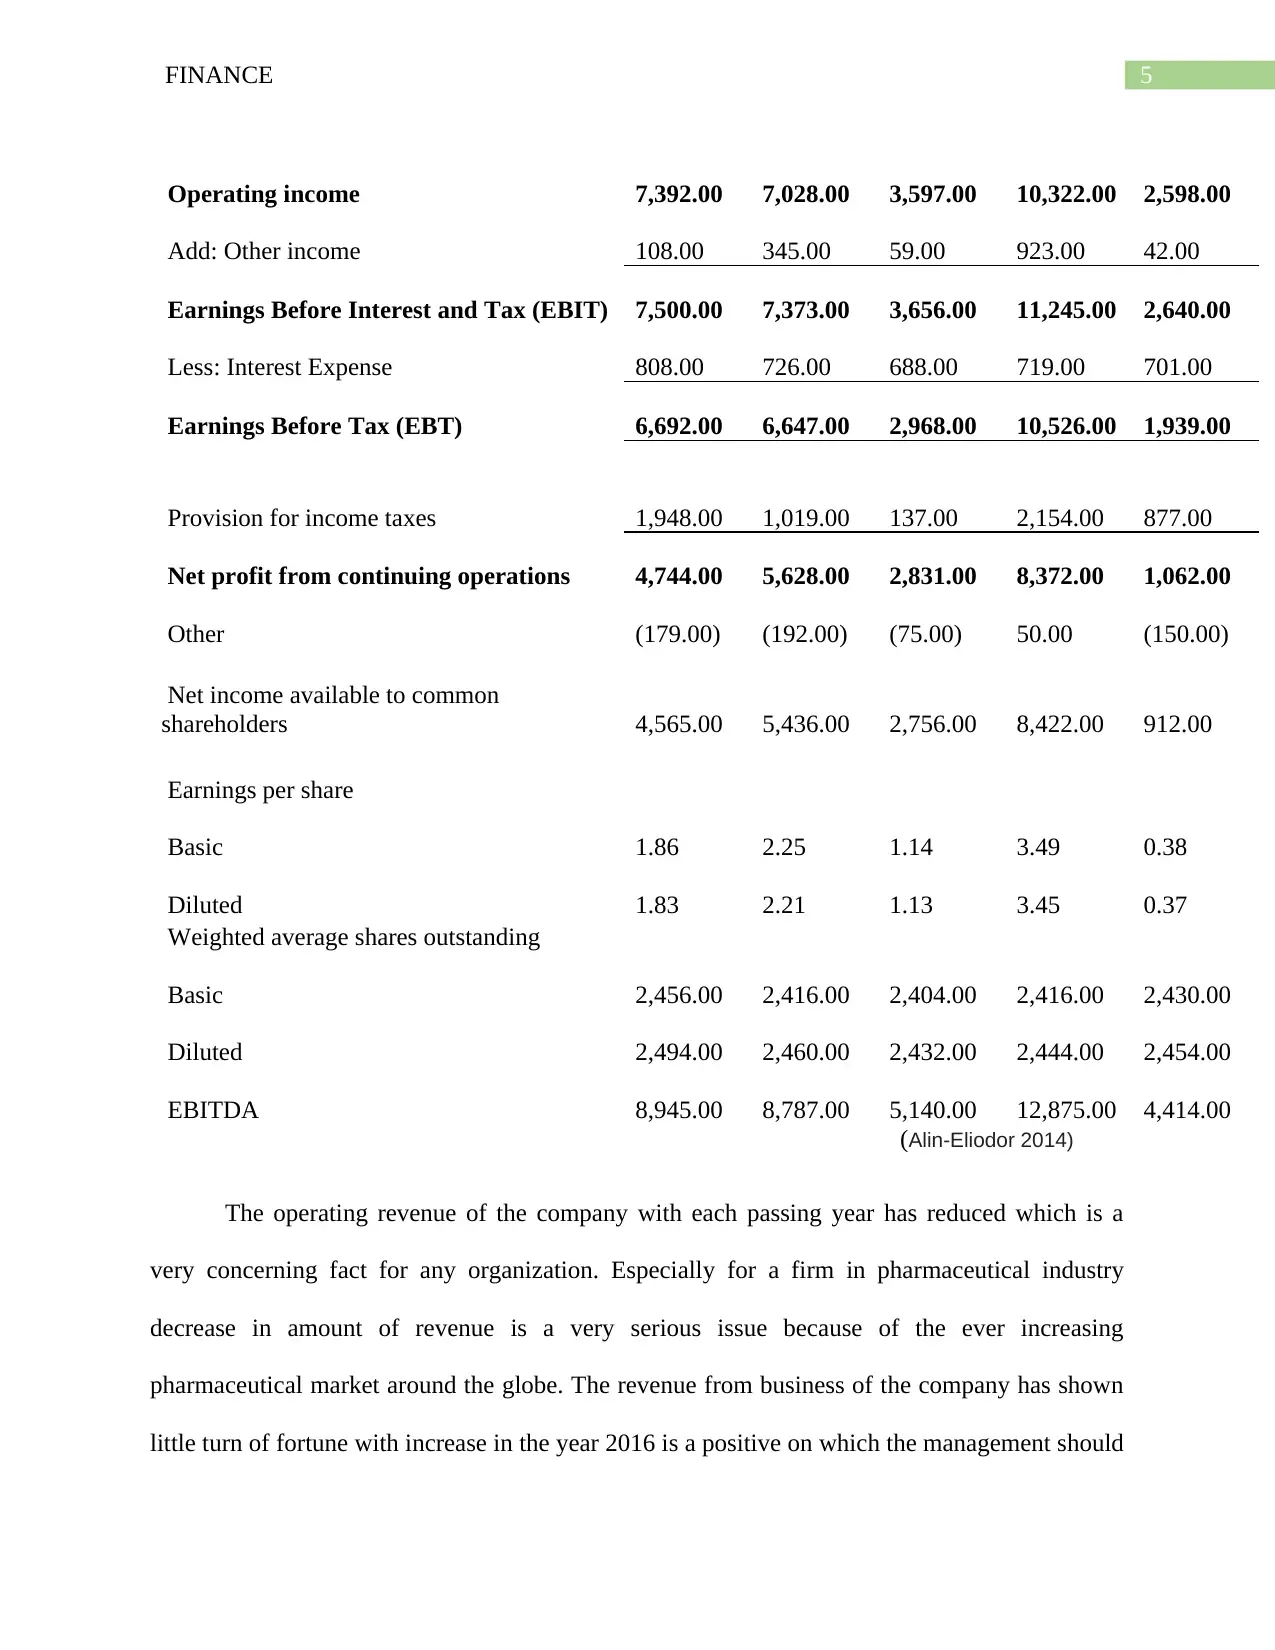
Operating income 7,392.00 7,028.00 3,597.00 10,322.00 2,598.00
Add: Other income 108.00 345.00 59.00 923.00 42.00
Earnings Before Interest and Tax (EBIT) 7,500.00 7,373.00 3,656.00 11,245.00 2,640.00
Less: Interest Expense 808.00 726.00 688.00 719.00 701.00
Earnings Before Tax (EBT) 6,692.00 6,647.00 2,968.00 10,526.00 1,939.00
Provision for income taxes 1,948.00 1,019.00 137.00 2,154.00 877.00
Net profit from continuing operations 4,744.00 5,628.00 2,831.00 8,372.00 1,062.00
Other (179.00) (192.00) (75.00) 50.00 (150.00)
Net income available to common
shareholders 4,565.00 5,436.00 2,756.00 8,422.00 912.00
Earnings per share
Basic 1.86 2.25 1.14 3.49 0.38
Diluted 1.83 2.21 1.13 3.45 0.37
Weighted average shares outstanding
Basic 2,456.00 2,416.00 2,404.00 2,416.00 2,430.00
Diluted 2,494.00 2,460.00 2,432.00 2,444.00 2,454.00
EBITDA 8,945.00 8,787.00 5,140.00 12,875.00 4,414.00
(Alin-Eliodor 2014)
The operating revenue of the company with each passing year has reduced which is a
very concerning fact for any organization. Especially for a firm in pharmaceutical industry
decrease in amount of revenue is a very serious issue because of the ever increasing
pharmaceutical market around the globe. The revenue from business of the company has shown
little turn of fortune with increase in the year 2016 is a positive on which the management should
⊘ This is a preview!⊘
Do you want full access?
Subscribe today to unlock all pages.
Trusted by 1+ million students worldwide
6FINANCE
build its momentum to improve the operating performance in the future. The operating income is
a directly measuring factor that is used to determine the operating efficiency of an organization.
The fact that Earnings before Interests and Taxes (EBIT) as well as Earnings before Taxes (EBT)
both have reduced substantially over the last five year including 2016 is an alarming sign for the
company. A clear indication that the company has been unable to perform in the last few years
the way it did in the past (Bonaimé et al. 2014)).
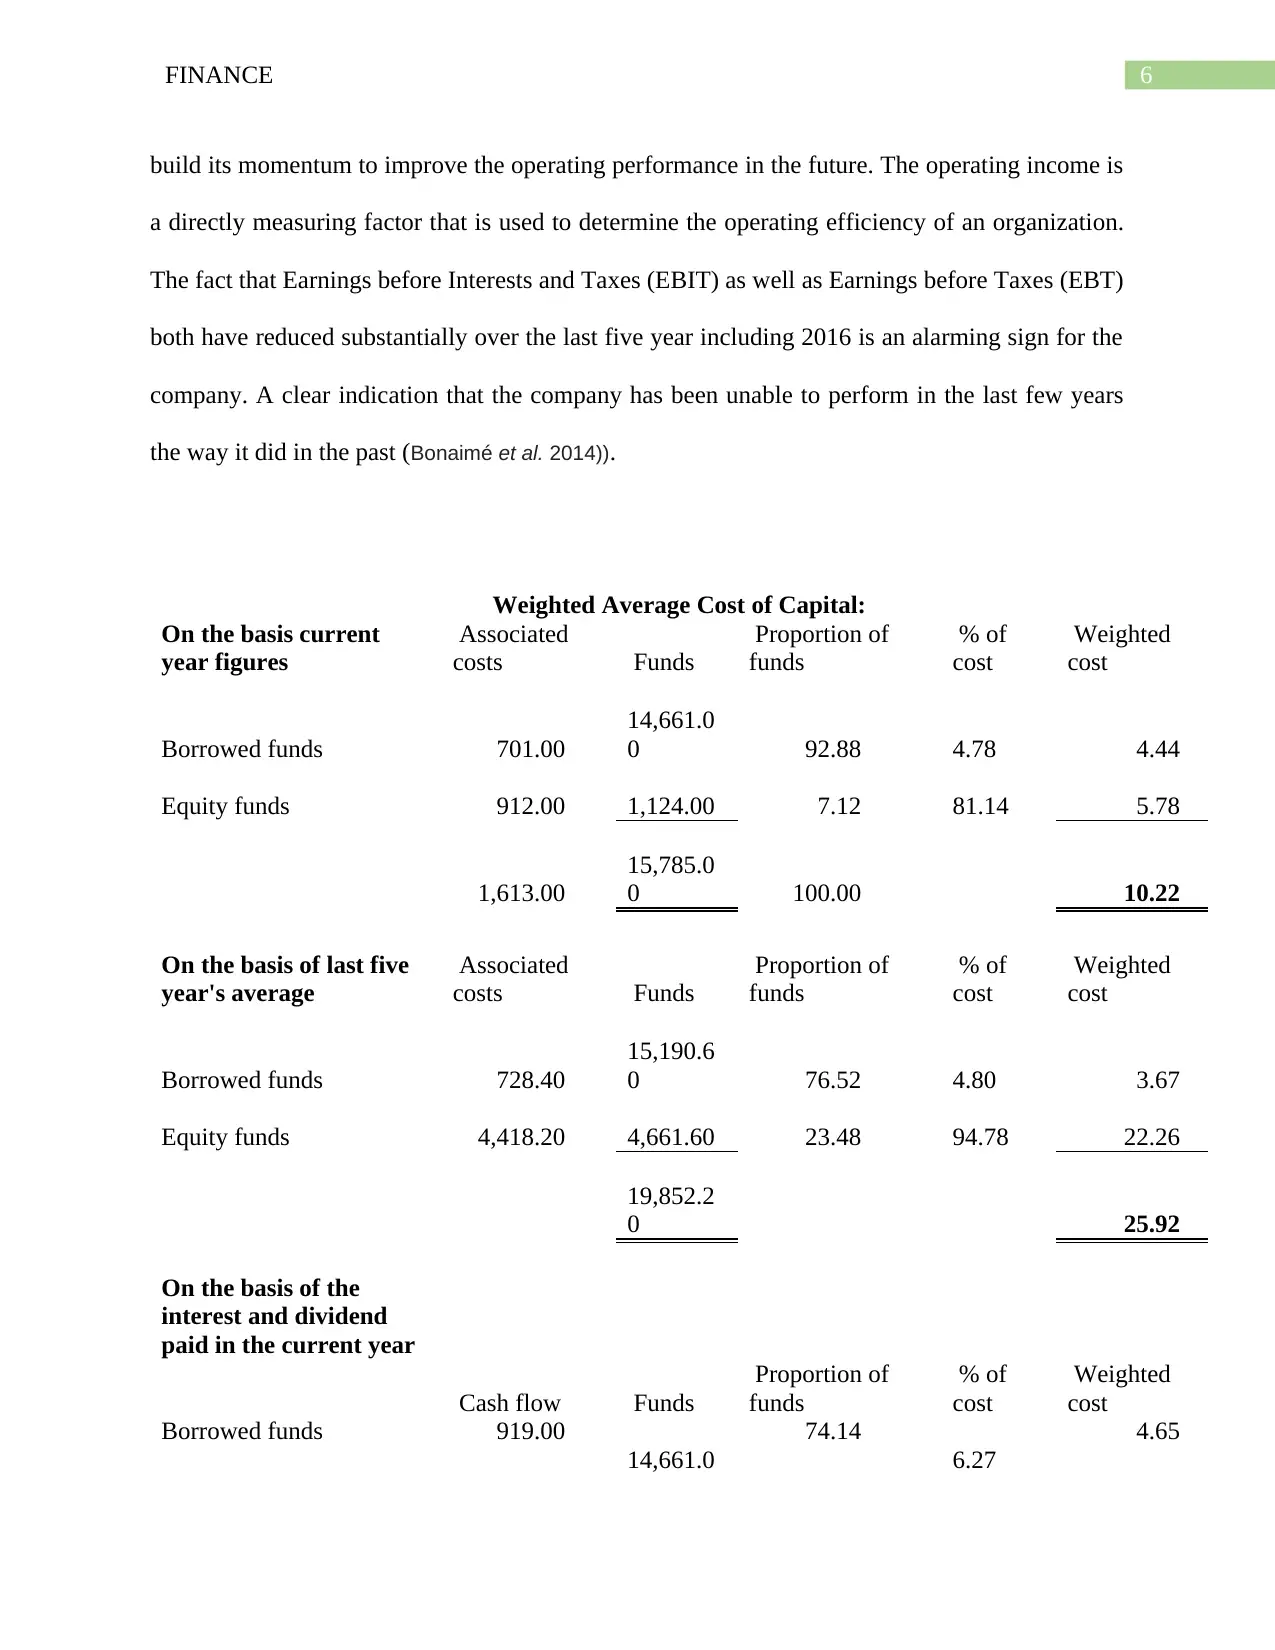
Weighted Average Cost of Capital:
On the basis current
year figures
Associated
costs Funds
Proportion of
funds
% of
cost
Weighted
cost
Borrowed funds 701.00
14,661.0
0 92.88 4.78 4.44
Equity funds 912.00 1,124.00 7.12 81.14 5.78
1,613.00
15,785.0
0 100.00 10.22
On the basis of last five
year's average
Associated
costs Funds
Proportion of
funds
% of
cost
Weighted
cost
Borrowed funds 728.40
15,190.6
0 76.52 4.80 3.67
Equity funds 4,418.20 4,661.60 23.48 94.78 22.26
19,852.2
0 25.92
On the basis of the
interest and dividend
paid in the current year
Cash flow Funds
Proportion of
funds
% of
cost
Weighted
cost
Borrowed funds 919.00
14,661.0
74.14
6.27
4.65
build its momentum to improve the operating performance in the future. The operating income is
a directly measuring factor that is used to determine the operating efficiency of an organization.
The fact that Earnings before Interests and Taxes (EBIT) as well as Earnings before Taxes (EBT)
both have reduced substantially over the last five year including 2016 is an alarming sign for the
company. A clear indication that the company has been unable to perform in the last few years
the way it did in the past (Bonaimé et al. 2014)).
Weighted Average Cost of Capital:
On the basis current
year figures
Associated
costs Funds
Proportion of
funds
% of
cost
Weighted
cost
Borrowed funds 701.00
14,661.0
0 92.88 4.78 4.44
Equity funds 912.00 1,124.00 7.12 81.14 5.78
1,613.00
15,785.0
0 100.00 10.22
On the basis of last five
year's average
Associated
costs Funds
Proportion of
funds
% of
cost
Weighted
cost
Borrowed funds 728.40
15,190.6
0 76.52 4.80 3.67
Equity funds 4,418.20 4,661.60 23.48 94.78 22.26
19,852.2
0 25.92
On the basis of the
interest and dividend
paid in the current year
Cash flow Funds
Proportion of
funds
% of
cost
Weighted
cost
Borrowed funds 919.00
14,661.0
74.14
6.27
4.65
Paraphrase This Document
Need a fresh take? Get an instant paraphrase of this document with our AI Paraphraser
7FINANCE
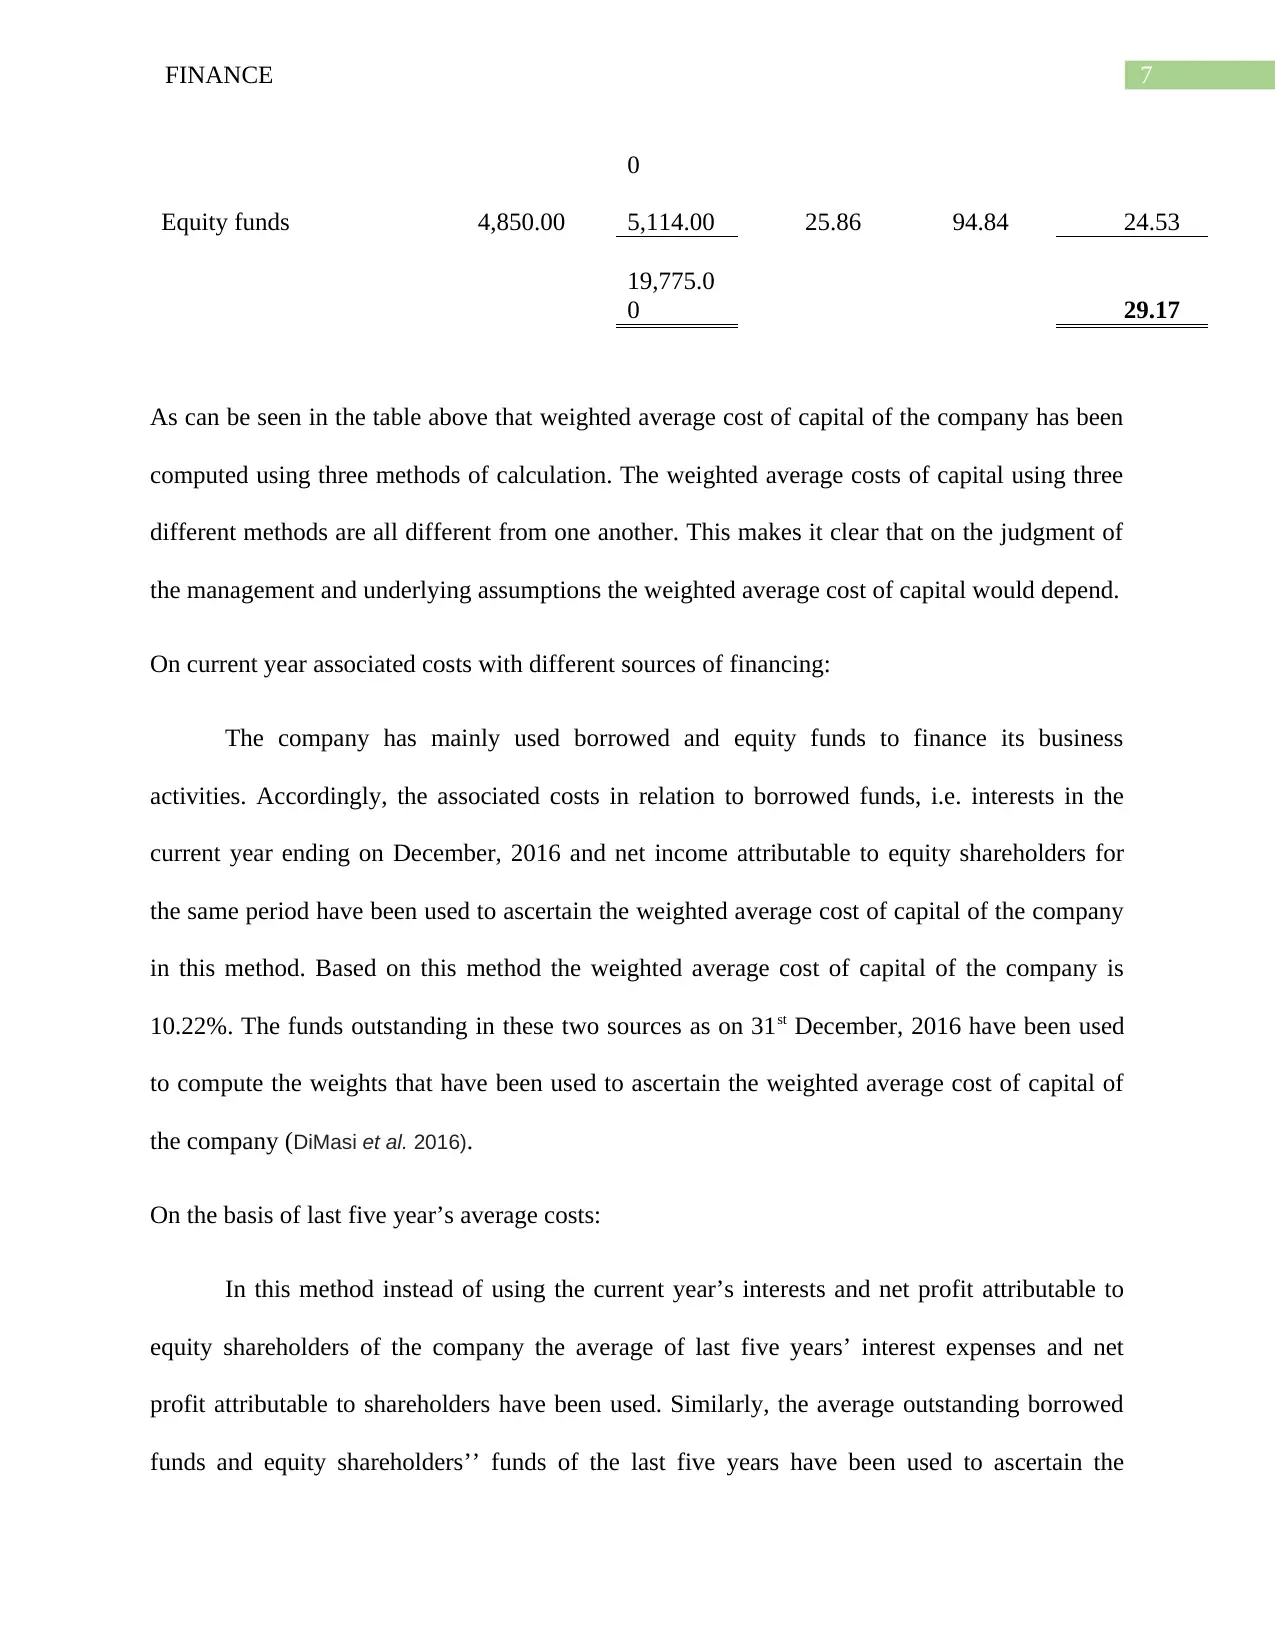
0
Equity funds 4,850.00 5,114.00 25.86 94.84 24.53
19,775.0
0 29.17
As can be seen in the table above that weighted average cost of capital of the company has been
computed using three methods of calculation. The weighted average costs of capital using three
different methods are all different from one another. This makes it clear that on the judgment of
the management and underlying assumptions the weighted average cost of capital would depend.
On current year associated costs with different sources of financing:
The company has mainly used borrowed and equity funds to finance its business
activities. Accordingly, the associated costs in relation to borrowed funds, i.e. interests in the
current year ending on December, 2016 and net income attributable to equity shareholders for
the same period have been used to ascertain the weighted average cost of capital of the company
in this method. Based on this method the weighted average cost of capital of the company is
10.22%. The funds outstanding in these two sources as on 31st December, 2016 have been used
to compute the weights that have been used to ascertain the weighted average cost of capital of
the company (DiMasi et al. 2016).
On the basis of last five year’s average costs:
In this method instead of using the current year’s interests and net profit attributable to
equity shareholders of the company the average of last five years’ interest expenses and net
profit attributable to shareholders have been used. Similarly, the average outstanding borrowed
funds and equity shareholders’’ funds of the last five years have been used to ascertain the
8FINANCE
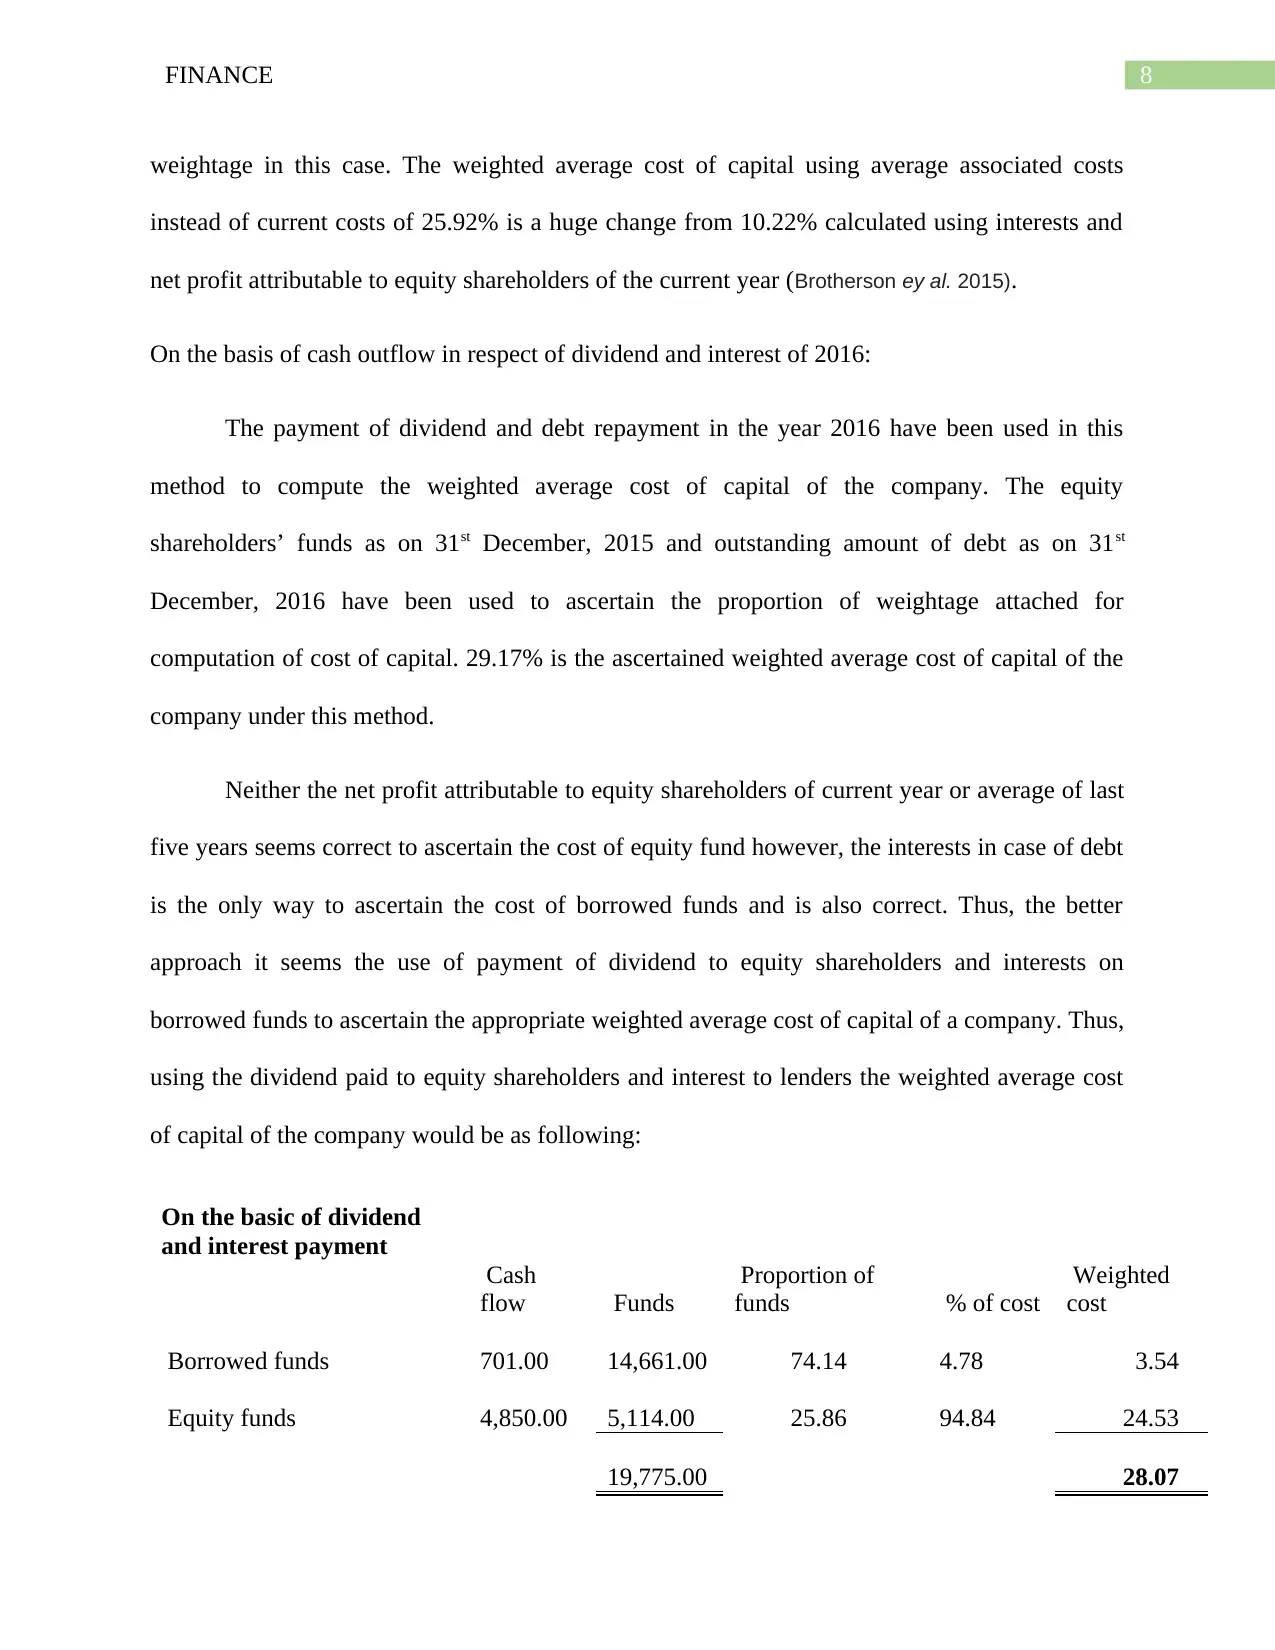
weightage in this case. The weighted average cost of capital using average associated costs
instead of current costs of 25.92% is a huge change from 10.22% calculated using interests and
net profit attributable to equity shareholders of the current year (Brotherson ey al. 2015).
On the basis of cash outflow in respect of dividend and interest of 2016:
The payment of dividend and debt repayment in the year 2016 have been used in this
method to compute the weighted average cost of capital of the company. The equity
shareholders’ funds as on 31st December, 2015 and outstanding amount of debt as on 31st
December, 2016 have been used to ascertain the proportion of weightage attached for
computation of cost of capital. 29.17% is the ascertained weighted average cost of capital of the
company under this method.
Neither the net profit attributable to equity shareholders of current year or average of last
five years seems correct to ascertain the cost of equity fund however, the interests in case of debt
is the only way to ascertain the cost of borrowed funds and is also correct. Thus, the better
approach it seems the use of payment of dividend to equity shareholders and interests on
borrowed funds to ascertain the appropriate weighted average cost of capital of a company. Thus,
using the dividend paid to equity shareholders and interest to lenders the weighted average cost
of capital of the company would be as following:
On the basic of dividend
and interest payment
Cash
flow Funds
Proportion of
funds % of cost
Weighted
cost
Borrowed funds 701.00 14,661.00 74.14 4.78 3.54
Equity funds 4,850.00 5,114.00 25.86 94.84 24.53
19,775.00 28.07
⊘ This is a preview!⊘
Do you want full access?
Subscribe today to unlock all pages.
Trusted by 1+ million students worldwide
9FINANCE
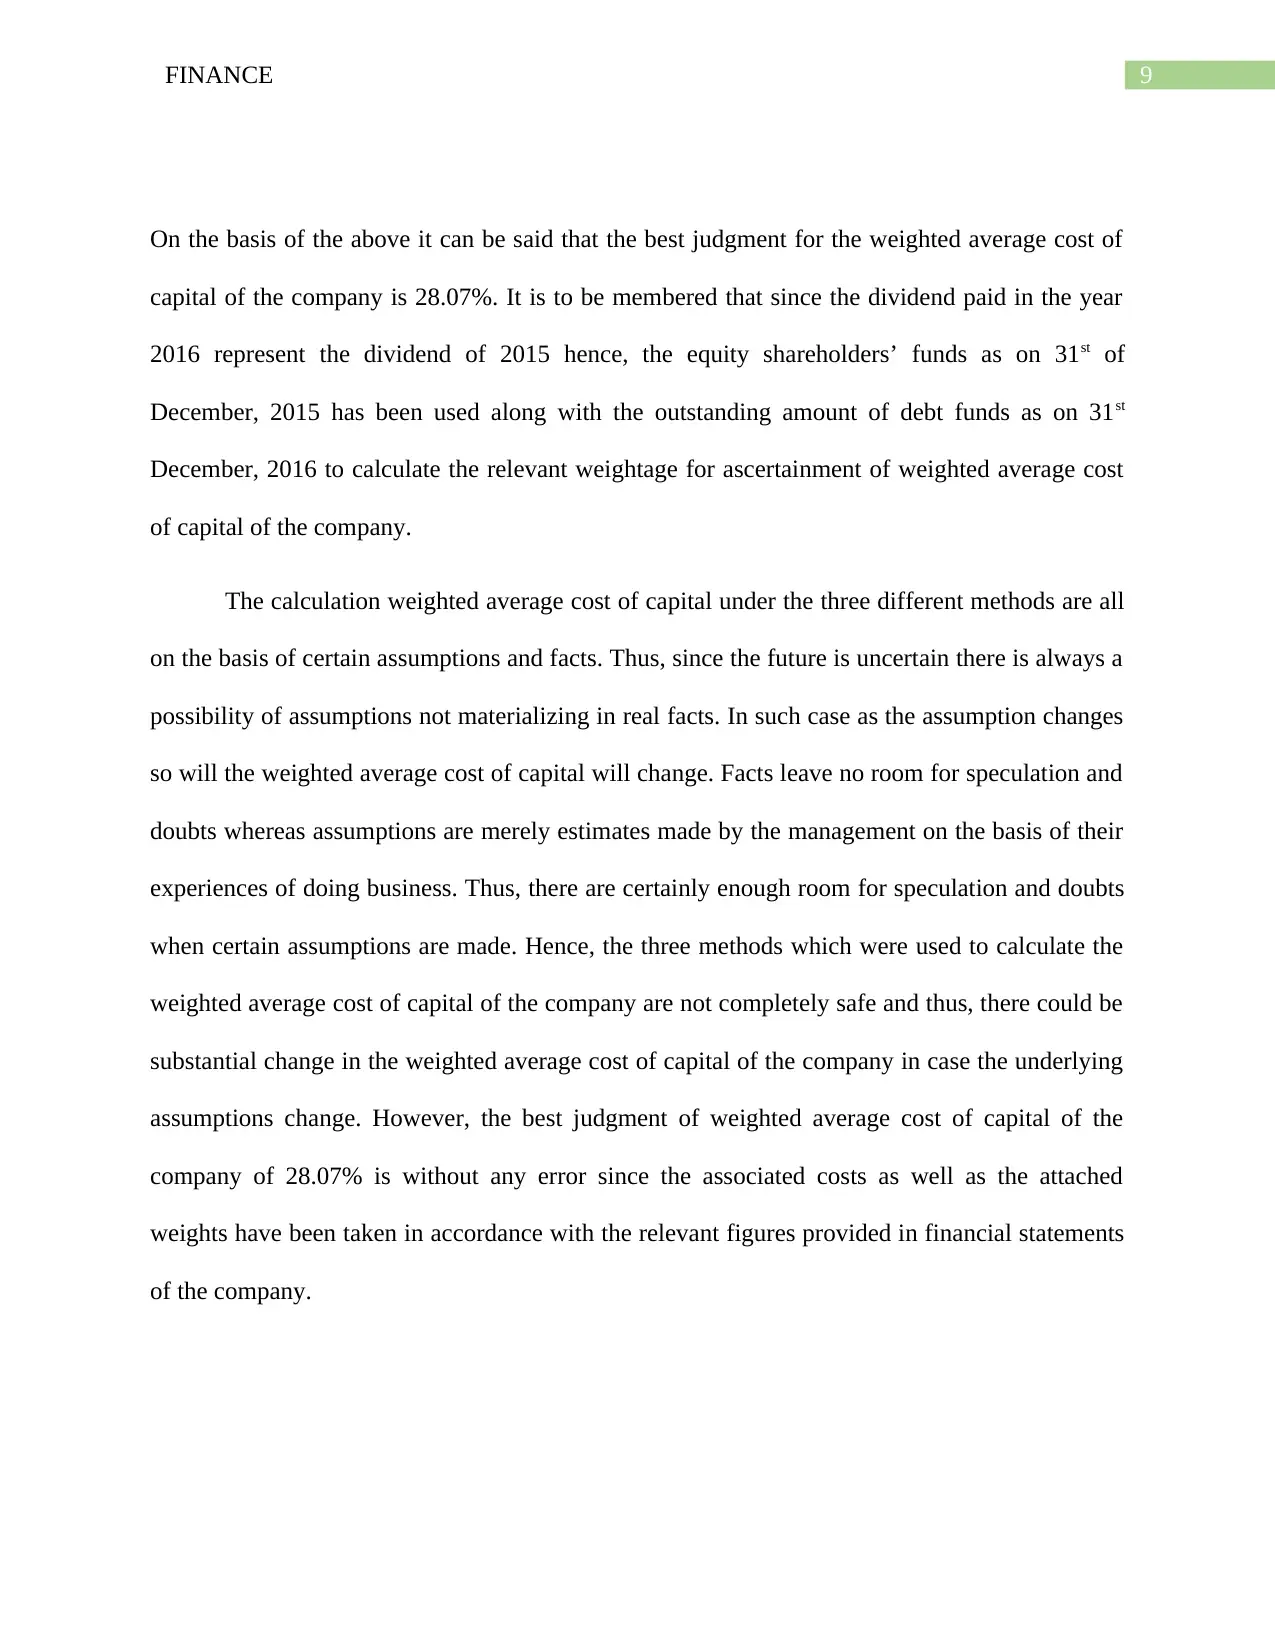
On the basis of the above it can be said that the best judgment for the weighted average cost of
capital of the company is 28.07%. It is to be membered that since the dividend paid in the year
2016 represent the dividend of 2015 hence, the equity shareholders’ funds as on 31st of
December, 2015 has been used along with the outstanding amount of debt funds as on 31st
December, 2016 to calculate the relevant weightage for ascertainment of weighted average cost
of capital of the company.
The calculation weighted average cost of capital under the three different methods are all
on the basis of certain assumptions and facts. Thus, since the future is uncertain there is always a
possibility of assumptions not materializing in real facts. In such case as the assumption changes
so will the weighted average cost of capital will change. Facts leave no room for speculation and
doubts whereas assumptions are merely estimates made by the management on the basis of their
experiences of doing business. Thus, there are certainly enough room for speculation and doubts
when certain assumptions are made. Hence, the three methods which were used to calculate the
weighted average cost of capital of the company are not completely safe and thus, there could be
substantial change in the weighted average cost of capital of the company in case the underlying
assumptions change. However, the best judgment of weighted average cost of capital of the
company of 28.07% is without any error since the associated costs as well as the attached
weights have been taken in accordance with the relevant figures provided in financial statements
of the company.
Paraphrase This Document
Need a fresh take? Get an instant paraphrase of this document with our AI Paraphraser
10FINANCE
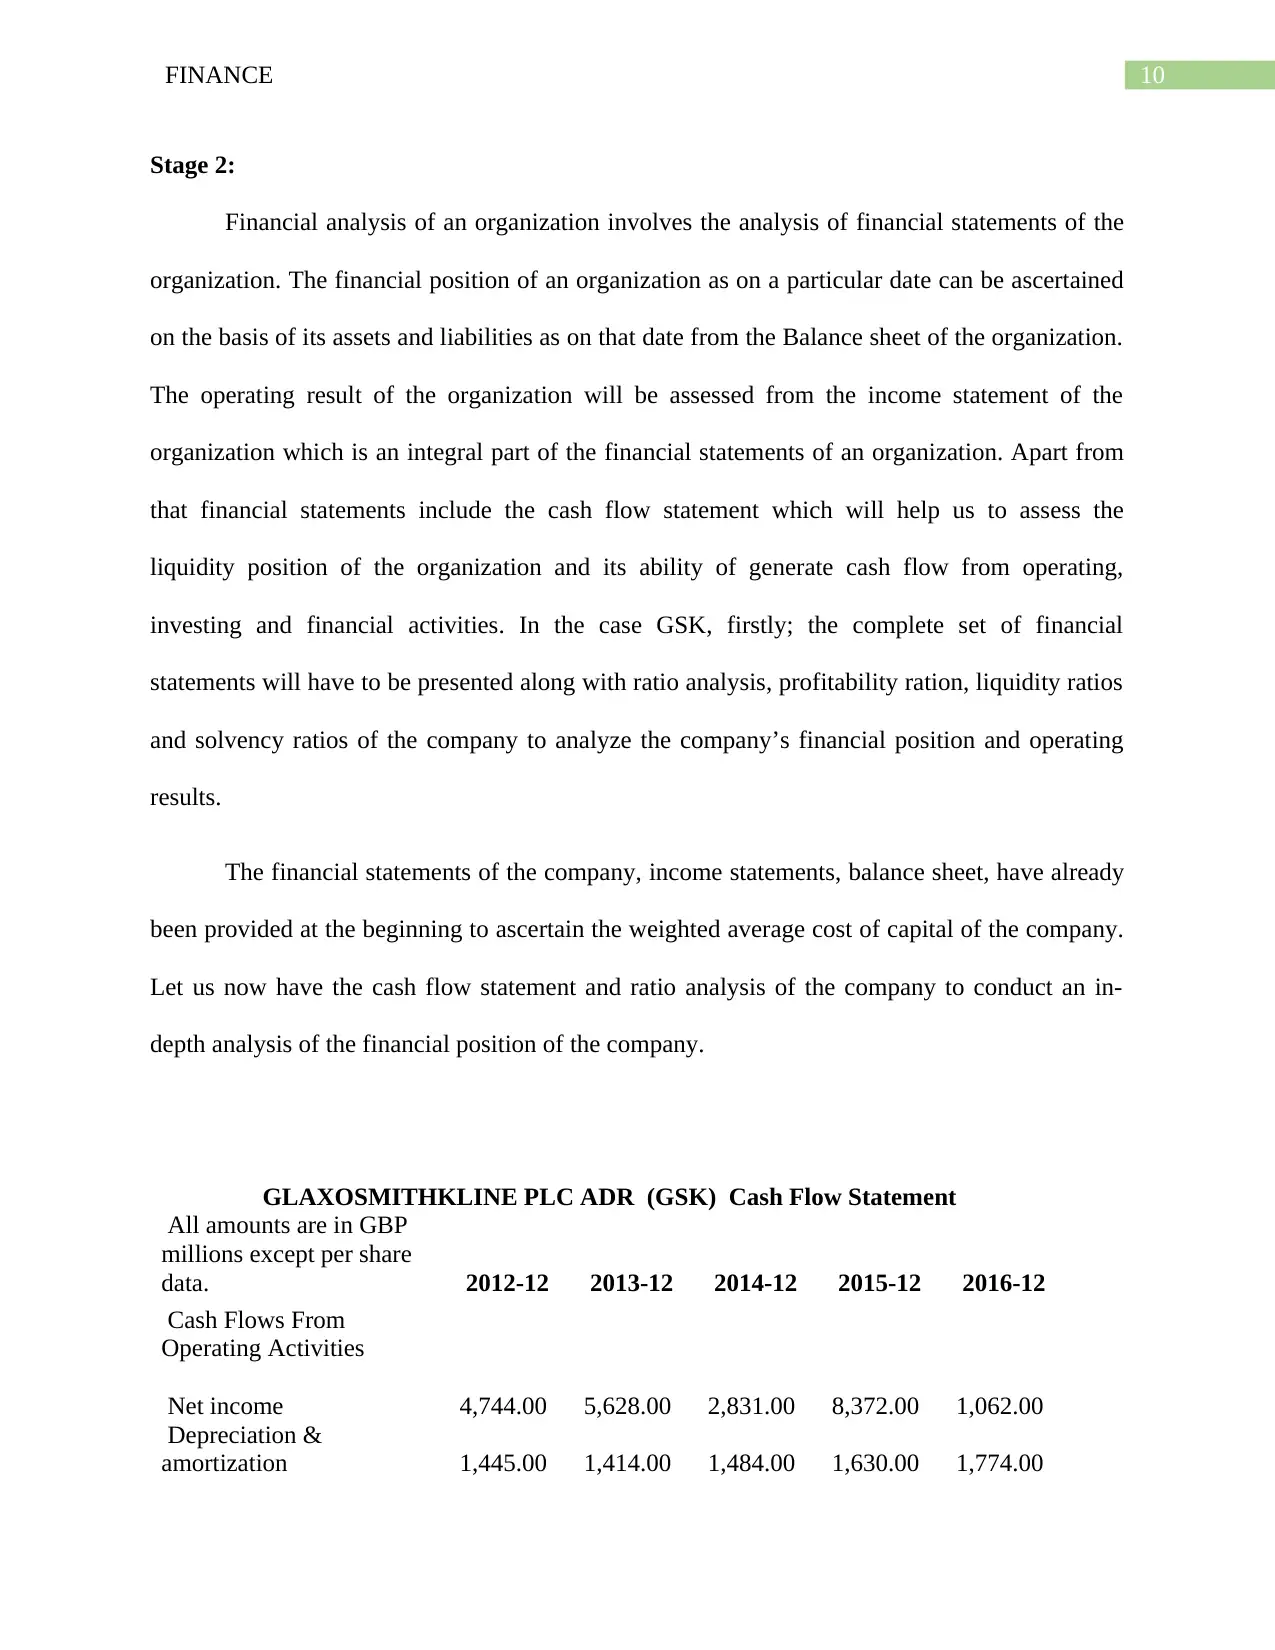
Stage 2:
Financial analysis of an organization involves the analysis of financial statements of the
organization. The financial position of an organization as on a particular date can be ascertained
on the basis of its assets and liabilities as on that date from the Balance sheet of the organization.
The operating result of the organization will be assessed from the income statement of the
organization which is an integral part of the financial statements of an organization. Apart from
that financial statements include the cash flow statement which will help us to assess the
liquidity position of the organization and its ability of generate cash flow from operating,
investing and financial activities. In the case GSK, firstly; the complete set of financial
statements will have to be presented along with ratio analysis, profitability ration, liquidity ratios
and solvency ratios of the company to analyze the company’s financial position and operating
results.
The financial statements of the company, income statements, balance sheet, have already
been provided at the beginning to ascertain the weighted average cost of capital of the company.
Let us now have the cash flow statement and ratio analysis of the company to conduct an in-
depth analysis of the financial position of the company.
GLAXOSMITHKLINE PLC ADR (GSK) Cash Flow Statement
All amounts are in GBP
millions except per share
data. 2012-12 2013-12 2014-12 2015-12 2016-12
Cash Flows From
Operating Activities
Net income 4,744.00 5,628.00 2,831.00 8,372.00 1,062.00
Depreciation &
amortization 1,445.00 1,414.00 1,484.00 1,630.00 1,774.00
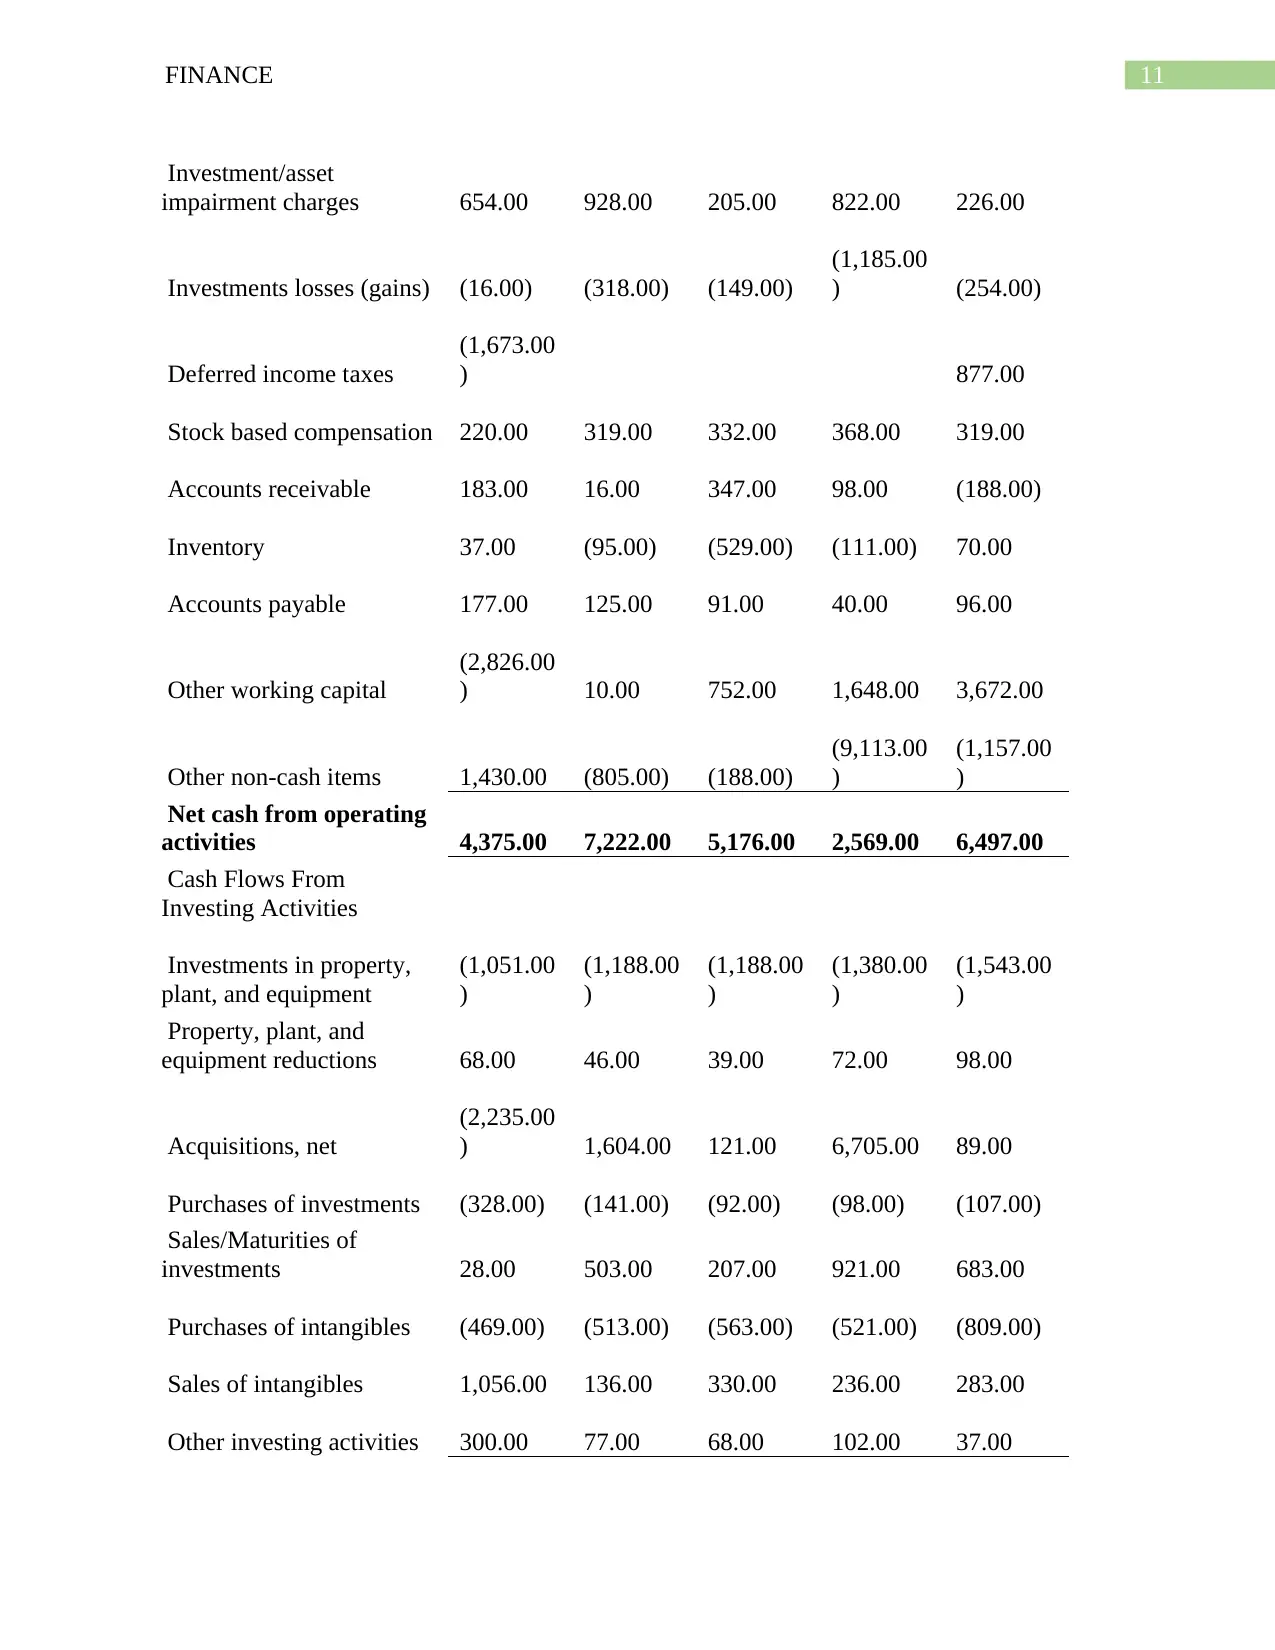
11FINANCE
Investment/asset
impairment charges 654.00 928.00 205.00 822.00 226.00
Investments losses (gains) (16.00) (318.00) (149.00)
(1,185.00
) (254.00)
Deferred income taxes
(1,673.00
) 877.00
Stock based compensation 220.00 319.00 332.00 368.00 319.00
Accounts receivable 183.00 16.00 347.00 98.00 (188.00)
Inventory 37.00 (95.00) (529.00) (111.00) 70.00
Accounts payable 177.00 125.00 91.00 40.00 96.00
Other working capital
(2,826.00
) 10.00 752.00 1,648.00 3,672.00
Other non-cash items 1,430.00 (805.00) (188.00)
(9,113.00
)
(1,157.00
)
Net cash from operating
activities 4,375.00 7,222.00 5,176.00 2,569.00 6,497.00
Cash Flows From
Investing Activities
Investments in property,
plant, and equipment
(1,051.00
)
(1,188.00
)
(1,188.00
)
(1,380.00
)
(1,543.00
)
Property, plant, and
equipment reductions 68.00 46.00 39.00 72.00 98.00
Acquisitions, net
(2,235.00
) 1,604.00 121.00 6,705.00 89.00
Purchases of investments (328.00) (141.00) (92.00) (98.00) (107.00)
Sales/Maturities of
investments 28.00 503.00 207.00 921.00 683.00
Purchases of intangibles (469.00) (513.00) (563.00) (521.00) (809.00)
Sales of intangibles 1,056.00 136.00 330.00 236.00 283.00
Other investing activities 300.00 77.00 68.00 102.00 37.00
⊘ This is a preview!⊘
Do you want full access?
Subscribe today to unlock all pages.
Trusted by 1+ million students worldwide
1 out of 25
Related Documents


Your All-in-One AI-Powered Toolkit for Academic Success.
+13062052269
info@desklib.com
Available 24*7 on WhatsApp / Email
![[object Object]](/_next/static/media/star-bottom.7253800d.svg)
Unlock your academic potential
Copyright © 2020–2026 A2Z Services. All Rights Reserved. Developed and managed by ZUCOL.