Finance: Final Project Part II - Target vs. Walmart Financial Analysis
VerifiedAdded on 2019/09/19
|13
|2831
|420
Report
AI Summary
This finance report provides a comprehensive comparative analysis of Target Corporation and Walmart Stores, evaluating their financial performance over a three-year period. The analysis includes calculations of three-year returns, compounded annual growth rates (CAGR), and comparisons of key f...
Finance: Final Project Part II
Paraphrase This Document
Need a fresh take? Get an instant paraphrase of this document with our AI Paraphraser
Finance: Final Project Part II
Table of Contents
Three-year Returns.........................................................................................................................................2
Target Corporation.....................................................................................................................................2
Wal-Mart Stores.........................................................................................................................................2
Comparison................................................................................................................................................3
Industry Comparison......................................................................................................................................3
Target Corporation.....................................................................................................................................3
Wal-Mart Stores.........................................................................................................................................4
Performance over Time..................................................................................................................................5
Target Corporation.....................................................................................................................................5
Strengths................................................................................................................................................5
Weaknesses............................................................................................................................................6
Wal-Mart Stores.........................................................................................................................................7
Strengths................................................................................................................................................7
Weaknesses............................................................................................................................................7
Comparison................................................................................................................................................8
Investment......................................................................................................................................................8
References....................................................................................................................................................10
1

Finance: Final Project Part II
Three-year Returns
Target Corporation
Target Corporation’s three year return is calculated in absolute terms as well as in compounded
or annualized growth terms if the profits are reinvested (Chan, 2009). The financial year of
Target Corporation ends at 31st of January every year so closing share price at the end of this
month is taken for calculation. The opening price at the beginning of February 2013 was $60.94
(B953, TGT Historical Prices) while closing price at the end of January 2016 was $72.42 (E200,
TGT Historical Prices). Thus the absolute return on the Target’s stock will be:
AR = (72.42 - 60.94) / 60.94 * 100
= 18.83% (I9, TGT Price History)
The return is also calculated using compounded annual growth method in which CAGR
(Compounded Annual Growth Rate) is calculated using the following equation:
72.42 = 60.94 (1 + r) 3
Where, r = CAGR
Thus, the value of r is calculated to be at 5.59% (J9, TGT Price History). The stock of Target has
increased wealth by compounding it by 5.59% each year for three years.
Wal-Mart Stores
The return on Wal-Mart’s stock is also calculated using the methodology discussed above. The
company’s opening share price at the beginning of February 2013 is $70.11 (B953, WMT
2
You're viewing a preview
Unlock full access by subscribing today!


Finance: Final Project Part II
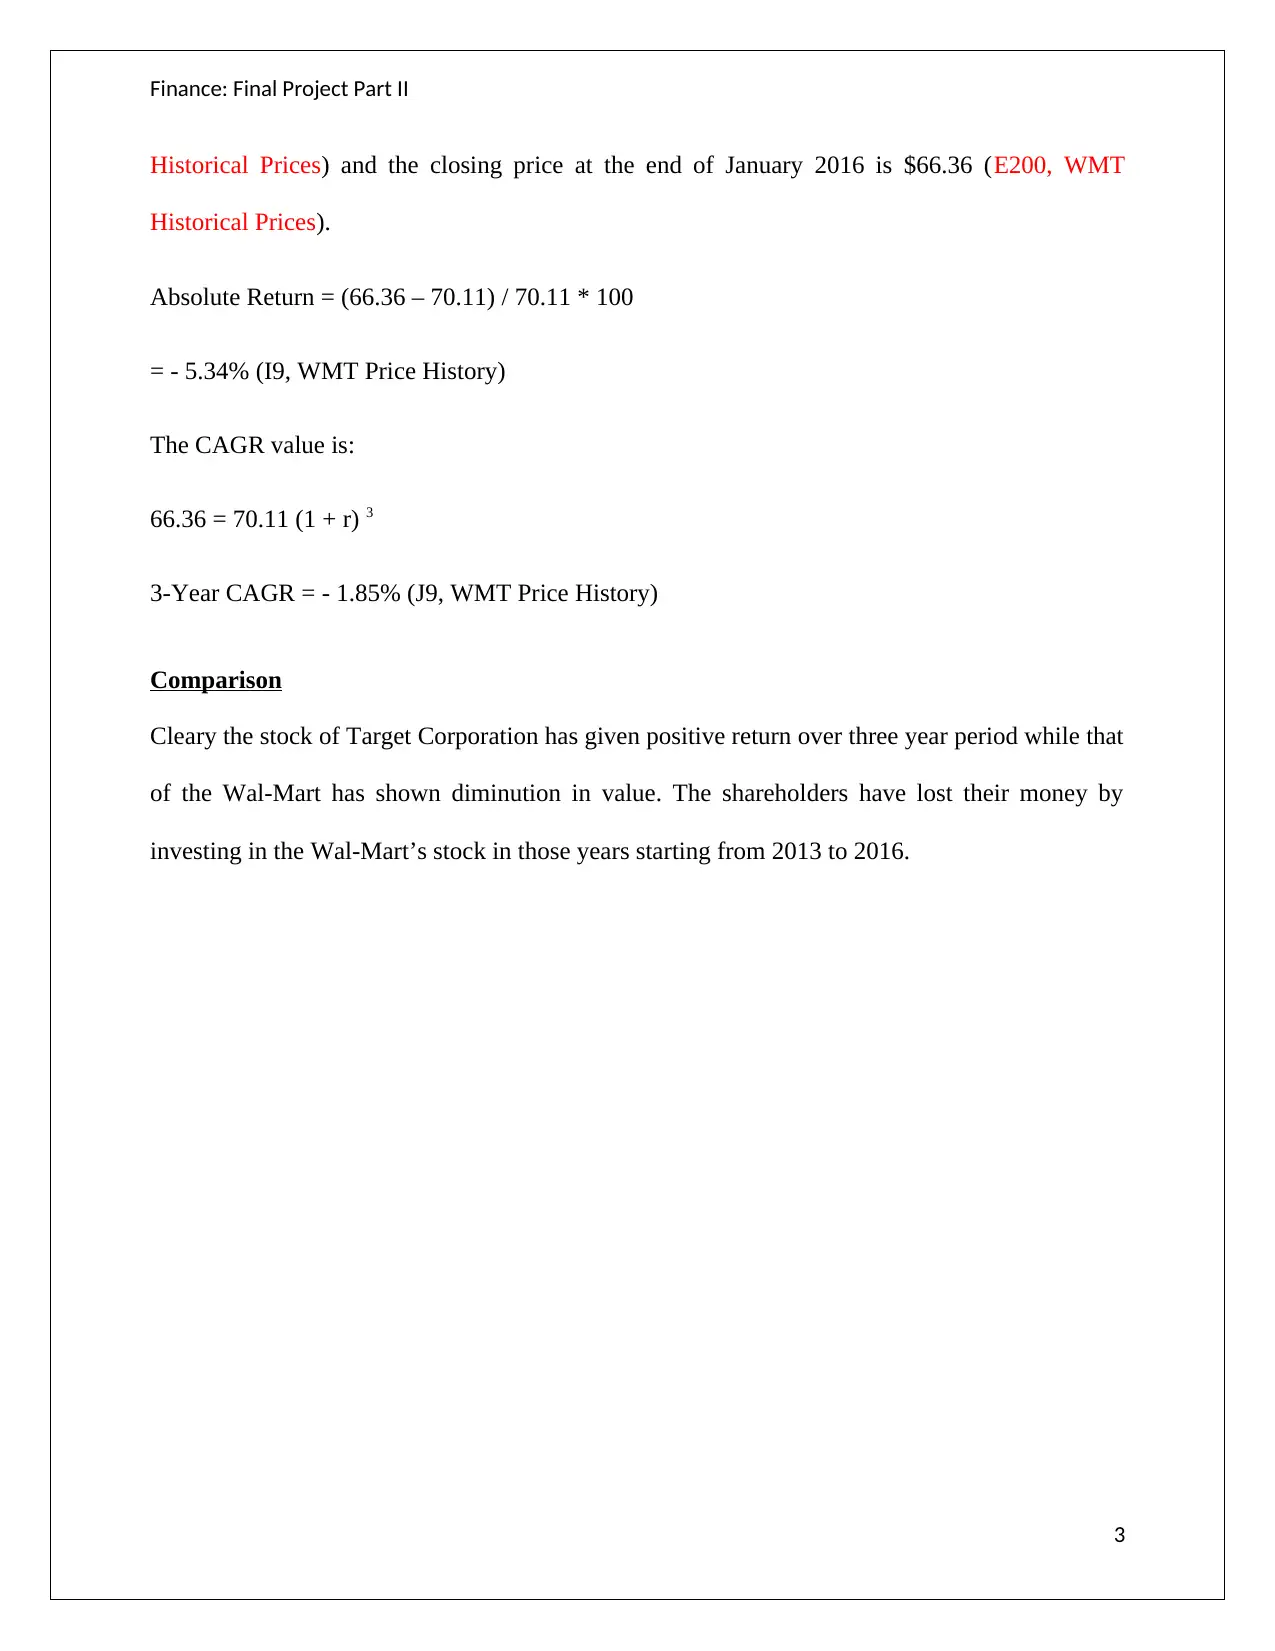
Historical Prices) and the closing price at the end of January 2016 is $66.36 (E200, WMT
Historical Prices).
Absolute Return = (66.36 – 70.11) / 70.11 * 100
= - 5.34% (I9, WMT Price History)
The CAGR value is:
66.36 = 70.11 (1 + r) 3
3-Year CAGR = - 1.85% (J9, WMT Price History)
Comparison
Cleary the stock of Target Corporation has given positive return over three year period while that
of the Wal-Mart has shown diminution in value. The shareholders have lost their money by
investing in the Wal-Mart’s stock in those years starting from 2013 to 2016.
3
Paraphrase This Document
Need a fresh take? Get an instant paraphrase of this document with our AI Paraphraser
Finance: Final Project Part II
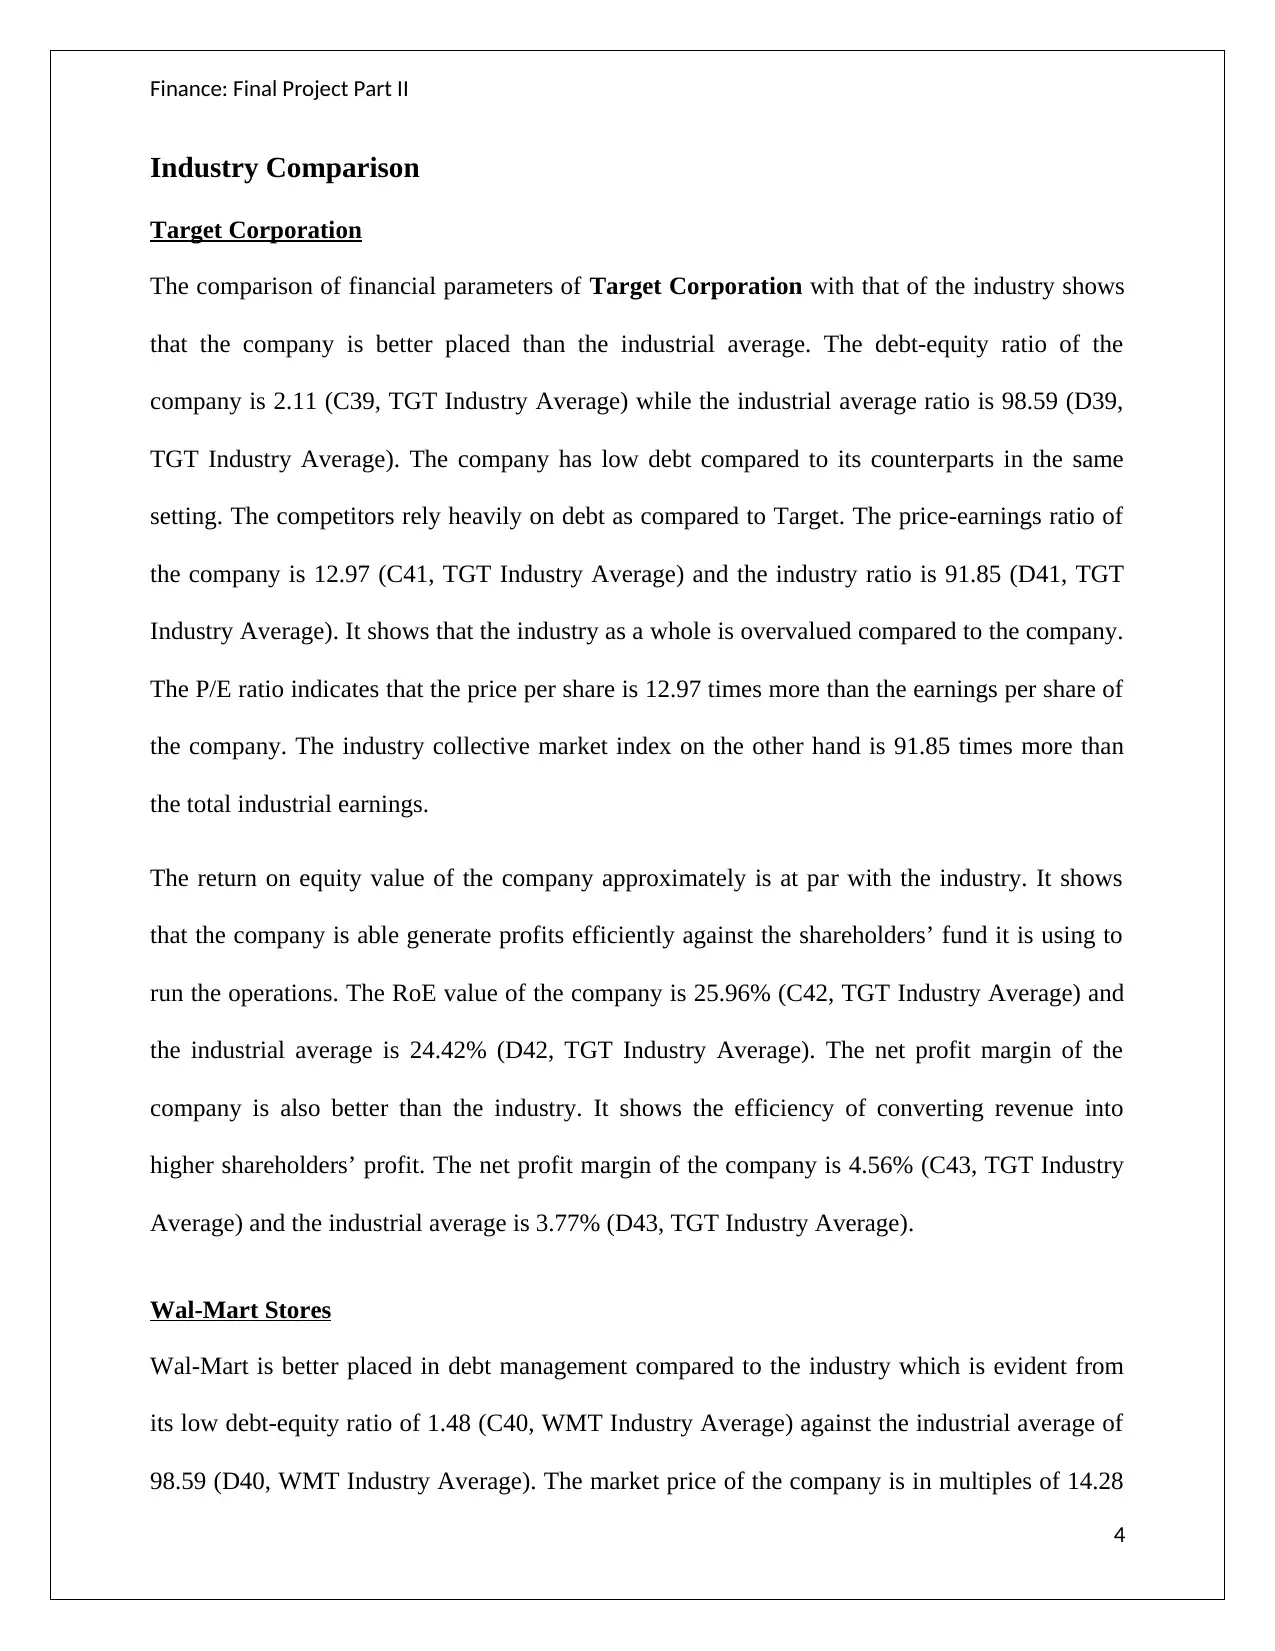
Industry Comparison
Target Corporation
The comparison of financial parameters of Target Corporation with that of the industry shows
that the company is better placed than the industrial average. The debt-equity ratio of the
company is 2.11 (C39, TGT Industry Average) while the industrial average ratio is 98.59 (D39,
TGT Industry Average). The company has low debt compared to its counterparts in the same
setting. The competitors rely heavily on debt as compared to Target. The price-earnings ratio of
the company is 12.97 (C41, TGT Industry Average) and the industry ratio is 91.85 (D41, TGT
Industry Average). It shows that the industry as a whole is overvalued compared to the company.
The P/E ratio indicates that the price per share is 12.97 times more than the earnings per share of
the company. The industry collective market index on the other hand is 91.85 times more than
the total industrial earnings.
The return on equity value of the company approximately is at par with the industry. It shows
that the company is able generate profits efficiently against the shareholders’ fund it is using to
run the operations. The RoE value of the company is 25.96% (C42, TGT Industry Average) and
the industrial average is 24.42% (D42, TGT Industry Average). The net profit margin of the
company is also better than the industry. It shows the efficiency of converting revenue into
higher shareholders’ profit. The net profit margin of the company is 4.56% (C43, TGT Industry
Average) and the industrial average is 3.77% (D43, TGT Industry Average).
Wal-Mart Stores
Wal-Mart is better placed in debt management compared to the industry which is evident from
its low debt-equity ratio of 1.48 (C40, WMT Industry Average) against the industrial average of
98.59 (D40, WMT Industry Average). The market price of the company is in multiples of 14.28
4
Finance: Final Project Part II
(C42, WMT Industry Average) to its earnings and the P/E ratio of the industry is 91.85 (D42,
WMT Industry Average) which proves that the company is undervalued.
The return on equity and the net profit margin of the company are worse than the industrial
average which shows that the company is not efficient in converting equity fund and revenue
into profits. The RoE value is 18.42% (C43, WMT Industry Average) and the net profit margin
is 3.05% (C44, WMT Industry Average) which are much lower than the industry values of
24.42% and 3.77% respectively (D43/D44, WMT Industry Average).
5
You're viewing a preview
Unlock full access by subscribing today!
Finance: Final Project Part II
Performance over Time
Target Corporation
Strengths
Consistent Free Cash Flows: Target Corporation was able to generate consistent free cash flows
during three years from 2014 to 2016. The free cash flow is the cash generated from operations
less the amount paid towards capital expenditure. Even though the net income in FY15 was
negative $1636 million (F35, TGT Income Statement), the FCF was positive $2.65 billion (N14,
TGT Cash Flow). The free cash that comes in from operations is actually used to pay the debt
and carry out expansion activities rather than operating profit because the latter also contains
payments which are yet to be received.
Positive Movement in Share Price: The share price of the company went up from $60.94 (B953,
TGT Historical Prices) to $72.42 (E200, TGT Historical Prices) in three years. It shows that the
shareholders are rewarded appropriately from the increasing operational value of the company
evident from consistently positive operating cash flows which has pulled the stock price up.
Better Profitability than the Industrial Average: The company has higher profit margin and return
on equity than the industrial average which shows that it has potential in rewarding shareholders
even in future unlike its competitors.
Weaknesses
High Leverage: Even though the debt-equity ratio of the company is below industry average, the
debt in the company is higher than its equity capital. Besides, the ratio has increased in three
years from 1.74 (O11, TGT Balance Sheet) to 2.11 (M11, TGT Balance Sheet). The high debt in
a company leads to higher interest cost and subdued profits.
6
Paraphrase This Document
Need a fresh take? Get an instant paraphrase of this document with our AI Paraphraser
Finance: Final Project Part II
Lower Overall Net Profitability: Although the Net Profit margins are higher than the industrial
average, they are not at par with other companies in different industries. The profit margins are
lower in a three year period from 2014 to 2016. The margin was 2.8% in 2014 and negative 2.3%
in 2015 (O/P18, TGT Income Statement). Investors who look for inter-industrial investment
opportunities will be reluctant to invest in Target Corporation.
Wal-Mart Stores
Strengths
Considerable Return on Equity: The Company generates enough profit on shareholders’ fund to
reward them appropriately. It shows that the company efficiently uses equity capital to generate
returns. The return on equity in 2016, 2015 and 2014 was 18.24%, 20.1% and 20.6%
respectively (M/N/O14, WMT Balance Sheet).
Consistent Free Cash Flows: The Company has generated increasing free cash flows over time.
The FCF value in 2014 was $10.14 billion, in 2015 it was $16.4 billion and in 2016 it is $15.91
billion (N/O/P14, WMT Cash Flow).
Too Big to Fail: Wal-Mart is a giant company with a market capitalization of $220.21 billion. Its
growth alone in 2004 was bigger than the total revenue of 469 of the Fortune 500 companies
(Fishman, 2006). It shows that the company has a strong advantage of economies of scale which
makes it a low price offeror of its products. The company will keep on generating free cash flows
in the future, albeit at a low rate.
Weaknesses
Low Profitability: The Company has low net profit margin compared to the industrial average.
The margins have been low even in 2014 and 2015 overall when compared to companies in other
7
Finance: Final Project Part II
industries. The profit margin in 2014, 2015 and 2016 was 3.4%, 3.4% and 3% respectively
(N/O/P18, WMT Income Statement).
High Leverage: Wal-Mart’s debt-equity ratio is above 1 in last three years. It shows that the
company is highly leveraged and relies more on debt fund than equity fund. The debt taken
beyond a certain limit can penalize the profits due to heavy interest costs (Lang et al., 1996). The
debt-equity ratio in 2014, 2015 and 2016 was 1.63, 1.50, and 1.48 respectively (M/N/O10, WMT
Balance Sheet).
Comparison
Wal-Mart is a larger company than Target Corporation based on market capitalization. The
capitalization of the former is $220.21 billion while that of that the latter is $43.5 billion. Due to
the huge size of Wal-Mart it generates more free cash flows than Target. The FCF value of Wal-
Mart in 2016 is little under $16 billion (N14, WMT Cash Flow) while that of Target is $4.44
billion (M14, WMT Cash Flow). However, Target has overtaken Wal-Mart in terms of
profitability only recently. The RoE and net profit margin of Target in 2016 are 25.96% (M15,
TGT Balance Sheet) and 4.6% (N18, TGT Income Statement) respectively while that of the Wal-
Mart are 18.24% (M14, WMT Balance Sheet) and 3% (N18, WMT Income Statement)
respectively. The RoE and net profit margin of Wal-Mart in 2014 were 20.6% (O14, WMT
Balance Sheet) and 3.4% (P18, WMT Income Statement) respectively while that of Target were
12.1% (O15, TGT Balance Sheet) and 2.8% (P18, TGT Income Statement). Thus, Target is
profitable than Wal-Mart now unlike in 2014. Same is the case with EPS figures of both the
companies. The EPS value of Wal-Mart in 2016 is $4.65 and in 2014 was $4.96 (N/P15, WMT
Income Statement) while that of Target in 2016 is $5.58 and in 2014 it was $3.12 (N/P15, TGT
Income Statement).
8
You're viewing a preview
Unlock full access by subscribing today!
Finance: Final Project Part II
Investment
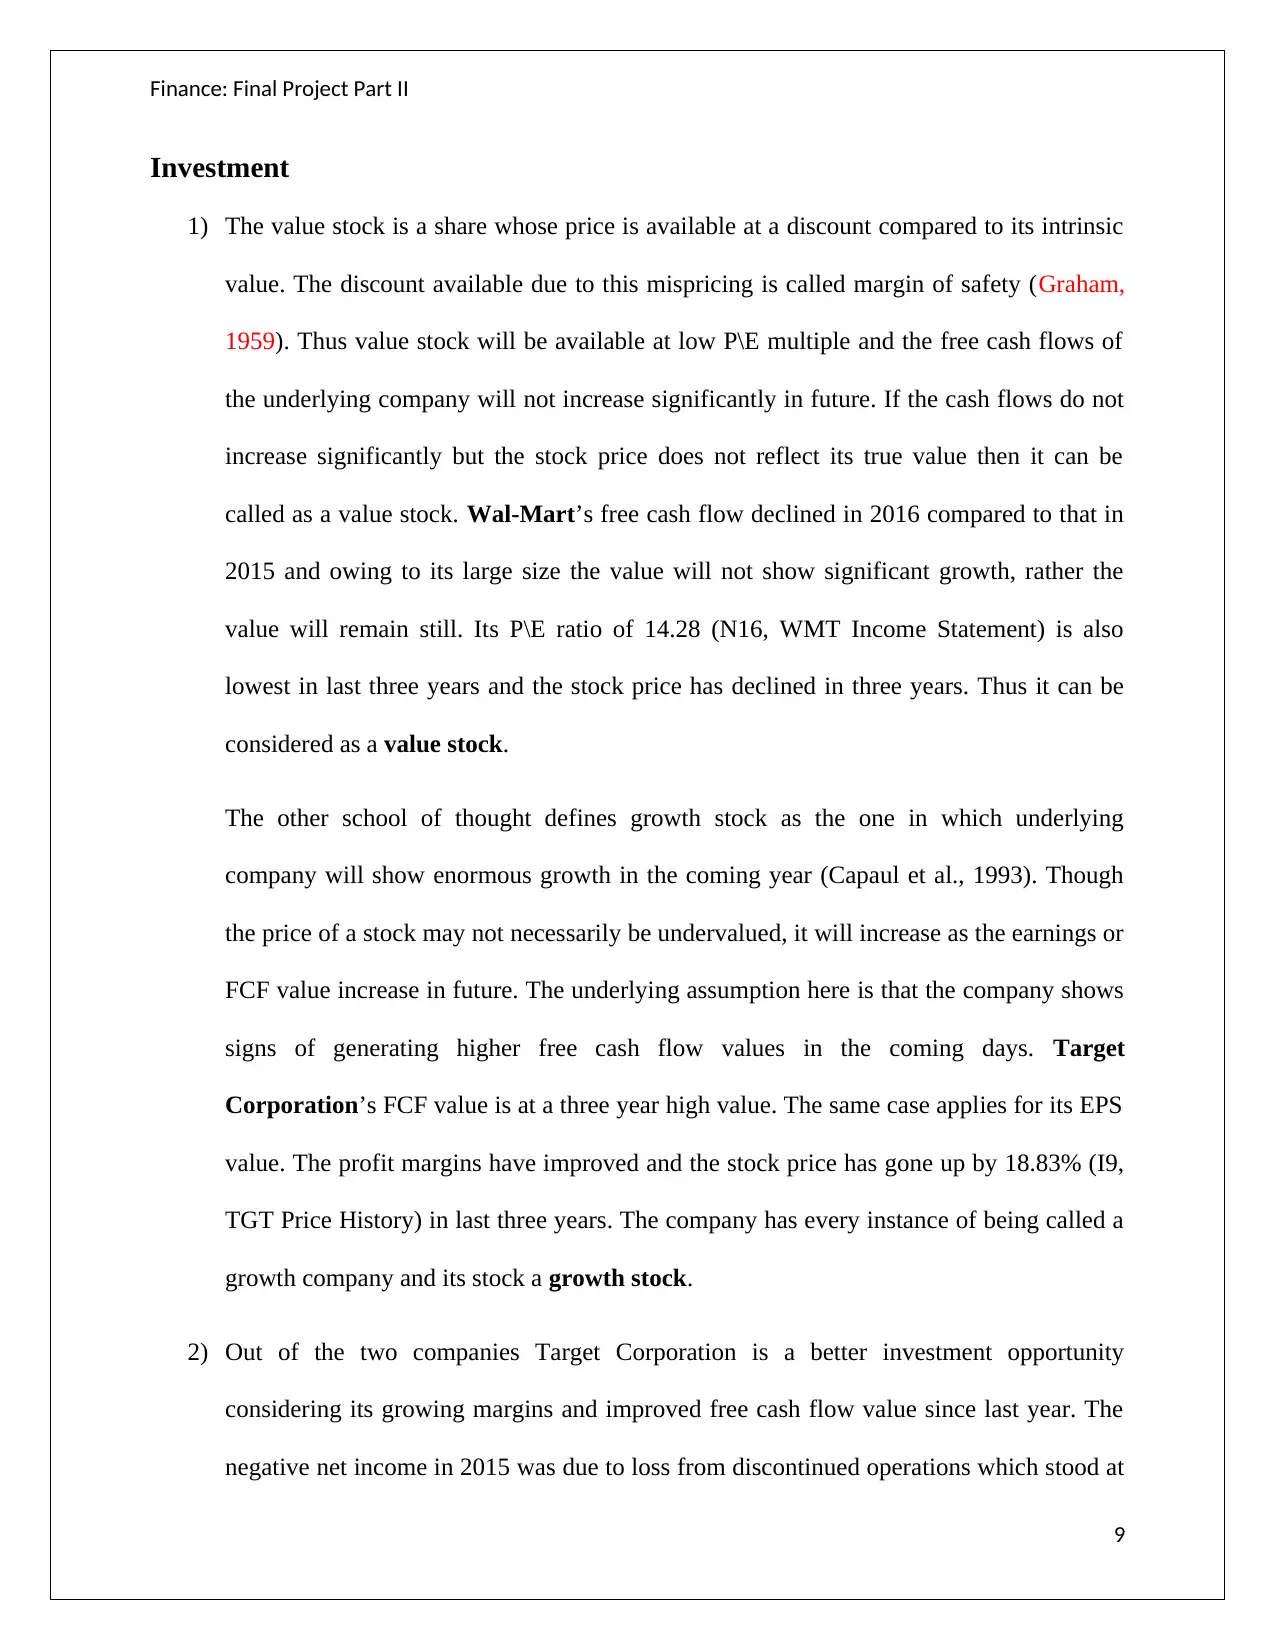
1) The value stock is a share whose price is available at a discount compared to its intrinsic
value. The discount available due to this mispricing is called margin of safety (Graham,
1959). Thus value stock will be available at low P\E multiple and the free cash flows of
the underlying company will not increase significantly in future. If the cash flows do not
increase significantly but the stock price does not reflect its true value then it can be
called as a value stock. Wal-Mart’s free cash flow declined in 2016 compared to that in
2015 and owing to its large size the value will not show significant growth, rather the
value will remain still. Its P\E ratio of 14.28 (N16, WMT Income Statement) is also
lowest in last three years and the stock price has declined in three years. Thus it can be
considered as a value stock.
The other school of thought defines growth stock as the one in which underlying
company will show enormous growth in the coming year (Capaul et al., 1993). Though
the price of a stock may not necessarily be undervalued, it will increase as the earnings or
FCF value increase in future. The underlying assumption here is that the company shows
signs of generating higher free cash flow values in the coming days. Target
Corporation’s FCF value is at a three year high value. The same case applies for its EPS
value. The profit margins have improved and the stock price has gone up by 18.83% (I9,
TGT Price History) in last three years. The company has every instance of being called a
growth company and its stock a growth stock.
2) Out of the two companies Target Corporation is a better investment opportunity
considering its growing margins and improved free cash flow value since last year. The
negative net income in 2015 was due to loss from discontinued operations which stood at
9
Investment
1) The value stock is a share whose price is available at a discount compared to its intrinsic
value. The discount available due to this mispricing is called margin of safety (Graham,
1959). Thus value stock will be available at low P\E multiple and the free cash flows of
the underlying company will not increase significantly in future. If the cash flows do not
increase significantly but the stock price does not reflect its true value then it can be
called as a value stock. Wal-Mart’s free cash flow declined in 2016 compared to that in
2015 and owing to its large size the value will not show significant growth, rather the
value will remain still. Its P\E ratio of 14.28 (N16, WMT Income Statement) is also
lowest in last three years and the stock price has declined in three years. Thus it can be
considered as a value stock.
The other school of thought defines growth stock as the one in which underlying
company will show enormous growth in the coming year (Capaul et al., 1993). Though
the price of a stock may not necessarily be undervalued, it will increase as the earnings or
FCF value increase in future. The underlying assumption here is that the company shows
signs of generating higher free cash flow values in the coming days. Target
Corporation’s FCF value is at a three year high value. The same case applies for its EPS
value. The profit margins have improved and the stock price has gone up by 18.83% (I9,
TGT Price History) in last three years. The company has every instance of being called a
growth company and its stock a growth stock.
2) Out of the two companies Target Corporation is a better investment opportunity
considering its growing margins and improved free cash flow value since last year. The
negative net income in 2015 was due to loss from discontinued operations which stood at
9
Paraphrase This Document
Need a fresh take? Get an instant paraphrase of this document with our AI Paraphraser
Finance: Final Project Part II
$4.085 billion (G30, TGT Income Statement). Though the amount is substantial, it is a
non-recurring event which is unlikely to occur in future because the operations cannot be
discontinued frequently. The free cash flow value will increase over time due to one-time
restructuring plan put in place to discontinue unwanted operations. It has decreased the
capital expenditure from $1.79 billion (G19, TGT Cash Flow) in 2015 to $1.44 billion
(F19, TGT Cash Flow) in 2016 which in turn has increased the free cash flow value. On
the other hand Wal-Mart generates huge free cash flows. But high agency cost is attached
with this phenomenon (Jensen, 1986) because of the conflicts arising between
management and shareholders regarding the allocation of capital.
10
Finance: Final Project Part II
References
Fishman, C. (2006). The Wal-Mart Effect: How the World's Most Powerful Company Really
Works--and How It's Transforming the American Economy. Penguin.
O'Shaughnessy, J. (2005). What Works on Wall Street: A Guide to the Best-Performing
Investment Strategies of All Time: A Guide to the Best-Performing Investment Strategies
of All Time. McGraw Hill Professional.
Capaul, C., Rowley, I., & Sharpe, W. F. (1993). International value and growth stock returns.
Financial Analysts Journal, 49(1), 27-36.
Graham, B. (1959). Intelligent Investor.
Lang, L., Ofek, E., & Stulz, R. (1996). Leverage, investment, and firm growth. Journal of
financial Economics, 40(1), 3-29.
Chan, E. (2009). Harvard Business School Confidential: Secrets of Success. John Wiley & Sons.
Jensen, M. C. (1986). Agency cost of free cash flow, corporate finance, and takeovers.
Corporate Finance, and Takeovers. American Economic Review, 76(2).
Yahoo Inc. (2016). Target Corporation (TGT): Stock Summary. Retrieved November 28, 2016,
from: https://finance.yahoo.com/quote/TGT?p=TGT
Yahoo Inc. (2016). Wal-Mart Stores Inc. (WMT): Stock Summary. Retrieved November 28,
2016, from: http://finance.yahoo.com/quote/WMT?p=WMT
Yahoo Inc. (2016). Wal-Mart Stores Inc. (WMT): Financials. Retrieved November 28, 2016,
from: http://finance.yahoo.com/quote/WMT/financials?p=WMT
11
You're viewing a preview
Unlock full access by subscribing today!
Finance: Final Project Part II
Yahoo Inc. (2016). Target Corporation (TGT): Financials. Retrieved November 28, 2016, from:
https://finance.yahoo.com/quote/TGT/financials?p=TGT
Yahoo Inc. (2016). Target Corporation (TGT): Price History. Retrieved November 28, 2016,
from: https://finance.yahoo.com/quote/TGT/history?p=TGT
Yahoo Inc. (2016). Wal-Mart Stores Inc. (WMT): Price History. Retrieved November 28, 2016,
from: http://finance.yahoo.com/quote/WMT/history?p=WMT
Yahoo Inc. (2016). Industry Browser - Services - Discount, Variety Stores - Company List.
Retrieved November 28, 2016, from: https://biz.yahoo.com/p/732conameu.html
12
1 out of 13
Your All-in-One AI-Powered Toolkit for Academic Success.
+13062052269
info@desklib.com
Available 24*7 on WhatsApp / Email
![[object Object]](/_next/static/media/star-bottom.7253800d.svg)
Unlock your academic potential
© 2024 | Zucol Services PVT LTD | All rights reserved.