Comprehensive Financial Analysis Report: MYEG Company Performance
VerifiedAdded on 2023/04/19
|21
|5025
|267
Report
AI Summary
This report presents a detailed financial analysis of MYEG Company, a Malaysian-based e-government services provider. The analysis includes a two-year comparison of the balance sheet and income statement, along with a comprehensive ratio analysis covering liquidity, activity, profitability, and coverage ratios. The report benchmarks MYEG against its peer group, POS Malaysia, and conducts a five-year trend analysis of key financial metrics. Furthermore, it provides recommendations for improving the company's financial performance, particularly in areas such as accounts receivable turnover and sales to fixed assets. The analysis incorporates definitions of key financial statement categories and concludes with a summary of findings and suggestions for future strategic decisions, offering valuable insights into MYEG's financial health and operational efficiency.

Running Head: FINANCE 0
Finance
Finance
Paraphrase This Document
Need a fresh take? Get an instant paraphrase of this document with our AI Paraphraser
FINANCE 1
Contents
Introduction......................................................................................................................................3
Detailed Ratio Analysis - Two-Year Comparison...........................................................................3
Liquidity Ratios...............................................................................................................................3
Current Ratio............................................................................................................................3
Quick Ratio...............................................................................................................................3
Activity Ratios.................................................................................................................................4
Accounts Receivable Turnover................................................................................................4
Accounts Payable Turnover Ratio............................................................................................4
Sales to Fixed Asset ratio.........................................................................................................5
Profitability Ratios...........................................................................................................................5
Gross Profit...............................................................................................................................5
Net Profit..................................................................................................................................5
Return on Assets.......................................................................................................................6
Return on Equity......................................................................................................................6
Coverage Ratios...............................................................................................................................6
Debt to Equity..........................................................................................................................6
Debt to total Asset....................................................................................................................7
Times Interest Coverage Ratio.................................................................................................7
FINANCE 2
Conclusions and Recommendations................................................................................................7
Definitions of the Categories belonging to the balance sheet and the Income Statement...............9
Income Statement.........................................................................................................................9
Balance sheet................................................................................................................................9
References......................................................................................................................................11
⊘ This is a preview!⊘
Do you want full access?
Subscribe today to unlock all pages.
Trusted by 1+ million students worldwide
FINANCE 3
Introduction
MYEG Company is the Malaysian based company having a business of the E-
government services or can also be found under the IT management sector of Malaysia. The
current revenue of the company is $371.22 million with the net profit of $201511. Current 40561
employees are working in this organization and tend to expand its business offshore as well
(Morning Star, 2018).
Financial Analysis is an important criterion for determining the strength and the
weakness of the company. This tool indicates both the positive as well as the negative aspects of
the financial statements and also reflects the areas where the management needs to work upon to
improve the areas of the weakness. The variances can also be found out with the help of the ratio
analysis technique which has been discussed below in this report (Vogel, 2014). This report has a
major outlook on the two year comparison of the balance sheet and the income statement of the
MYEG Company based in the Malaysia, the two year detailed ratio analysis, the comparison
against the industry and the peer group. For the peer group analysis the company taken is the
POS Malaysia. Apart from this the five year trend analysis of the balance sheet, income
statement and ratio analysis as well has been undertaken (Morning Star, 2018).
Detailed Ratio Analysis - Two-Year Comparison
Liquidity Ratios
Liquidity ratios are calculated with an intention to determine the company’s ability to
meet the short term obligations and short term requirements. Such ratio is calculated to match the
ability of the company to convert its assets into cash. Such ratios are very helpful for the
Paraphrase This Document
Need a fresh take? Get an instant paraphrase of this document with our AI Paraphraser
FINANCE 4
creditors as it helps them in finding out the ability of the company for the repayment of loans. It
also helps in predicting whether the company can meet the obligation for the money which was
being lent by the lenders of the company (Baker, Cummings & Jagtiani, 2017).
Current Ratio
One of the liquidity ratios is current ratio and it helps in a fair calculation of the
company’s ability to meet the short-term liabilities. It is a simple comparison of the company’s
current assets and current liabilities. If the result of the comparison indicates the higher number
than it is the indication that the company has a strong base to meet the short term obligations
The current ratio of the company for the year 2017 is 18.5 whereas in the year 2016
financial year is 10.97 indicates that the company is able to pay the obligations in comparison to
the previous year (Yahoo finance, 2018). The current ratio of the POS company is low with
respect to the MYEG thus it explains that the company is performing better than the POS and has
more scope of paying off the obligations as it has sufficient current assets as having by the POS
(Heikal, Khaddafi & Ummah, 2014).
Quick Ratio
It is a type of ratio where a quick comparison is done on the basis of cash in hand,
accounts receivables and marketable securities of the company against the current liabilities of
the company. The result is measured on the basis of a higher number which indicates the strong
position of the company to meet the short term obligations of the company (Saeidi, 2015).
The quick ratio of the MYEG is 5.088 in the previous year and 3.91 in the financial year
2017. The quick ratio has been decreased by 23% in comparison to the previous year. The above
ratio indicates that the company ability to serve the obligations of the short term nature has been
FINANCE 5
reduced and deteriorated (Morning Star, 2018). The Quick ratio on the other hand is more of the
POS Company than MYEG which suggest that though the current assets are sufficient to pay
back the current liabilities yet the cash is generated at the faster pace in case of POS (Nobanee &
Al Hajjar, 2014).
Activity Ratios
An activity ratio generally reflects the ability of the company to reflect the ability and the
power of the company to convert various accounts into the financial statements of the company
in the form of cash or sales (Cable, Healy & Sun, 2018).
Accounts Receivable Turnover
Accounts Receivable Turnover ratio is the key driver that lets the management know
about the dependency of the working capital of the company upon the accounts receivable of the
company. The result is measured on the basis of indication in the numbers if such ratio indicates
a lower number than the working capital of the company is adequate which shows lesser risks of
the business (Bergeron, 2017).
The accounts receivable ratio of the company is 71 days and 76 days from the year 2016 to
2017. Thee inventory turnover ratio of the company is nil as the company has not maintained any
inventory. The sales to fixed assets of the company have decreased from 1.03 to 0.74 from 2016
to 2017 (Morning Star, 2018). There are several suggestions to improve the receivable ratio as
well as the day’s sales in the receivables ratio. The AR ratio in terms of the industry comparison
is 82.25 and whereas the ratio of the MYEG is 76.5 in the year 2017 which is again the positive
impact however to reach to the position of the 2015 at 63.1 there are following recommendations
outlined below (Weygandt, Kimmel & Kieso, 2015).
⊘ This is a preview!⊘
Do you want full access?
Subscribe today to unlock all pages.
Trusted by 1+ million students worldwide
FINANCE 6
The company can start by preparing the aging schedules to interpret for how much time
the receivables are outstanding. The policy of the review can be seen on the constant
basis to identify for the patterns in the delinquent accounts (Flammer, 2015).
Developing a strategy to identify the weak customers and the delinquent accounts can be
one of the policies to improve the performance of the customers (Aldivitto & Rahman,
2016).
Accounts Payable Turnover Ratio
The payable ratio is the ratio which is used to measure the short-term liquidity of the
company. Such ratio is calculated by having a basic comparison between the total purchase from
the supplier or cost of goods sold and the average accounts payable of the company for the
particular period (Mathuva, 2015).
Under this ratio it can be observed that the accounts payable turnover ratio has been
changed drastically over the period of five years as it can be seen form the five year trend
analysis. The ratio reached 7 from 20 as it was in the year 2013. The ratio also helps to deliver
the information about the number of days in which the payment shall be made. The company has
improved the ratio and thereby it is a positive indication from the analysis. In terms of the
industry comparison the ratio has been more favourable on the side of the company whereas the
ratio of the industry is 4.33. Therefore the company is performing better than other companies
(Ukaegbu, 2014).
Sales to Fixed Asset ratio
It is a type of ratio which helps in calculating the general performance of the company. Such
type of ratios is calculated with an intention to measure the ability of the company to generate
Paraphrase This Document
Need a fresh take? Get an instant paraphrase of this document with our AI Paraphraser
FINANCE 7
sales from the fixed assets of the company. The result of such ratios are measured in numbers,
the higher the numbers of such ratio the higher will be efficiency of the company to utilize the
fixed assets of the company (Yahoo finance, 2018). The sale to fixed asset ratio is better of the
POS Company as it can be observed by the comparison table and moreover there are several
recommendations in regards to the sales to fixed asset ratio which can be improved if these
suggestions are followed subsequently by MYEG Company (Hanson, Shleifer Stein & Vishny,
2015).
Instead of purchasing the assets the assets shall be acquired on lease and the
The identification of the assets to determine the assets that are directly affecting the sales
of the assets can be classified easily.
The detailed records of the assets which can classify which whether the current assets are
on lease or purchase (Arnold, Hackbarth & Xenia Puhan, 2017).
Profitability Ratios
It is a ratio which is used to calculate the capacity of the company to generate profits
against the expenses of the company. The result of such ratio is measured in numbers, the higher
the numbers the higher will be the profitability of the company (Laitinen & Laitinen, 2018).
sales from the fixed assets of the company. The result of such ratios are measured in numbers,
the higher the numbers of such ratio the higher will be efficiency of the company to utilize the
fixed assets of the company (Yahoo finance, 2018). The sale to fixed asset ratio is better of the
POS Company as it can be observed by the comparison table and moreover there are several
recommendations in regards to the sales to fixed asset ratio which can be improved if these
suggestions are followed subsequently by MYEG Company (Hanson, Shleifer Stein & Vishny,
2015).
Instead of purchasing the assets the assets shall be acquired on lease and the
The identification of the assets to determine the assets that are directly affecting the sales
of the assets can be classified easily.
The detailed records of the assets which can classify which whether the current assets are
on lease or purchase (Arnold, Hackbarth & Xenia Puhan, 2017).
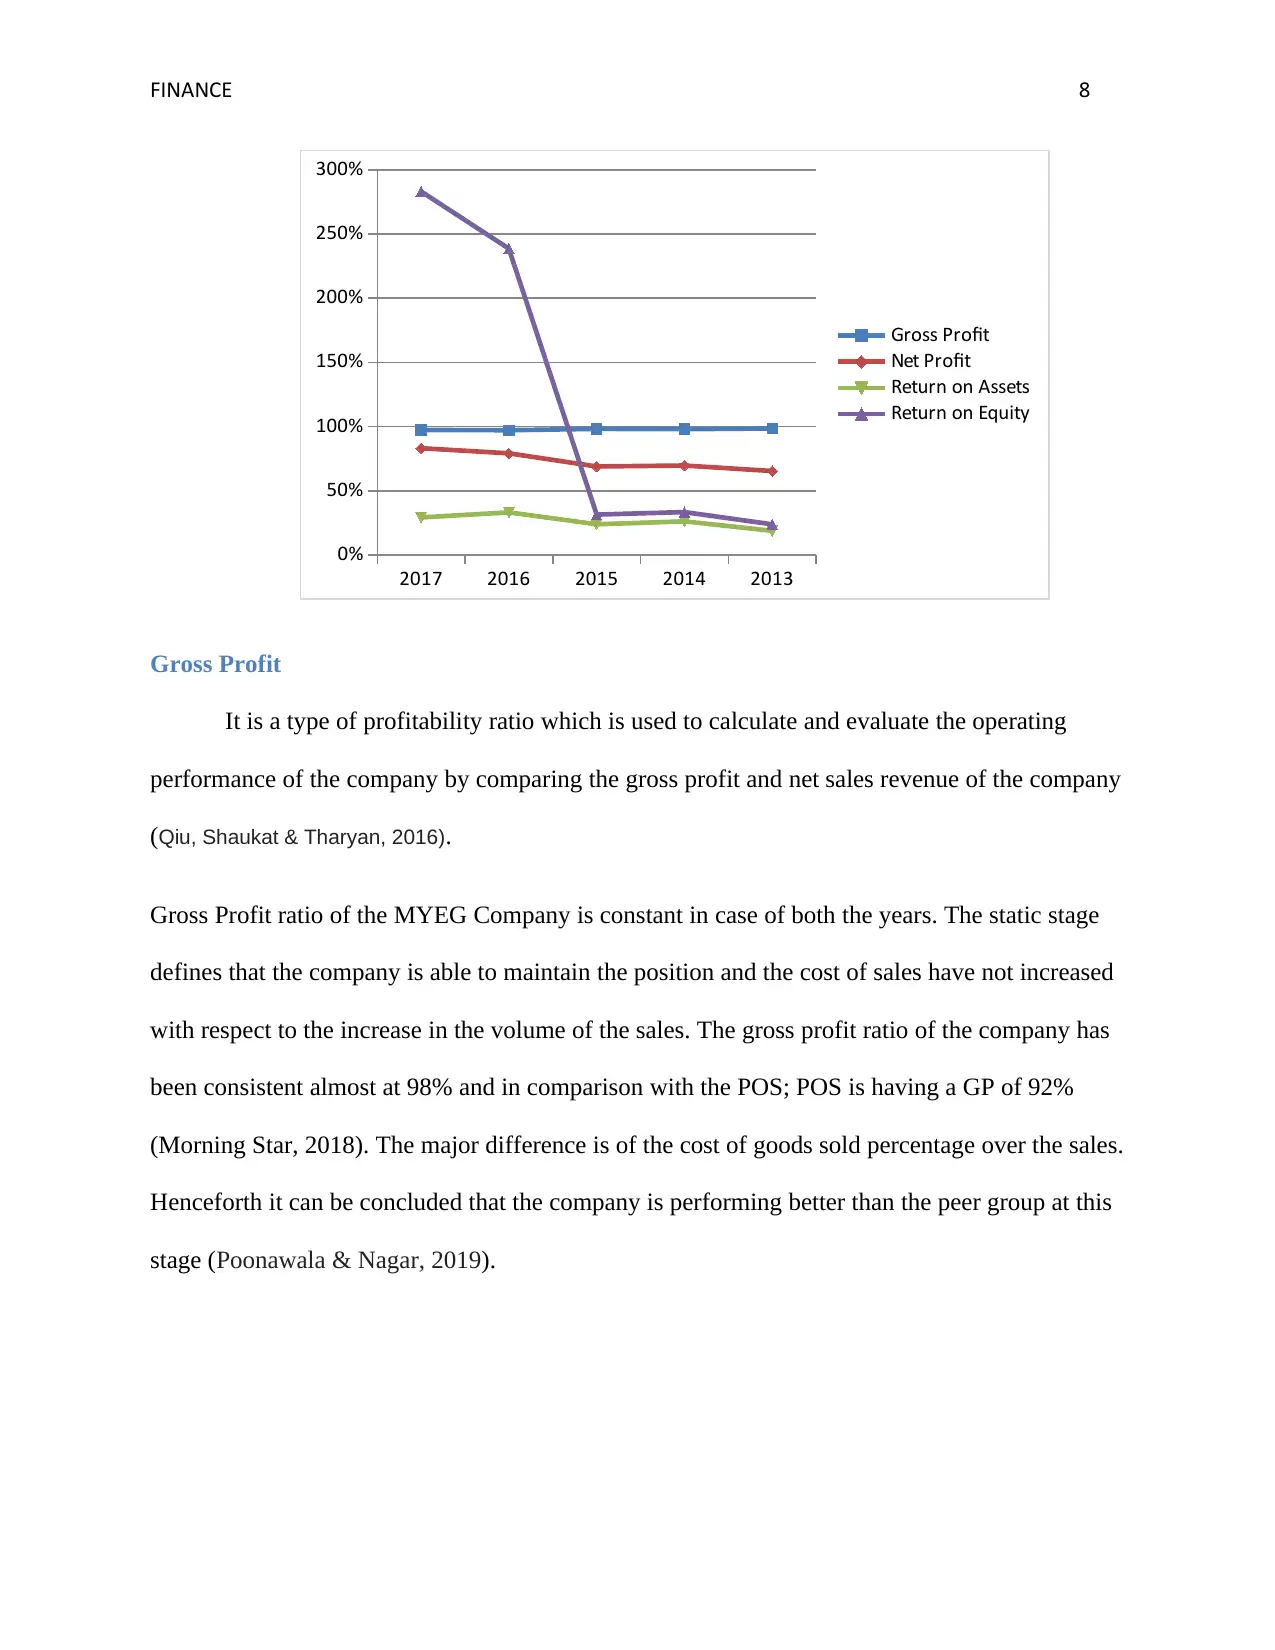
Profitability Ratios
It is a ratio which is used to calculate the capacity of the company to generate profits
against the expenses of the company. The result of such ratio is measured in numbers, the higher
the numbers the higher will be the profitability of the company (Laitinen & Laitinen, 2018).
FINANCE 8
2017 2016 2015 2014 2013
0%
50%
100%
150%
200%
250%
300%
Gross Profit
Net Profit
Return on Assets
Return on Equity
Gross Profit
It is a type of profitability ratio which is used to calculate and evaluate the operating
performance of the company by comparing the gross profit and net sales revenue of the company
(Qiu, Shaukat & Tharyan, 2016).
Gross Profit ratio of the MYEG Company is constant in case of both the years. The static stage
defines that the company is able to maintain the position and the cost of sales have not increased
with respect to the increase in the volume of the sales. The gross profit ratio of the company has
been consistent almost at 98% and in comparison with the POS; POS is having a GP of 92%
(Morning Star, 2018). The major difference is of the cost of goods sold percentage over the sales.
Henceforth it can be concluded that the company is performing better than the peer group at this
stage (Poonawala & Nagar, 2019).
⊘ This is a preview!⊘
Do you want full access?
Subscribe today to unlock all pages.
Trusted by 1+ million students worldwide
FINANCE 9
Net Profit
The net profit of the company is calculated on the basis of the net sales of the company.
The net profit reveals the deep comparison between the net profit after tax and net sales of the
company (Epstein, Buhovac & Yuthas, 2015).
The net profit of the company has increased by 5% and it is a green sign that the
company is improving its performance with respect to the previous year. The net profit is the
core value of which determines the ability of the company to sustain for the longer duration. The
net profit of MYEG over the period of five years have been increased and improved efficiently
from 65% to 83%, whereas in comparison to the peer group and industry, it is 12% more than the
peer group and in case of industry it is 10% less overall (Căpraru & Ihnatov, 2014).
Therefore it can be said that though the ratio is better than the POS yet to survive against
the rest of the competitors the company needs to work upon the strategies to improve the same
(Ashraf Rizwan & L’Huillier, 2016).
Return on Assets
It is a type of an indicator which is used to calculate the profitability of the company in
relation to the total assets of the company. Such ratio helps in analysing the efficiency of the
management of the business organisation to generate profitability (Idawati & Wahyudi, 2015).
The return on assets of the company has been decreased from 33% to 29% from 2016 to
2017 which reflects a downfall of the 11% (Yahoo finance, 2018). The low return on assets
indicates that the assets that the company owns is not of the enough value and are failing to
generate the value of the company. Henceforth it is advised that the company shall focus on
getting rid of the obsolete assets to improve the productivity of the business. The negotiation
Paraphrase This Document
Need a fresh take? Get an instant paraphrase of this document with our AI Paraphraser
FINANCE 10
with the vendors shall be also one of the most important steps to lower down the basic costs and
ensures the high bid capacity of the company in the future capital expenditure. The liquidation of
the underutilized assets is again the favorable option to increase the profitability ratios of the
company (Agha, 2014).
Return on Equity
Return on Equity is a ratio which calculated to measure the financial performance of the
business organisation. Such ratio is calculated with an intention to measure the ability of the
business organisation to generate profits from the investments made by the investors of the
company
Return on equity on the other hand increased by 19% as can be observed from table and
therefore it a plus point for the company still there are certain ways through which the company
can improve the profitability ratios. The return on equity is 25% less in case of POS and in case
of the industry it is low by almost 30% (Anwar, Fathoni & Gagah, 2018).
Coverage Ratios
Coverage ratios are generally calculated to measure the ability of the company to service
the debt of the company and to meet the financial obligation of the company. The coverage ratio
forms the category of the debt to equity, debt to total assets and interest coverage ratio (Gozzi &
Schmukler, 2015).
Debt to Equity
Such ratios are calculated on the basis of the figures which are allocated on the balance
sheet of the company. Such ratios are calculated by comparing total liabilities and the
shareholders equity of the company (Schneider, 2015).
FINANCE 11
The debt to equity ratio of MYEG have been increased by 4% ensuring the debentures
have been financed more in comparison to the previous year to avail the benefit of the tax
advantage. The ratio increased from 0.18 to 0.19 and therefore the firm feels secure towards the
debentures (Coleman, Cotei & Farhat, 2016).
Debt to total Asset
It is a leverage ratio which is calculated to measure the total amount of debt in relation to
the assets of the company. Therefore this ratio explains the proportion of debt with the total
assets acquired by the company (Reid, 2018).
The debt to total asset ratio of MYEG has also increased by 6% in comparison to the
previous year from 2016 to 2017 and can happily sustain with the fact that the company has the
strong capital structure and financing through the right ways (Bradley & Roberts, 2015). The
debt to total asset of the company was consistent over the period of five years at 0.16 (Morning
Star, 2018).
Times Interest Coverage Ratio
This type of ratio is a measure which is used to calculate the interest paying capacity of
the company on the amount of outstanding debt of the company (Cheng, et al 2016).
The times interest coverage ratio of the company has fallen drastically from 75 to 53
times. Therefore it can be inferred that the company is not having the enough capacity to pay
back the interest expense and the company’s interest coverage is not sure and enough from the
point of view of the company coverage. The interest coverage ratio is better in case of POS and
in case of the industry as well (Du, Tepper & Verdelhan, 2018).
The following steps can be covered and instilled to improve the coverage ratios of the company.
⊘ This is a preview!⊘
Do you want full access?
Subscribe today to unlock all pages.
Trusted by 1+ million students worldwide
1 out of 21
Related Documents


Your All-in-One AI-Powered Toolkit for Academic Success.
+13062052269
info@desklib.com
Available 24*7 on WhatsApp / Email
![[object Object]](/_next/static/media/star-bottom.7253800d.svg)
Unlock your academic potential
Copyright © 2020–2026 A2Z Services. All Rights Reserved. Developed and managed by ZUCOL.