Optimal Management of Fixed Assets
15 Pages3311 Words300 Views
Added on 2020-05-16
About This Document
Running Head: Finance Finance 2 Managerial Finance Introduction: 3 Part A 4 Initial Investment: 4 Operating Cash Inflows: 5 Terminal Cash Flows: 6 Part B 7 Relevant Cash Flow Stream: 7 Part C: 9 Payback Period: 9 Net present Value: 10 Internal rate of Return: 11 Part D: 12 Graphical Presentation 12 The IRR graph: 12 The NPV graph: 13 Part E: 13 Ranking of the projects (Unlimited Funds) 13 Recommendation (Capital Rationing
Optimal Management of Fixed Assets
Added on 2020-05-16
ShareRelated Documents
Running Head: FinanceManagerial Finance
Finance2Table of ContentsIntroduction:..........................................................................................................................................3Part A....................................................................................................................................................4Initial Investment:..............................................................................................................................4Operating Cash Inflows:....................................................................................................................5Terminal Cash Flows:........................................................................................................................6Part B.....................................................................................................................................................7Relevant Cash Flow Stream:..............................................................................................................7Part C:...................................................................................................................................................9Payback Period:.................................................................................................................................9Net present Value:...........................................................................................................................10Internal rate of Return:....................................................................................................................11Part D:.................................................................................................................................................12Graphical Presentation.....................................................................................................................12The IRR graph:............................................................................................................................12The NPV graph:...........................................................................................................................13Part E:..................................................................................................................................................13Ranking of the projects (Unlimited Funds)......................................................................................13Recommendation (Capital Rationing):............................................................................................14Part F...................................................................................................................................................14Impact on Recommendation:...........................................................................................................14References:..........................................................................................................................................15
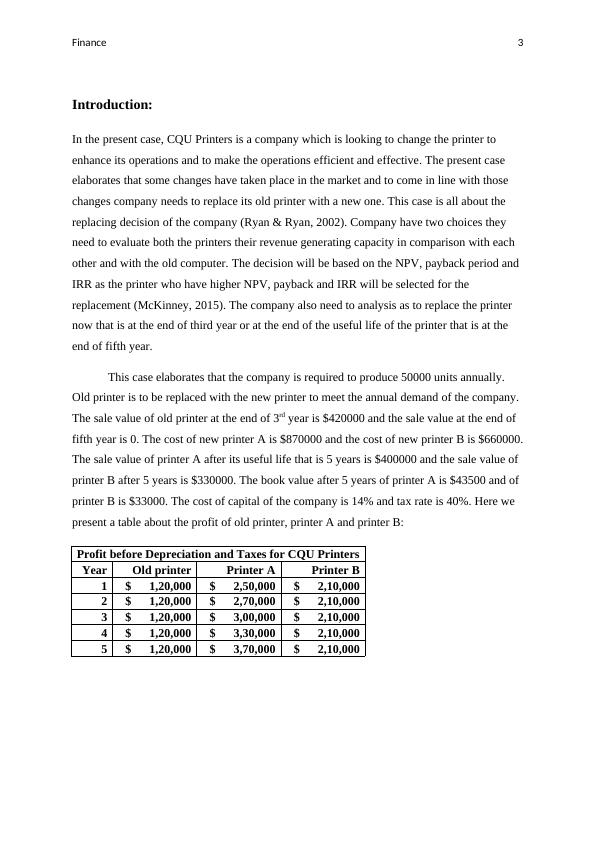
Finance3Introduction:In the present case, CQU Printers is a company which is looking to change the printer to enhance its operations and to make the operations efficient and effective. The present case elaborates that some changes have taken place in the market and to come in line with those changes company needs to replace its old printer with a new one. This case is all about the replacing decision of the company (Ryan & Ryan, 2002). Company have two choices they need to evaluate both the printers their revenue generating capacity in comparison with each other and with the old computer. The decision will be based on the NPV, payback period and IRR as the printer who have higher NPV, payback and IRR will be selected for the replacement (McKinney, 2015). The company also need to analysis as to replace the printer now that is at the end of third year or at the end of the useful life of the printer that is at the end of fifth year.This case elaborates that the company is required to produce 50000 units annually. Old printer is to be replaced with the new printer to meet the annual demand of the company. The sale value of old printer at the end of 3rd year is $420000 and the sale value at the end of fifth year is 0. The cost of new printer A is $870000 and the cost of new printer B is $660000.The sale value of printer A after its useful life that is 5 years is $400000 and the sale value of printer B after 5 years is $330000. The book value after 5 years of printer A is $43500 and of printer B is $33000. The cost of capital of the company is 14% and tax rate is 40%. Here we present a table about the profit of old printer, printer A and printer B:Profit before Depreciation and Taxes for CQU Printers Year Old printer Printer A Printer B 1 $ 1,20,000 $ 2,50,000 $ 2,10,000 2 $ 1,20,000 $ 2,70,000 $ 2,10,000 3 $ 1,20,000 $ 3,00,000 $ 2,10,000 4 $ 1,20,000 $ 3,30,000 $ 2,10,000 5 $ 1,20,000 $ 3,70,000 $ 2,10,000
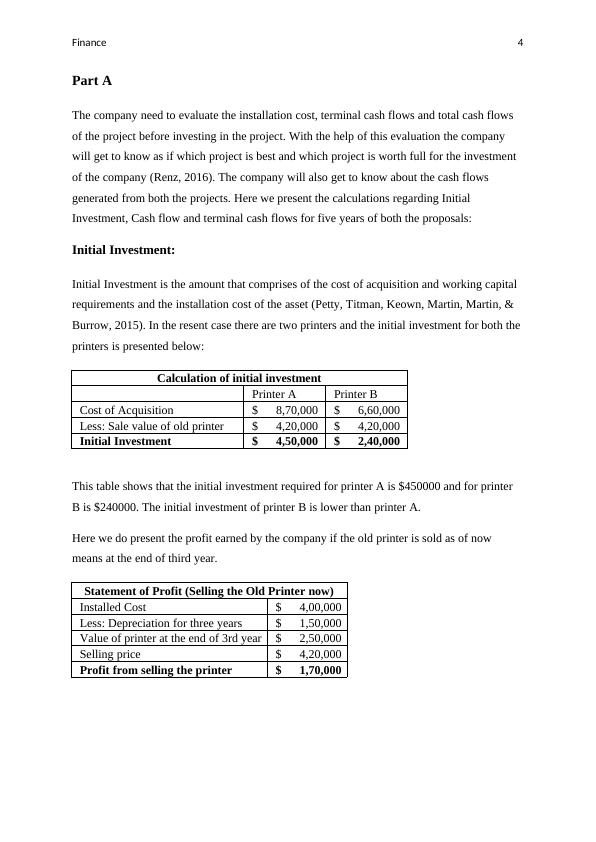
Finance4Part AThe company need to evaluate the installation cost, terminal cash flows and total cash flows of the project before investing in the project. With the help of this evaluation the company will get to know as if which project is best and which project is worth full for the investment of the company (Renz, 2016). The company will also get to know about the cash flows generated from both the projects. Here we present the calculations regarding Initial Investment, Cash flow and terminal cash flows for five years of both the proposals:Initial Investment:Initial Investment is the amount that comprises of the cost of acquisition and working capital requirements and the installation cost of the asset (Petty, Titman, Keown, Martin, Martin, & Burrow, 2015). In the resent case there are two printers and the initial investment for both theprinters is presented below:Calculation of initial investment Printer A Printer B Cost of Acquisition $ 8,70,000 $ 6,60,000 Less: Sale value of old printer $ 4,20,000 $ 4,20,000 Initial Investment $ 4,50,000 $ 2,40,000This table shows that the initial investment required for printer A is $450000 and for printer B is $240000. The initial investment of printer B is lower than printer A. Here we do present the profit earned by the company if the old printer is sold as of now means at the end of third year.Statement of Profit (Selling the Old Printer now) Installed Cost $ 4,00,000 Less: Depreciation for three years $ 1,50,000 Value of printer at the end of 3rd year $ 2,50,000 Selling price $ 4,20,000 Profit from selling the printer $ 1,70,000
End of preview
Want to access all the pages? Upload your documents or become a member.
Related Documents
Finance Assignment Project Reportlg...
|21
|3472
|44
Capital Budgeting Assignment | Accounting Assignmentlg...
|18
|3534
|57
Study on Appraisal of Capital Investmentslg...
|23
|3336
|151
FINC20018 Report on Finance - CQU printerslg...
|16
|2560
|62
Managerial Finance: Feasibility Analysis of Manufacturing Plant for Dell Inclg...
|10
|1209
|277
Finance: Appraisal of Capital Investment Decisionslg...
|7
|1628
|189