Finance 3 Accounting and Finance Part 1 Telstra Corporation Limited
31 Pages8412 Words67 Views
Added on 2021-06-17
About This Document
The company deals in developing telecommunication networks and offering product and services which includes fixed line and mobile telephony, data services, internet and other network services. 17.4 million mobile services; 6.8 million fixed voice services and 3.5 million retail fixed broadband services to its customers worldwide (Telstra.
Finance 3 Accounting and Finance Part 1 Telstra Corporation Limited
Added on 2021-06-17
ShareRelated Documents
RUNNING HEAD: FINANCE
Management accounting and Finance
Management accounting and Finance
Finance
2
Part 1
Telstra Corporation Limited is an Australia based telecommunications and technology
company having its headquarters situated at Melbourne. The company deals in developing
telecommunication networks and offering product and services which includes fixed line and
mobile telephony, data services, internet and other network services. Telstra provides approx.
17.4 million mobile services; 6.8 million fixed voice services and 3.5 million retail fixed
broadband services to its customers worldwide (Telstra. 2018).
Company has a vision and mission of connecting more and more people with offering more
opportunities to them. In order to accomplish this, Telstra focuses on using simple and easy
technology and solutions that are easily accessible to its users. It also focuses on becoming
the largest national mobile network of Australia (Reuters. 2018).
As of 2017, the company has earned a net profit of $3874 million. Telstra Corporation is
listed on Australian Stock Exchange (ASX) with a ticker symbol of ASX: TLS. The company
is now focused on expanding its operations in the international markets and looking forward
for its successful growth in future (Bloomberg. 2018).
Financial analysis is the process of measuring the performance of a company in terms of its
profitability, capital structure, efficiency and liquidity. The analysis includes a critical
examination of the financial statements prepared by an enterprise at the end of every fiscal
year. On the basis of the evaluation, decisions related to that company are been taken by
investors and other key people. The information presented in the statements is used for the
analysis and the same is been compared with the industry average or over the years (Lee, Lee
and Lee, 2009)
However, there are various tools used for conducting a financial analysis. Among the various
available techniques, the most commonly used is the ratio analysis. This technique involves
Finance
3
the calculation of different categorized ratios which determine and measure the financial
performance of a company from every aspect. Most of the investors rely on the key ratios
which provide a snapshot of the company’s financial position. On the basis of this ratio they
take their decisions regarding making investment in the particular company. The ratios are
also very useful for the shareholders of the company as by correctly interpreting them, they
can understand what is the company doing with their investment plus how it is using it and
how much return is been available to them (Vogel, 2014).
Following are the ratios calculated for Telstra Corporation Limited to evaluate its
performance over the years 2016 and 2017.
1. Operating profit margin ratio
Operating profit or Earnings before Interest and Tax is that portion of revenue which is left
after paying all the cost of goods sold and the operating expenses. The amount is expressed as
a percentage of total sales and is used for measuring the profitability of the company (Tracy,
2012). The OPR of Telstra is represented below.
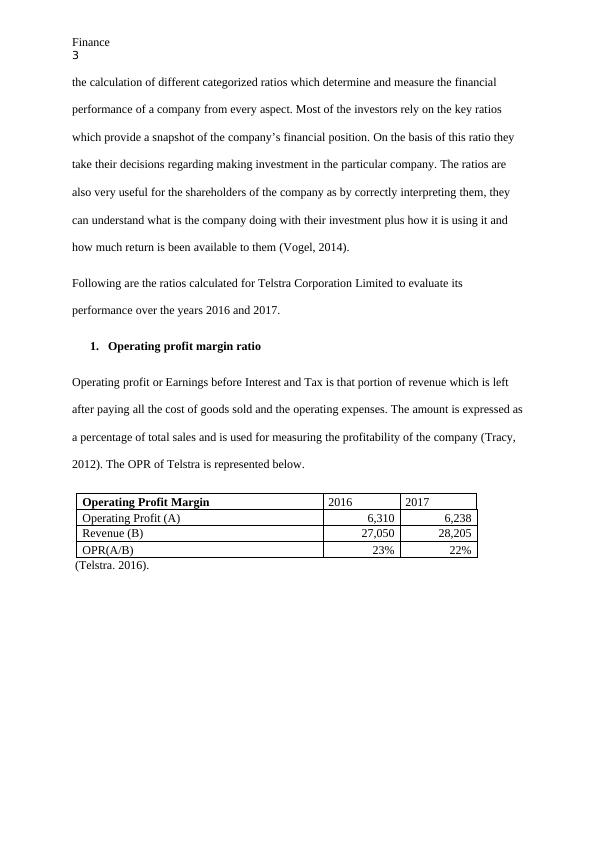
Operating Profit Margin 2016 2017
Operating Profit (A) 6,310 6,238
Revenue (B) 27,050 28,205
OPR(A/B) 23% 22%
(Telstra. 2016).
3
the calculation of different categorized ratios which determine and measure the financial
performance of a company from every aspect. Most of the investors rely on the key ratios
which provide a snapshot of the company’s financial position. On the basis of this ratio they
take their decisions regarding making investment in the particular company. The ratios are
also very useful for the shareholders of the company as by correctly interpreting them, they
can understand what is the company doing with their investment plus how it is using it and
how much return is been available to them (Vogel, 2014).
Following are the ratios calculated for Telstra Corporation Limited to evaluate its
performance over the years 2016 and 2017.
1. Operating profit margin ratio
Operating profit or Earnings before Interest and Tax is that portion of revenue which is left
after paying all the cost of goods sold and the operating expenses. The amount is expressed as
a percentage of total sales and is used for measuring the profitability of the company (Tracy,
2012). The OPR of Telstra is represented below.
Operating Profit Margin 2016 2017
Operating Profit (A) 6,310 6,238
Revenue (B) 27,050 28,205
OPR(A/B) 23% 22%
(Telstra. 2016).
Finance
4
2016 2017
0.2
0.22
0.24
Operating profit ratio
Operating Profit Margin
Years
%
The above graph shows the graphical representation of Telstra’s operating profit margin for
the past two year that are 2016 and 2017. It can be observed from the graph that the company
has a ratio of 23% in 2016 and the same reduces to 22% in 2017. This is because of the
overall reduction in the EBIT of Telstra from $6310 million to $6238 million. However, the
change is minor and has not impacted the profitability of Telstra to a great extent. Also, the
organization’s net profit has risen in the year 2017.
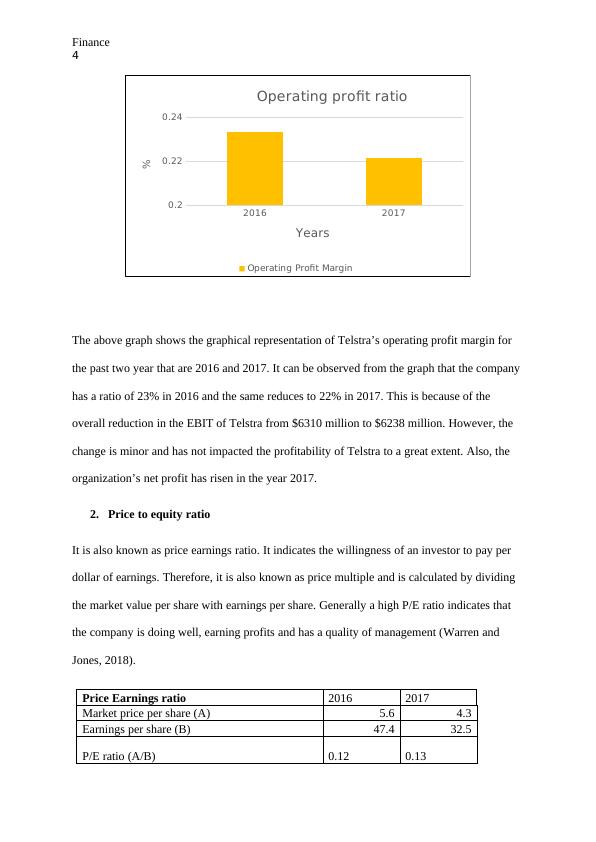
2. Price to equity ratio
It is also known as price earnings ratio. It indicates the willingness of an investor to pay per
dollar of earnings. Therefore, it is also known as price multiple and is calculated by dividing
the market value per share with earnings per share. Generally a high P/E ratio indicates that
the company is doing well, earning profits and has a quality of management (Warren and
Jones, 2018).
Price Earnings ratio 2016 2017
Market price per share (A) 5.6 4.3
Earnings per share (B) 47.4 32.5
P/E ratio (A/B) 0.12 0.13
4
2016 2017
0.2
0.22
0.24
Operating profit ratio
Operating Profit Margin
Years
%
The above graph shows the graphical representation of Telstra’s operating profit margin for
the past two year that are 2016 and 2017. It can be observed from the graph that the company
has a ratio of 23% in 2016 and the same reduces to 22% in 2017. This is because of the
overall reduction in the EBIT of Telstra from $6310 million to $6238 million. However, the
change is minor and has not impacted the profitability of Telstra to a great extent. Also, the
organization’s net profit has risen in the year 2017.
2. Price to equity ratio
It is also known as price earnings ratio. It indicates the willingness of an investor to pay per
dollar of earnings. Therefore, it is also known as price multiple and is calculated by dividing
the market value per share with earnings per share. Generally a high P/E ratio indicates that
the company is doing well, earning profits and has a quality of management (Warren and
Jones, 2018).
Price Earnings ratio 2016 2017
Market price per share (A) 5.6 4.3
Earnings per share (B) 47.4 32.5
P/E ratio (A/B) 0.12 0.13
Finance
5
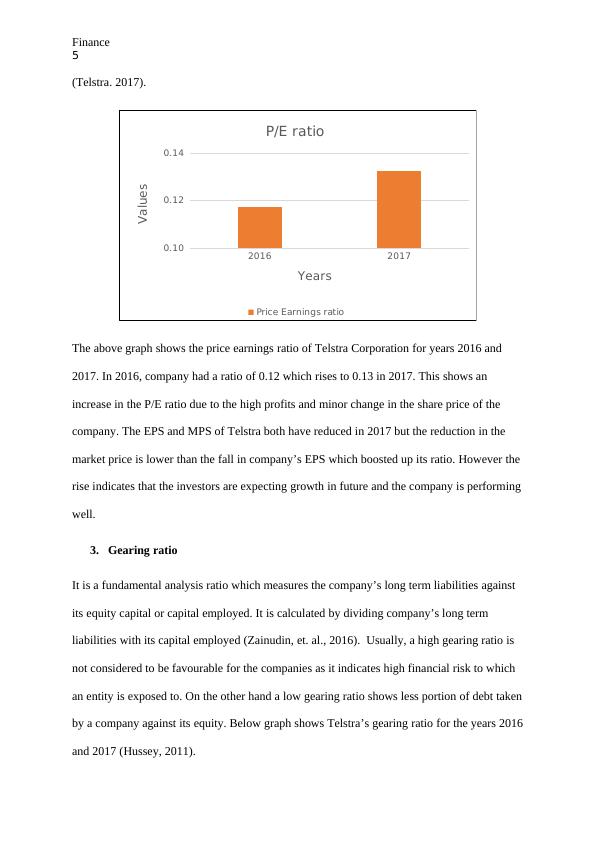
(Telstra. 2017).
2016 2017
0.10
0.12
0.14
P/E ratio
Price Earnings ratio
Years
Values
The above graph shows the price earnings ratio of Telstra Corporation for years 2016 and
2017. In 2016, company had a ratio of 0.12 which rises to 0.13 in 2017. This shows an
increase in the P/E ratio due to the high profits and minor change in the share price of the
company. The EPS and MPS of Telstra both have reduced in 2017 but the reduction in the
market price is lower than the fall in company’s EPS which boosted up its ratio. However the
rise indicates that the investors are expecting growth in future and the company is performing
well.
3. Gearing ratio
It is a fundamental analysis ratio which measures the company’s long term liabilities against
its equity capital or capital employed. It is calculated by dividing company’s long term
liabilities with its capital employed (Zainudin, et. al., 2016). Usually, a high gearing ratio is
not considered to be favourable for the companies as it indicates high financial risk to which
an entity is exposed to. On the other hand a low gearing ratio shows less portion of debt taken
by a company against its equity. Below graph shows Telstra’s gearing ratio for the years 2016
and 2017 (Hussey, 2011).
5
(Telstra. 2017).
2016 2017
0.10
0.12
0.14
P/E ratio
Price Earnings ratio
Years
Values
The above graph shows the price earnings ratio of Telstra Corporation for years 2016 and
2017. In 2016, company had a ratio of 0.12 which rises to 0.13 in 2017. This shows an
increase in the P/E ratio due to the high profits and minor change in the share price of the
company. The EPS and MPS of Telstra both have reduced in 2017 but the reduction in the
market price is lower than the fall in company’s EPS which boosted up its ratio. However the
rise indicates that the investors are expecting growth in future and the company is performing
well.
3. Gearing ratio
It is a fundamental analysis ratio which measures the company’s long term liabilities against
its equity capital or capital employed. It is calculated by dividing company’s long term
liabilities with its capital employed (Zainudin, et. al., 2016). Usually, a high gearing ratio is
not considered to be favourable for the companies as it indicates high financial risk to which
an entity is exposed to. On the other hand a low gearing ratio shows less portion of debt taken
by a company against its equity. Below graph shows Telstra’s gearing ratio for the years 2016
and 2017 (Hussey, 2011).
Finance
6
Gearing ratio 2016 2017
Long term liabilities
(A) 14,647 14,808
Capital employed (B) 34,098.00 32,974.00
GR (A/B) 43% 45%
2016 2017
40%
42%
44%
46%
Gearing ratio
Gearing ratio
Years
%
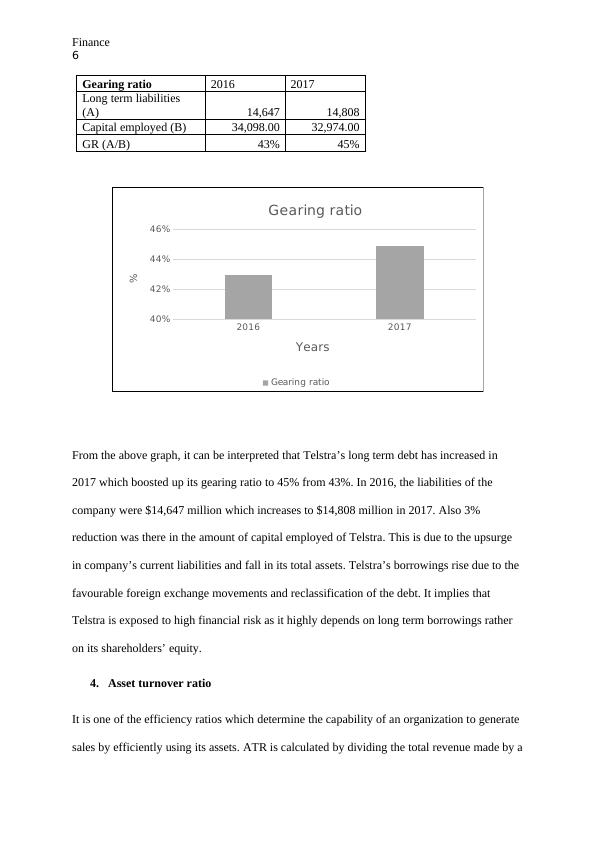
From the above graph, it can be interpreted that Telstra’s long term debt has increased in
2017 which boosted up its gearing ratio to 45% from 43%. In 2016, the liabilities of the
company were $14,647 million which increases to $14,808 million in 2017. Also 3%
reduction was there in the amount of capital employed of Telstra. This is due to the upsurge
in company’s current liabilities and fall in its total assets. Telstra’s borrowings rise due to the
favourable foreign exchange movements and reclassification of the debt. It implies that
Telstra is exposed to high financial risk as it highly depends on long term borrowings rather
on its shareholders’ equity.
4. Asset turnover ratio
It is one of the efficiency ratios which determine the capability of an organization to generate
sales by efficiently using its assets. ATR is calculated by dividing the total revenue made by a
6
Gearing ratio 2016 2017
Long term liabilities
(A) 14,647 14,808
Capital employed (B) 34,098.00 32,974.00
GR (A/B) 43% 45%
2016 2017
40%
42%
44%
46%
Gearing ratio
Gearing ratio
Years
%
From the above graph, it can be interpreted that Telstra’s long term debt has increased in
2017 which boosted up its gearing ratio to 45% from 43%. In 2016, the liabilities of the
company were $14,647 million which increases to $14,808 million in 2017. Also 3%
reduction was there in the amount of capital employed of Telstra. This is due to the upsurge
in company’s current liabilities and fall in its total assets. Telstra’s borrowings rise due to the
favourable foreign exchange movements and reclassification of the debt. It implies that
Telstra is exposed to high financial risk as it highly depends on long term borrowings rather
on its shareholders’ equity.
4. Asset turnover ratio
It is one of the efficiency ratios which determine the capability of an organization to generate
sales by efficiently using its assets. ATR is calculated by dividing the total revenue made by a
Finance
7
company with its average total assets. Usually, a high ATR is considered to be more desirable
as it indicates high turnover from assets and make the firm more efficient (Jenter and
Lewellen, 2015). Telstra Corporation ATR is represented below.
Asset Turnover ratio 2016 2017
Revenue (A) 27050.0 28205.0
Average total assets (B) 41,866 42,710
ATR (A/B)
0.6
5
0.6
6
2016 2017
0.62
0.64
0.66
0.68
Asset turnover ratio
Asset Turnover ratio
Years
values
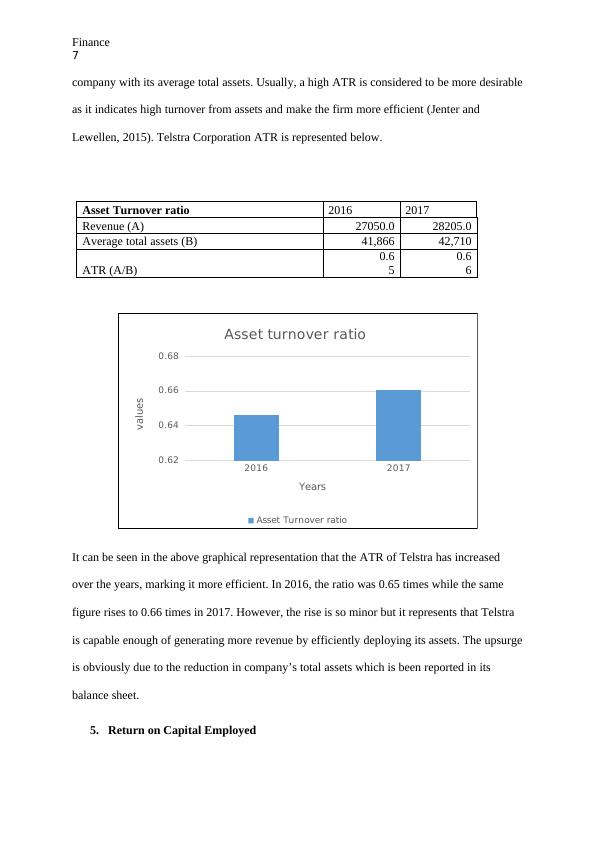
It can be seen in the above graphical representation that the ATR of Telstra has increased
over the years, marking it more efficient. In 2016, the ratio was 0.65 times while the same
figure rises to 0.66 times in 2017. However, the rise is so minor but it represents that Telstra
is capable enough of generating more revenue by efficiently deploying its assets. The upsurge
is obviously due to the reduction in company’s total assets which is been reported in its
balance sheet.
5. Return on Capital Employed
7
company with its average total assets. Usually, a high ATR is considered to be more desirable
as it indicates high turnover from assets and make the firm more efficient (Jenter and
Lewellen, 2015). Telstra Corporation ATR is represented below.
Asset Turnover ratio 2016 2017
Revenue (A) 27050.0 28205.0
Average total assets (B) 41,866 42,710
ATR (A/B)
0.6
5
0.6
6
2016 2017
0.62
0.64
0.66
0.68
Asset turnover ratio
Asset Turnover ratio
Years
values
It can be seen in the above graphical representation that the ATR of Telstra has increased
over the years, marking it more efficient. In 2016, the ratio was 0.65 times while the same
figure rises to 0.66 times in 2017. However, the rise is so minor but it represents that Telstra
is capable enough of generating more revenue by efficiently deploying its assets. The upsurge
is obviously due to the reduction in company’s total assets which is been reported in its
balance sheet.
5. Return on Capital Employed
Finance
8
It is another profitability metric which is expressed in terms of percentage and is used to
measure the impact of leverage over a company’s profitability position. The two components
required for calculating ROCE are EBIT and capital employed. EBIT is the income of the
company earned before paying any taxes and depreciation. Capital employed comprises of
company’s share capital and debt liabilities (Penman, et. al., 2017). Alternatively, it also
represents the difference between the total assets and current liabilities of the company. A
higher ROCE is generally acceptable by the investors as it clearly indicates that the company
has deployed its capital more efficiently than the one having a low ROCE ratio (Levi and
Segal, 2015).
Return on capital employed 2016 2017
EBIT (A)
6,310.0
0
6,238.0
0
Capital employed (B)
34,098.0
0
32,974.0
0
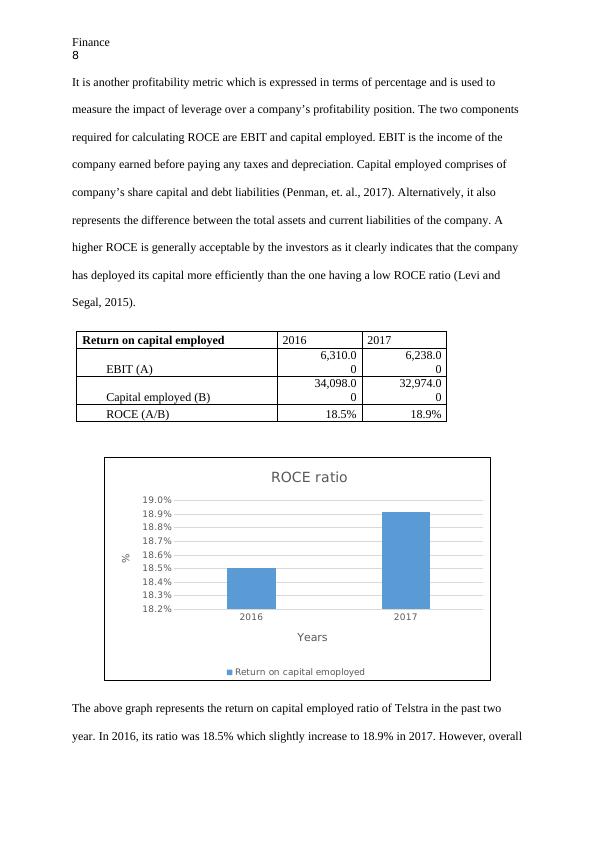
ROCE (A/B) 18.5% 18.9%
2016 2017
18.2%
18.3%
18.4%
18.5%
18.6%
18.7%
18.8%
18.9%
19.0%
ROCE ratio
Return on capital emoployed
Years
%
The above graph represents the return on capital employed ratio of Telstra in the past two
year. In 2016, its ratio was 18.5% which slightly increase to 18.9% in 2017. However, overall
8
It is another profitability metric which is expressed in terms of percentage and is used to
measure the impact of leverage over a company’s profitability position. The two components
required for calculating ROCE are EBIT and capital employed. EBIT is the income of the
company earned before paying any taxes and depreciation. Capital employed comprises of
company’s share capital and debt liabilities (Penman, et. al., 2017). Alternatively, it also
represents the difference between the total assets and current liabilities of the company. A
higher ROCE is generally acceptable by the investors as it clearly indicates that the company
has deployed its capital more efficiently than the one having a low ROCE ratio (Levi and
Segal, 2015).
Return on capital employed 2016 2017
EBIT (A)
6,310.0
0
6,238.0
0
Capital employed (B)
34,098.0
0
32,974.0
0
ROCE (A/B) 18.5% 18.9%
2016 2017
18.2%
18.3%
18.4%
18.5%
18.6%
18.7%
18.8%
18.9%
19.0%
ROCE ratio
Return on capital emoployed
Years
%
The above graph represents the return on capital employed ratio of Telstra in the past two
year. In 2016, its ratio was 18.5% which slightly increase to 18.9% in 2017. However, overall
End of preview
Want to access all the pages? Upload your documents or become a member.
Related Documents
Telstra Financial Analysis Assignmentlg...
|16
|3025
|29
LB5212 Financial Analysis Company Report - Telstra Corporation Ltdlg...
|23
|3643
|333
Evaluation of Telstra Annual Reportlg...
|5
|1516
|95
Financial Analysis of Telstra Corporation and Comparison with Queste Communications Limitedlg...
|27
|4185
|91
Financial Analysis of Telstra Corporation and JB HI-FI Limitedlg...
|18
|4110
|282
ASX CGC Principleslg...
|14
|2773
|232