MAF101 Finance Assignment: Portfolio Management and Stock Analysis
VerifiedAdded on 2023/04/21
|16
|3249
|442
Homework Assignment
AI Summary
This assignment covers key concepts in finance, including calculating accumulated income from investments over 25 years, determining the initial investment needed for future payments, and analyzing bond values under different interest rate scenarios. It also involves detecting stock prices at 3-year and 15-year intervals using the dividend discount model. The second part focuses on portfolio management, including deriving average returns and standard deviations for selected portfolios and stocks, assessing expected returns and risks, discussing diversification strategies, identifying systematic risk, and understanding risk aversion. The assignment concludes with recommendations on the best possible portfolio for different customer types, emphasizing the importance of balancing risk and return to meet individual investment goals. Desklib offers similar solved assignments and past papers for students.

Running head: FINANCE
Finance
Name of the Student:
Name of the University:
Authors Note:
Finance
Name of the Student:
Name of the University:
Authors Note:
Paraphrase This Document
Need a fresh take? Get an instant paraphrase of this document with our AI Paraphraser

FINANCE
1
Table of Contents
Part 1:.........................................................................................................................................2
1. Calculating the accumulated of income that will be genetic after the investment of 25
years:..........................................................................................................................................2
2. Calculating the initial investment that is needed for conducting future payments:...............4
3.a Calculating market bond value with the interest rate of 11.50%:........................................5
3.b Calculating market bond value with the interest rate of 6%:...............................................5
3.c Depicting why the market values of the bond changed under alternative interest rate
situation:.....................................................................................................................................6
4. Detecting the price of stocks in 3 year and 15-year intervals:...............................................6
Part 2:.........................................................................................................................................8
1. Deriving the average return and standard deviation of the selected portfolios and stock
listed in the table:.......................................................................................................................8
2. Indicating what is expected return and risk of finance in accordance with the portfolio and
stocks:.........................................................................................................................................9
3. Providing discussion on the diversification measure, while understanding its impact on
return and risk:...........................................................................................................................9
4. Stating the system and calculation that can be used for identifying the systematic risk of an
asset:.........................................................................................................................................10
5. Mentioning about the different states of investing cycle and the meaning of risk aversion:
..................................................................................................................................................10
6. Providing relevant recommendation on the best possible portfolio for each of the customer
types:........................................................................................................................................11
References and Bibliography:..................................................................................................13

FINANCE
2
Part 1:
1. Calculating the accumulated of income that will be genetic after the investment of 25
years:
Particulars Value
Current savings $ 15,000.0
Interest (Simple) 13.0%
Y 3.0
Total interest
received
15,000 * 13% * 3
Total interest
received
$ 5,850.0
Value at 3 years end $ 15,000.0 + $5,850.0
Value at 3 years end $ 20,850.0
Particulars Value
Value at 3 years end $ 20,850.0
Compounded (monthly) 10.0%
R 0.8%
Y 12.0
T 144.0
Value at 15 years end 20,850.0*(((1+(0.8%))^144.0))
Value at 15 years end $ 68,881.1
⊘ This is a preview!⊘
Do you want full access?
Subscribe today to unlock all pages.
Trusted by 1+ million students worldwide

FINANCE
3
Particulars Value
Value at 15 years end $ 68,881.1
Compounded (quarterly) 9.0%
R 2.3%
Y 8.0
T 32.0
Value at 23 years end 68,881.1*(((1+(2.3%))^32.0))
Value at 23 years end $ 140,386.7
Particulars Value
Value at 23 years end $ 140,386.7
Compounded (daily) 15.0%
R 0.0411%
Y 2.0
T 730.0
Value at 25 years end 140,386.7*(((1+(0.0.0411%))^730.0))
Value at 25 years end $ 189,490.6
Particulars Value
Payment (Bonus) $ 320.0
T 12.0
I 12.0%
FV 320.0 * ((((1+12.0%)^12.0)-1)/12.0%)
FV $ 7,722.6
Paraphrase This Document
Need a fresh take? Get an instant paraphrase of this document with our AI Paraphraser

FINANCE
4
Value at 25 years end $ 189,490.6
Payment received after 25 years $ 7,722.6 + $ 189,490.6
Payment received after 25 years $ 197,213.2
The above table directly represents the overall income, which will be generated from
the overall investment for 25 years. the total amount that will be received after the 25-year
investment is mainly at the levels of $197,213.2. Therefore, it is advised to continue with the
investment plan, as it will generate an adequate level of income over the period of time.
2. Calculating the initial investment that is needed for conducting future payments:
Interest rate 7.25%
I 0.14%
Yea
r
No of week Payment PV of the Payment
1 52.0 $
200,000.0
$ 186,022.5
3 156.0 $
130,000.0
$ 104,604.4
5 260.0 $
96,000.0
$ 66,826.6
8 416.0 $
312,000.0
$ 174,758.9
10 520.0 $
1,250,000.0
$ 605,711.5

FINANCE
5
Initial Investment needed $ 1,137,923.9
The calculation conducted in the above table relevantly depicts the overall initial
investment that is needed for building the project. The investment of an $1,137,923.9 is
mainly needed in the initial stage for adequately conducting the relevant payments in
different years to support the building process.
3.a Calculating market bond value with the interest rate of 11.50%:
Particulars Value
FV $ 100,000.0
Coupon rate 8.3%
C 4.1%
Years 6.0
T 12.0
Yield 11.5%
R 5.8%
Bond Market
price
((100,000.0 * 4.1%) * (((1-((1+5.8%)^-
12.0))/5.8%))) + (100,000.0 /
(((1+5.8%)^12.0)))
Bond Market
price
$ 86,187.6
3.b Calculating market bond value with the interest rate of 6%:
Particulars Value
⊘ This is a preview!⊘
Do you want full access?
Subscribe today to unlock all pages.
Trusted by 1+ million students worldwide
FINANCE
6
FV $ 100,000.0
Coupon rate 8.3%
C 4.1%
Years 6.0
T 12.0
Yield 6.0%
R 3.0%
Bond Market price ((100,000.0 *4.1%) * (((1-((1+3.0%)^-
12.0))/3.0%))) + (100,000.0 /
(((1+3.0%)^12.0)))
Bond Market price $ 111,198.3
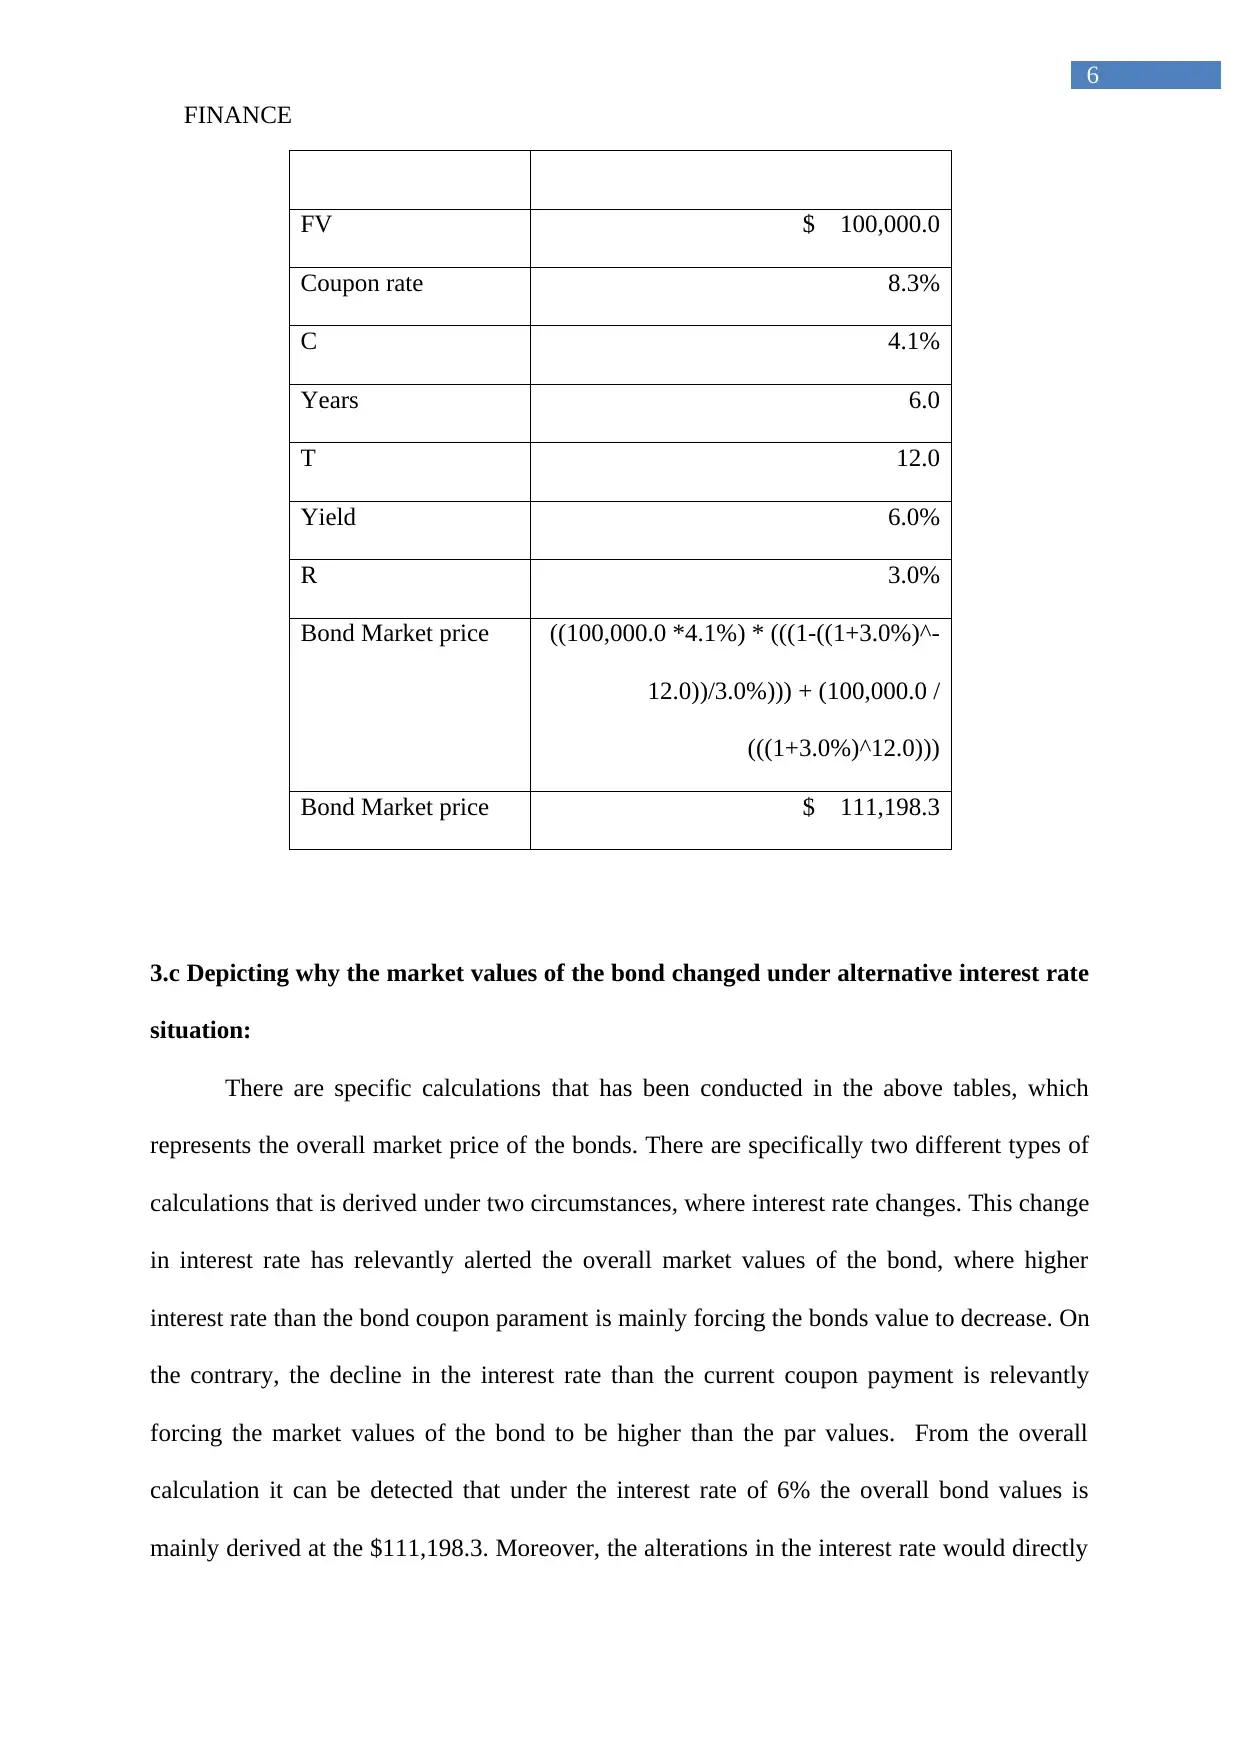
3.c Depicting why the market values of the bond changed under alternative interest rate
situation:
There are specific calculations that has been conducted in the above tables, which
represents the overall market price of the bonds. There are specifically two different types of
calculations that is derived under two circumstances, where interest rate changes. This change
in interest rate has relevantly alerted the overall market values of the bond, where higher
interest rate than the bond coupon parament is mainly forcing the bonds value to decrease. On
the contrary, the decline in the interest rate than the current coupon payment is relevantly
forcing the market values of the bond to be higher than the par values. From the overall
calculation it can be detected that under the interest rate of 6% the overall bond values is
mainly derived at the $111,198.3. Moreover, the alterations in the interest rate would directly
6
FV $ 100,000.0
Coupon rate 8.3%
C 4.1%
Years 6.0
T 12.0
Yield 6.0%
R 3.0%
Bond Market price ((100,000.0 *4.1%) * (((1-((1+3.0%)^-
12.0))/3.0%))) + (100,000.0 /
(((1+3.0%)^12.0)))
Bond Market price $ 111,198.3
3.c Depicting why the market values of the bond changed under alternative interest rate
situation:
There are specific calculations that has been conducted in the above tables, which
represents the overall market price of the bonds. There are specifically two different types of
calculations that is derived under two circumstances, where interest rate changes. This change
in interest rate has relevantly alerted the overall market values of the bond, where higher
interest rate than the bond coupon parament is mainly forcing the bonds value to decrease. On
the contrary, the decline in the interest rate than the current coupon payment is relevantly
forcing the market values of the bond to be higher than the par values. From the overall
calculation it can be detected that under the interest rate of 6% the overall bond values is
mainly derived at the $111,198.3. Moreover, the alterations in the interest rate would directly
Paraphrase This Document
Need a fresh take? Get an instant paraphrase of this document with our AI Paraphraser

FINANCE
7
change the actual market bond rate to $86,188 with the interest rate of 11.5%. Therefore,
from the evaluation it can be detected that market values of bond relevantly changes due to
the alterations in the interest rates. The interest rate being higher than the coupon payment
could eventually reduce the demand for corporate bonds, while lower interest rates would
increase the demand for corporate bonds and raise its market value (Hawawini 2017).
4. Detecting the price of stocks in 3 year and 15-year intervals:
Year Dividend Discounting rate PV of Dividends
1 $ 2.18 0.877 $ 1.91
2 $ 2.38 0.769 $ 1.83
3 $ 2.59 0.675 $ 1.75
4 $ 2.82 0.592 $ 1.67
5 $ 3.08 0.519 $ 1.60
6 $ 3.35 0.456 $ 1.53
7 $ 3.66 0.400 $ 1.46
8 $ 3.99 0.351 $ 1.40
9 $ 4.34 0.308 $ 1.34
10 $ 4.73 0.270 $ 1.28
11 $ 5.16 0.237 $ 1.22
12 $ 5.63 0.208 $ 1.17
13 $ 6.13 0.182 $ 1.12
14 $ 6.68 0.160 $ 1.07
15 $ 7.28 0.140 $ 1.02
15 $ 7.28 $ 145.70
Price in 15 years $ 167.05

FINANCE
8
Year Dividend Discounting
rate
PV of Dividends
1 $ 2.18 0.877 $ 1.91
2 $ 2.38 0.769 $ 1.83
3 $ 2.59 0.675 $ 1.75
3 $ 2.59 $ 51.80
Price in 3 years $ 57.29
The above table relevant represents the overall share price of the stock under the
dividend discount model. This calculation has relevantly indicated that with the continuous
dividend payments, share value the company increases exponential. This relevantly alters the
share price to the level of $57.29 in 3 years and $167.05 in 15 years.
Part 2:
1. Deriving the average return and standard deviation of the selected portfolios and
stock listed in the table:
Weight Shares Propert
y
Bonds Cash
Portfolio Alpha 70.000% 20.000% 0.000% 10.000%
Portfolio Beta 30.000% 20.000% 50.000% 0.000%
Portfolio
Gamma
0.000% 20.000% 30.000% 50.000%
⊘ This is a preview!⊘
Do you want full access?
Subscribe today to unlock all pages.
Trusted by 1+ million students worldwide

FINANCE
9
Year Shares
Propert
y Bonds Cash Alpha Beta Gamma
2003 15.9% 8.8% 3.0% 4.9% 13.4% 8.0% 5.1%
2004 27.6% 32.0% 7.0% 5.6% 26.3% 18.2% 11.3%
2005 21.1% 12.5% 5.8% 5.7% 17.8% 11.7% 7.1%
2006 25.0% 34.0% 3.1% 6.0% 24.9% 15.9% 10.7%
2007 18.0% -8.4% 3.5% 6.7% 11.6% 5.5% 2.7%
2008 -40.4% -54.0% 14.9% 7.6% -38.3% -15.5% -2.5%
2009 39.6% 7.9% 1.7% 3.5% 29.7% 14.3% 3.8%
2010 3.3% -0.4% 6.0% 4.7% 2.7% 3.9% 4.1%
2011 -11.4% -1.5% 11.4% 5.0% -7.8% 2.0% 5.6%
2012 18.8% 33.0% 7.7% 4.0% 20.2% 16.1% 10.9%
2013 19.7% 7.1% 2.0% 2.9% 15.5% 8.3% 3.5%
2014 5.0% 27.0% 9.8% 2.7% 9.2% 11.8% 9.7%
2015 3.8% 14.3% 2.6% 2.3% 5.8% 5.3% 4.8%
2016 11.6% 13.2% 2.9% 2.1% 11.0% 7.6% 4.6%
2017 12.5% 5.7% 3.7% 1.7% 10.1% 6.7% 3.1%
Expected
Return 11.3% 8.7% 5.7% 4.4% 10.1% 8.0% 5.6%
Risk 18.7% 21.7% 3.9% 1.8% 16.5% 8.1% 3.8%
2. Indicating what is expected return and risk of finance in accordance with the
portfolio and stocks:
Expected return is relevantly used by the organisation for detecting the level of
income that can be generated in the long run. Expected returns is calculated with the help of
different models and calculations, which allows the investors to detecting future income of an
asset. Expected risk is a terminology, which allows the investors to detect the level of risk
that needs to be maintained during the investment period. Investors with the help of expected
risk and returns is able to determine the level of future incomes that can be generated from a
particular investment. The calculations conducted in the above table directly represents that
the Cash asset relevantly has the lowest risk and return from historical data. On the other
hand, share asset has the highest level of risk and return involved in the investment, as per the
calculations (Altuntas and Dereli 2015). Therefore, it could be assumed that investors to
increase their returns from investment needs to acquire additional risk from investment.
Paraphrase This Document
Need a fresh take? Get an instant paraphrase of this document with our AI Paraphraser

FINANCE
10
3. Providing discussion on the diversification measure, while understanding its impact
on return and risk:
Investors with the help of adequate diversification measure is mainly able to minimise
the level of risk that can be conducted on a particular investment, while raising the level of
returns. Diversification process is used by the investors for formulating their portfolio, which
minimises the level of risk involved in the investors with the help of asset weights. This
process eventually allows the investor to understand the level of risk and return attributes of
an asset, while determining the level of income that can be generated from an investment.
The diversification strategy has been adequately depicted while creating the portfolio
Gamma, Beta and Alpha in the above table. The calculations directly indicate that with the
help of weights diversification process was conducted investors to minimise the level of risk
and increase returns from investment. correlation coefficient values are relevantly derived by
the investors for detecting the correlation between the stock that will be listed in the portfolio.
The correlation values help the investors to detect the stocks, which is highly correlated and
low correlated with each other, as it supports the diversification process and creates a
portfolio that can minimise the risk from capital market, while generating high returns
(Chandra 2017). The correlation system has mainly allowed Gamma Portfolio to generate
adequate return, while having the lowest risk possible from investment.
4. Stating the system and calculation that can be used for identifying the systematic risk
of an asset:
Market risk is relevantly considered the systematic risk, which relevantly allows the
investors to understand the adequate risk involved with investments. In addition, there is
specific calculations, which needs to be conducted by the investors for deriving the overall
systematic risk of the stock. This calculation utilises the overall daily fluctuations or returns
FINANCE
11
of a stock to determine the risk in comparison with market returns. This calculation relevantly
allows the investors to determine the risk level of a stock, which is later used in the portfolio
creation process (Chisholm et al. 2016). From the evaluation, it can be detected that Asset B
is one of the riskiest assets in comparison to Asset A, as the beta values is relevantly high.
The beta values directly depict the risk attributes of a stock subject the market movement.
The high values of beta directly affect the share price of Asset B by 20%, while Asset A will
only move by 5% on both situations.
5. Mentioning about the different states of investing cycle and the meaning of risk
aversion:
Investors are relevantly considered risk averse, as they intend to achieve high returns,
while incurring low risk in investment. Risk aversion is a measure that is used by the
investors for accumulating an adequate portfolio, which has high return and low risk. The risk
aversion is the measure that is used by the investors in minimising the negative impact on the
capital market on their investments. The risk aversion method is used by the investors while
formulating the portfolio, which can eventually help in securing their capital investments.
However, the risk aversion techniques are only beneficial to under normal circumstances,
while the method loses its significance during a recession, where the risk aversion method
does not fully help the investors to minimise their risk from investment (DeFusco et al.
2015). The risk aversion technique is part of the investment cycle, as it allows the investors to
selectee, create and execute relevant investment trades. Hence, diversification and risk
aversion method are only of the stage of investments cycle, which is used by the investors to
secure their capital investments.
⊘ This is a preview!⊘
Do you want full access?
Subscribe today to unlock all pages.
Trusted by 1+ million students worldwide
1 out of 16
Related Documents


Your All-in-One AI-Powered Toolkit for Academic Success.
+13062052269
info@desklib.com
Available 24*7 on WhatsApp / Email
![[object Object]](/_next/static/media/star-bottom.7253800d.svg)
Unlock your academic potential
Copyright © 2020–2025 A2Z Services. All Rights Reserved. Developed and managed by ZUCOL.