Business Case Studies Finance Report: University Analysis
VerifiedAdded on 2023/01/19
|8
|1596
|52
Report
AI Summary
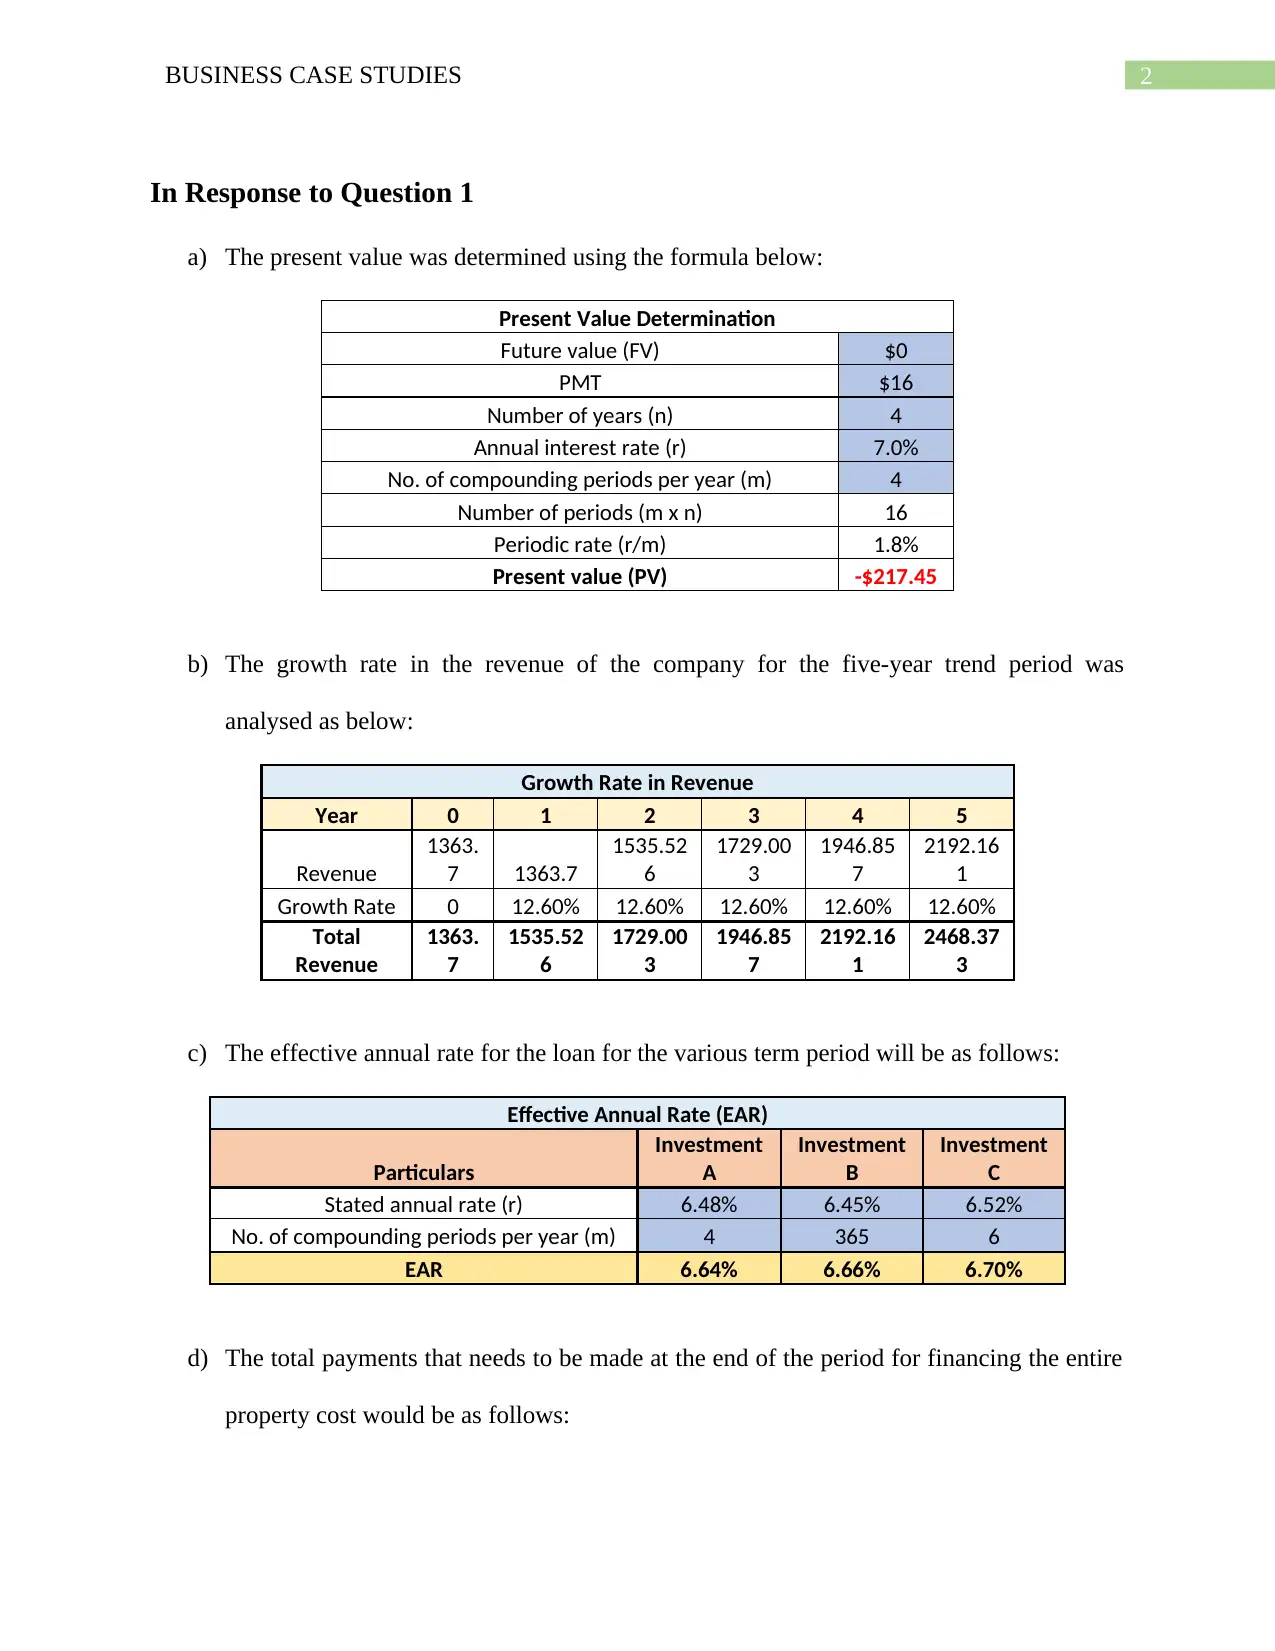
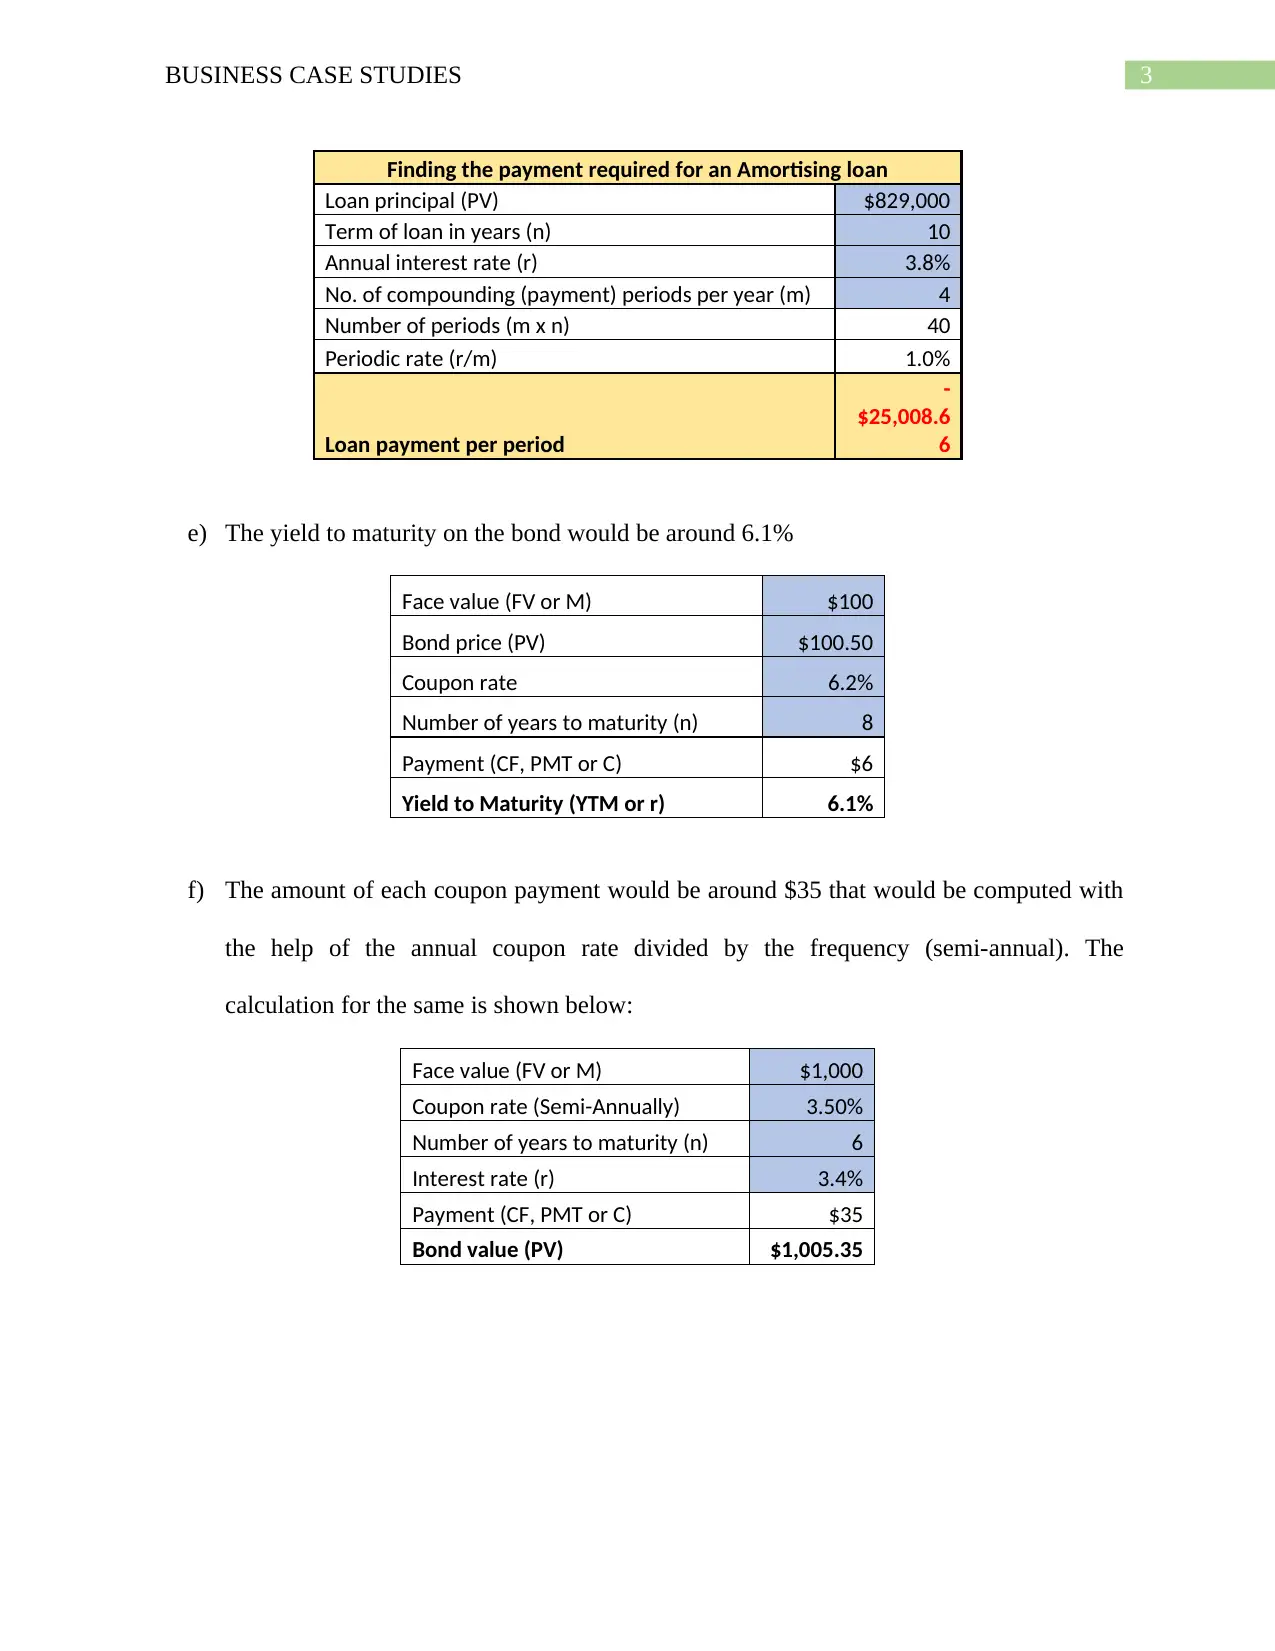
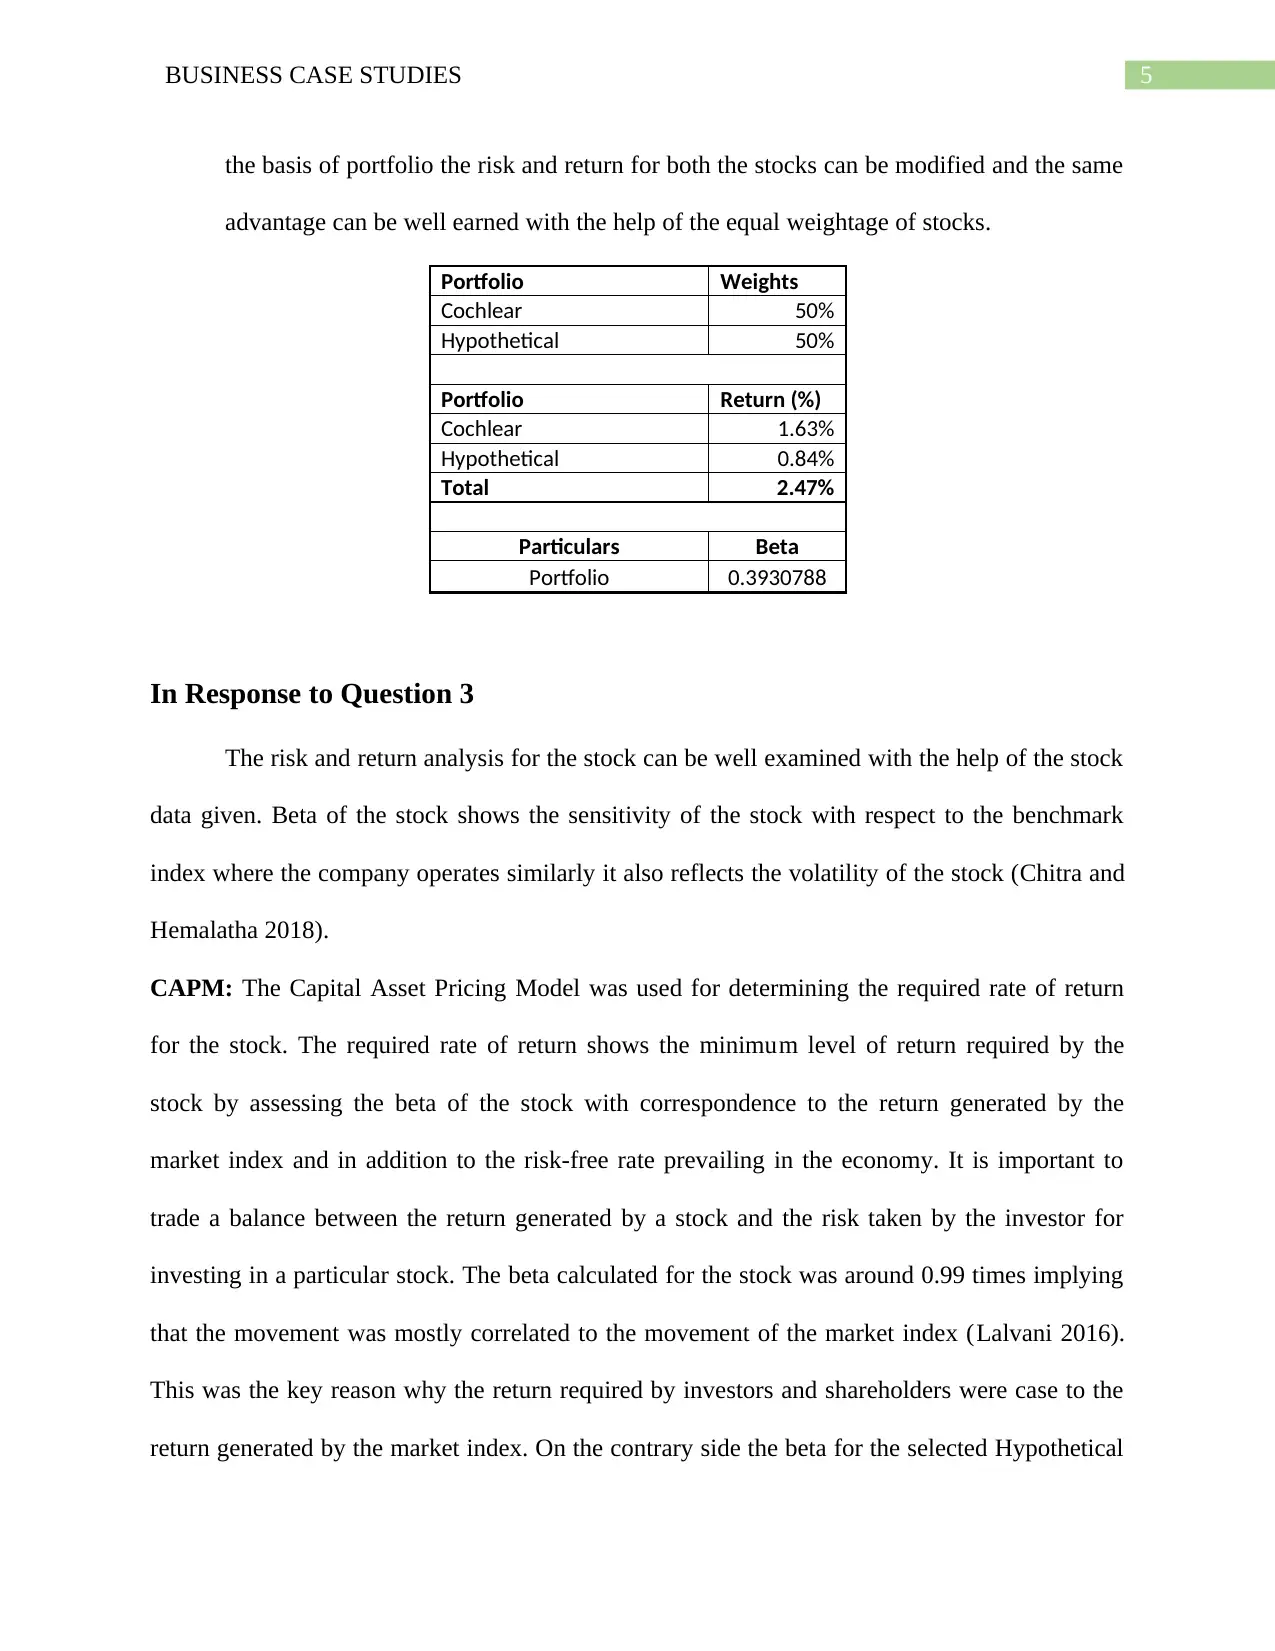
This finance report provides a comprehensive analysis of several business case studies. It begins by determining the present value of an investment and analyzing the revenue growth of a company over a five-year period. The report then calculates the effective annual rate (EAR) for different investment scenarios and determines the total payments required for an amortizing loan. Furthermore, the yield to maturity (YTM) on a bond and the amount of coupon payments are calculated. The report also applies the Capital Asset Pricing Model (CAPM) to determine the required rate of return for two stocks, Cochlear Ltd and a hypothetical company, and constructs a portfolio with both stocks, analyzing the portfolio's risk and return. The report concludes with a discussion of risk and return analysis, beta, and the benefits of diversification, using data from the Cochlear stock and market index to illustrate key financial concepts.


1 out of 8
Related Documents


Your All-in-One AI-Powered Toolkit for Academic Success.
+13062052269
info@desklib.com
Available 24*7 on WhatsApp / Email
![[object Object]](/_next/static/media/star-bottom.7253800d.svg)
Copyright © 2020–2026 A2Z Services. All Rights Reserved. Developed and managed by ZUCOL.