Financial Analysis of Commonwealth Bank of Australia
Added on 2022-11-24
12 Pages3160 Words312 Views
Running Head: FINANCE FOR BUSINESS 1
FINANCE FOR BUSINESS
[Name of Writer]
[Name of Institution]
FINANCE FOR BUSINESS
[Name of Writer]
[Name of Institution]

FINANCE FOR BUSINESS 2
I. Introduction:
This paper is aimed to observe and analyze financial status of any selected
organization and will be communicated to an institutional investor. Organization must be
listed at Australian Stock Exchange and industry with lucrative expected return. After
industry analysis, Commonwealth Bank of Australia is finalized and will analyzed for
financial performance over three years. Commonwealth Bank of Australia operates in
banking sector and register under ticker name of CBA. Commonwealth Bank of
Australia provide a range of financial services to Australia and abroad. Historical data of
Commonwealth Bank of Australia shows a stable growth and share price. There is no
any abnormal growth or deterioration of share price and net income. This report is
divided into three parts overview of selected company, financial analysis and
recommendation. Profitability ratios of Commonwealth Bank of Australia will be
analyzed to determine ability of organization to generate profit. Apart from profitability
ratios, operating efficiency ratios for last three years will also be discussed. Every
investor is interested to know about dividend trend and dividend policy of organization
therefore, dividend payout and current dividend policy will be discussed in detail. This
report also contain literature about Systematic risk and un-systemic risk. Based on the
financial analysis of the selected organization, a recommendation will be handed over to
investor. Recommendation letter will contain suggestion to invest or not to invest in
Commonwealth Bank of Australia.
II. Financial Analysis
II.1. Description of Company
Commonwealth Bank of Australia is listed on Australian Stock Exchange under
code CBA. Commonwealth Bank of Australia was established under banking act of
commonwealth in 1911 and just after one year it started its operation. Commonwealth
Bank of Australia started both general and saving services for Australia. With a
continuous and stable growth strategy, Commonwealth Bank is considered among
largest banks of world. Currently, there are almost 0.8 Million shareholders and about
52 thousand employees work in Commonwealth Bank of Australia. A large range of
financial services are provided to individual and institutional investors over the globe.
Commonwealth Bank provides saving and transaction accounts, term deposits,
personal and business loans, credit cards, insurance products, international payment,
and private banking services along with home loans (Yahoo Finance, 2019).
Commonwealth Bank of Australia also provide assets management services, debt
raising services and financial assistance. Commonwealth Bank facilitate customers with
more than 1000 branches and more than 4000 Automated Teller Machines alone in
Australia.
FINANCE FOR BUSINESS 3
There are many events in the history of Commonwealth Bank of Australia that
contributed to success such as mergers, acquisitions, international expansion and
innovative financial services. Among all, merger with State Bank of Victoria is
considered as reason of success and competitive advantage. In august 1990,
Commonwealth Bank of Australia initiated an agreement to merge with State Bank of
Victoria. This event helped organization to develop its leadership and paved into retail
branch banking services. Over a period of more than one century, Commonwealth Bank
of Australia faced many radical changes and risks but not only managed to survive but
pursued stable growth.
II.2. Ratio Analysis
Financial ratio analysis is a tool to analyze financial status of firms with simple
calculation (Babalola & Abiola, 2013). Financial experts have categorized financial
ratios to serve investors different purposes (Brown, 2012). Profitability ratios will help
investors to understand the ability of organization to generate profit for each dollar
invested (Petria, Capraru & Ihnatov, 2015). Operating efficiency ratios are used to
determine efficiency of firm in operations.
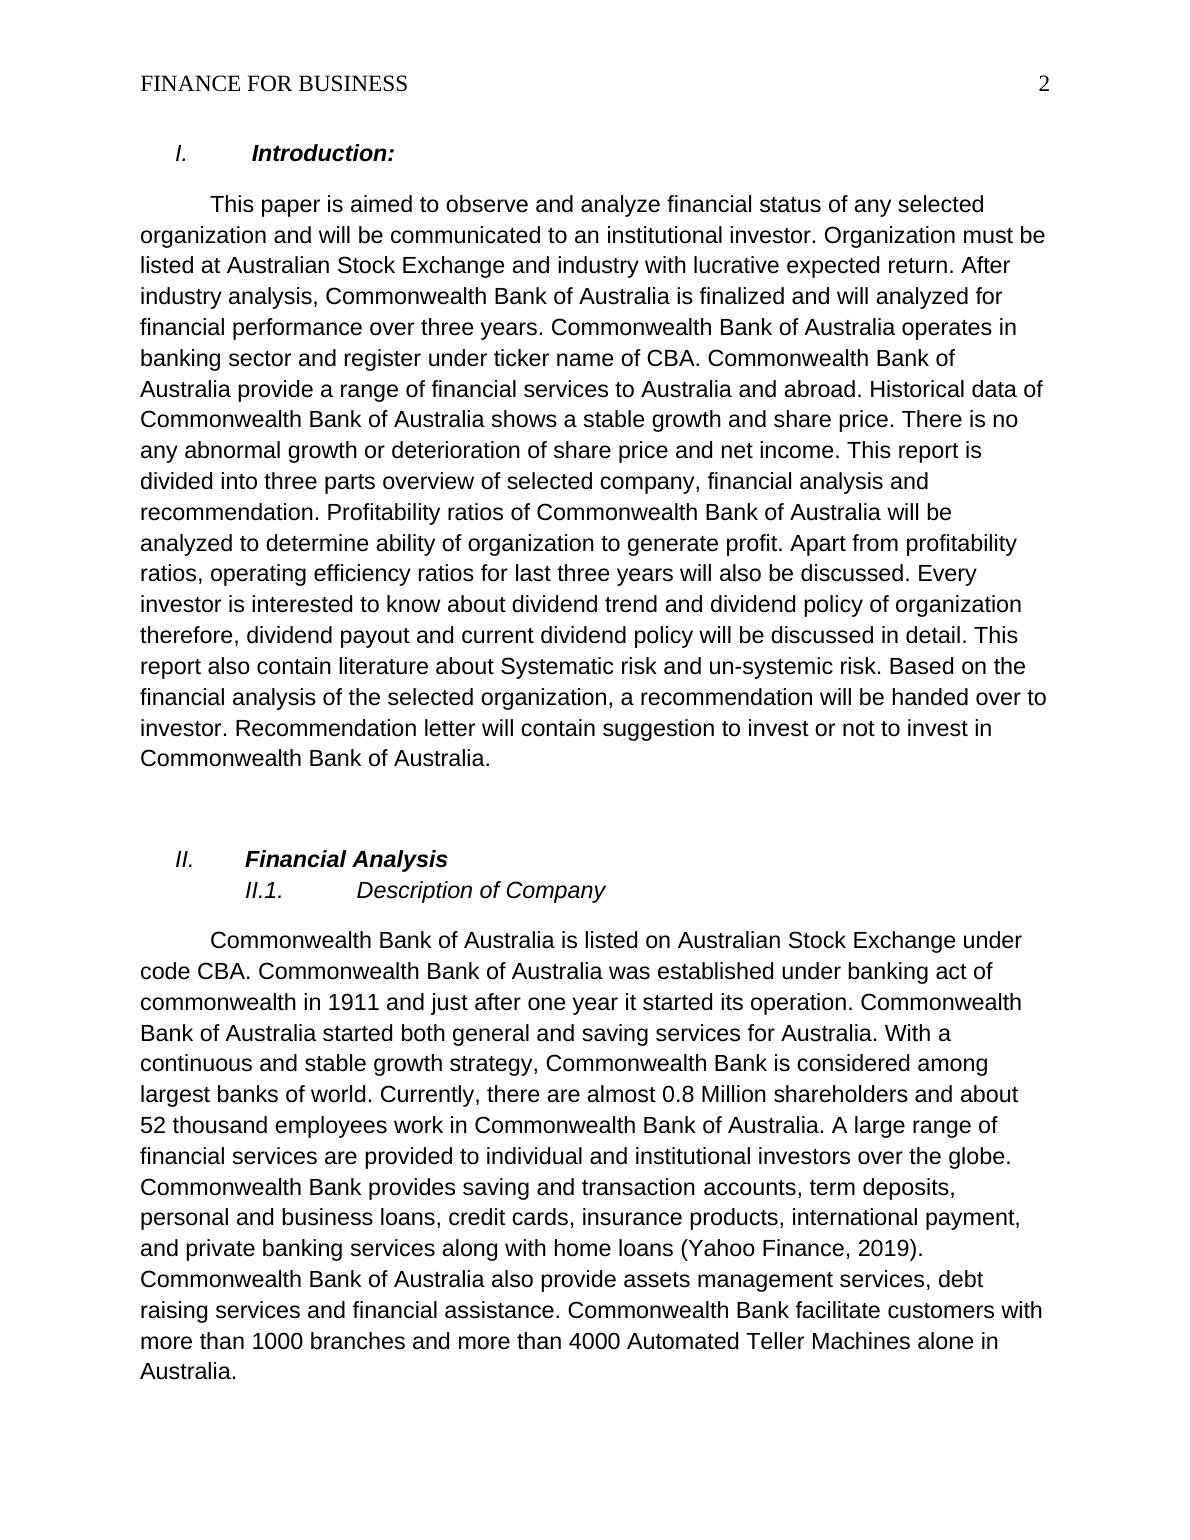
Operating efficiency ratios also known as activity ratios are used by management
and investors to measure ability of organization to utilize assets to generate sales
(Odunga, Nyangweso, Carter & Mwarumba, 2013). Net asset turnover shows that how
effectively resources are utilized by management to generate revenue (Lin, Liang &
Chen, 2011). Higher ratio shows that company is effectively utilizing resources to
generate revenue while lower ratio shows efficiency. Net asset turnover ratio of
Commonwealth Bank of Australia was 38.25%, 40.65% and 44.64% in year 2018, 2017
and 2016 respectively (Morningstar, 2019). Every year net asset turnover ratio is
decreasing which means that organization possess many idle resources. Other possible
reason for decline in net asset turnover ratio is highly expensive assets which are either
not used in sales generation or ineffectively used. Given below is graph of net asset
turnover ratio.
2016 2017 2018
0.34
0.38
0.42
0.46
0.45
0.41
0.38
Net Assets Turnover Ratio
There are many events in the history of Commonwealth Bank of Australia that
contributed to success such as mergers, acquisitions, international expansion and
innovative financial services. Among all, merger with State Bank of Victoria is
considered as reason of success and competitive advantage. In august 1990,
Commonwealth Bank of Australia initiated an agreement to merge with State Bank of
Victoria. This event helped organization to develop its leadership and paved into retail
branch banking services. Over a period of more than one century, Commonwealth Bank
of Australia faced many radical changes and risks but not only managed to survive but
pursued stable growth.
II.2. Ratio Analysis
Financial ratio analysis is a tool to analyze financial status of firms with simple
calculation (Babalola & Abiola, 2013). Financial experts have categorized financial
ratios to serve investors different purposes (Brown, 2012). Profitability ratios will help
investors to understand the ability of organization to generate profit for each dollar
invested (Petria, Capraru & Ihnatov, 2015). Operating efficiency ratios are used to
determine efficiency of firm in operations.
Operating efficiency ratios also known as activity ratios are used by management
and investors to measure ability of organization to utilize assets to generate sales
(Odunga, Nyangweso, Carter & Mwarumba, 2013). Net asset turnover shows that how
effectively resources are utilized by management to generate revenue (Lin, Liang &
Chen, 2011). Higher ratio shows that company is effectively utilizing resources to
generate revenue while lower ratio shows efficiency. Net asset turnover ratio of
Commonwealth Bank of Australia was 38.25%, 40.65% and 44.64% in year 2018, 2017
and 2016 respectively (Morningstar, 2019). Every year net asset turnover ratio is
decreasing which means that organization possess many idle resources. Other possible
reason for decline in net asset turnover ratio is highly expensive assets which are either
not used in sales generation or ineffectively used. Given below is graph of net asset
turnover ratio.
2016 2017 2018
0.34
0.38
0.42
0.46
0.45
0.41
0.38
Net Assets Turnover Ratio
FINANCE FOR BUSINESS 4
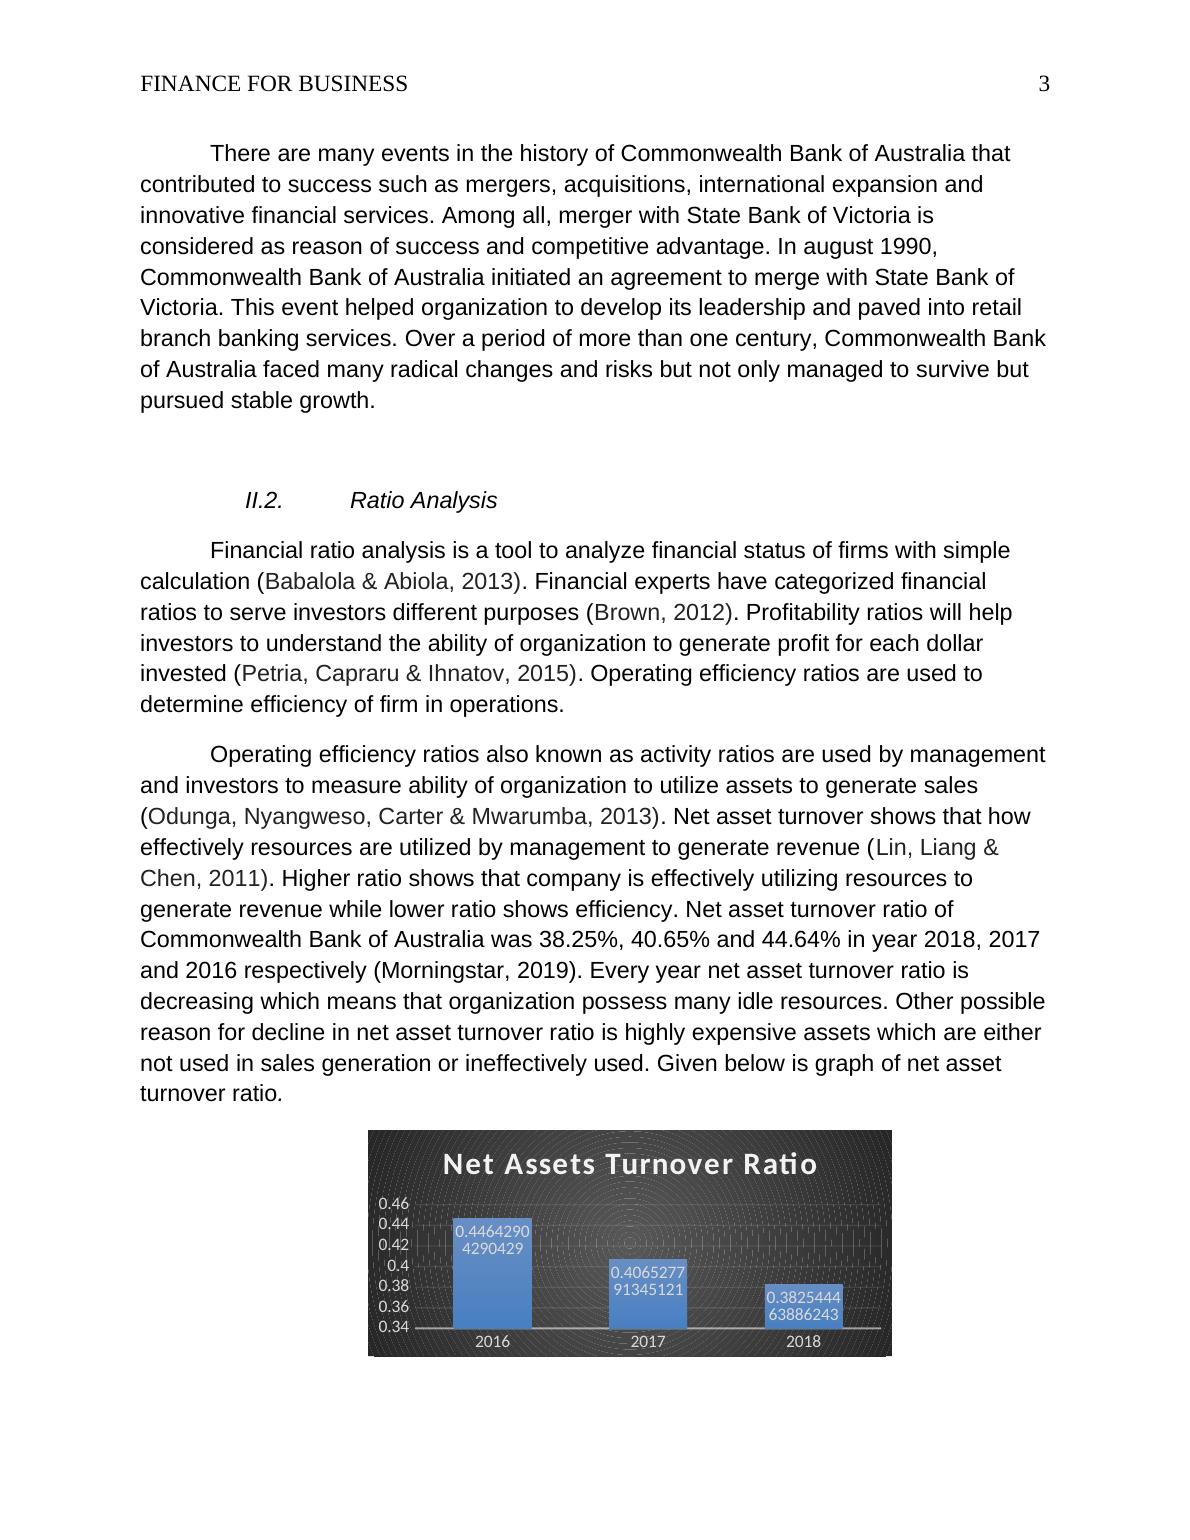
Efficiency ratio is widely used by banks because it tells ability of organization to
transform resources into revenue (Trujillo, 2013). Lower efficiency ratio is better
because lower ratio shows that company is effectively handling costs. A higher
efficiency ratio is associated with more inefficiency because more portion of revenue
goes to costs. Efficiency ratios of Commonwealth Bank of Australia were 46.9%, 47.1%
and 49.9% in 2018, 2017 and 2016 respectively. Efficiency ratio of Commonwealth
Bank of Australia is decreasing every year. Decreasing efficiency ratio means that
organizational performance and efficiency is improving. Given below is graph of
efficiency ratios for last three years that shows decreasing trend.
2016 2017 2018
0.45
0.47
0.49
0.51
0.5
0.47 0.47
Effi ciency Ratio
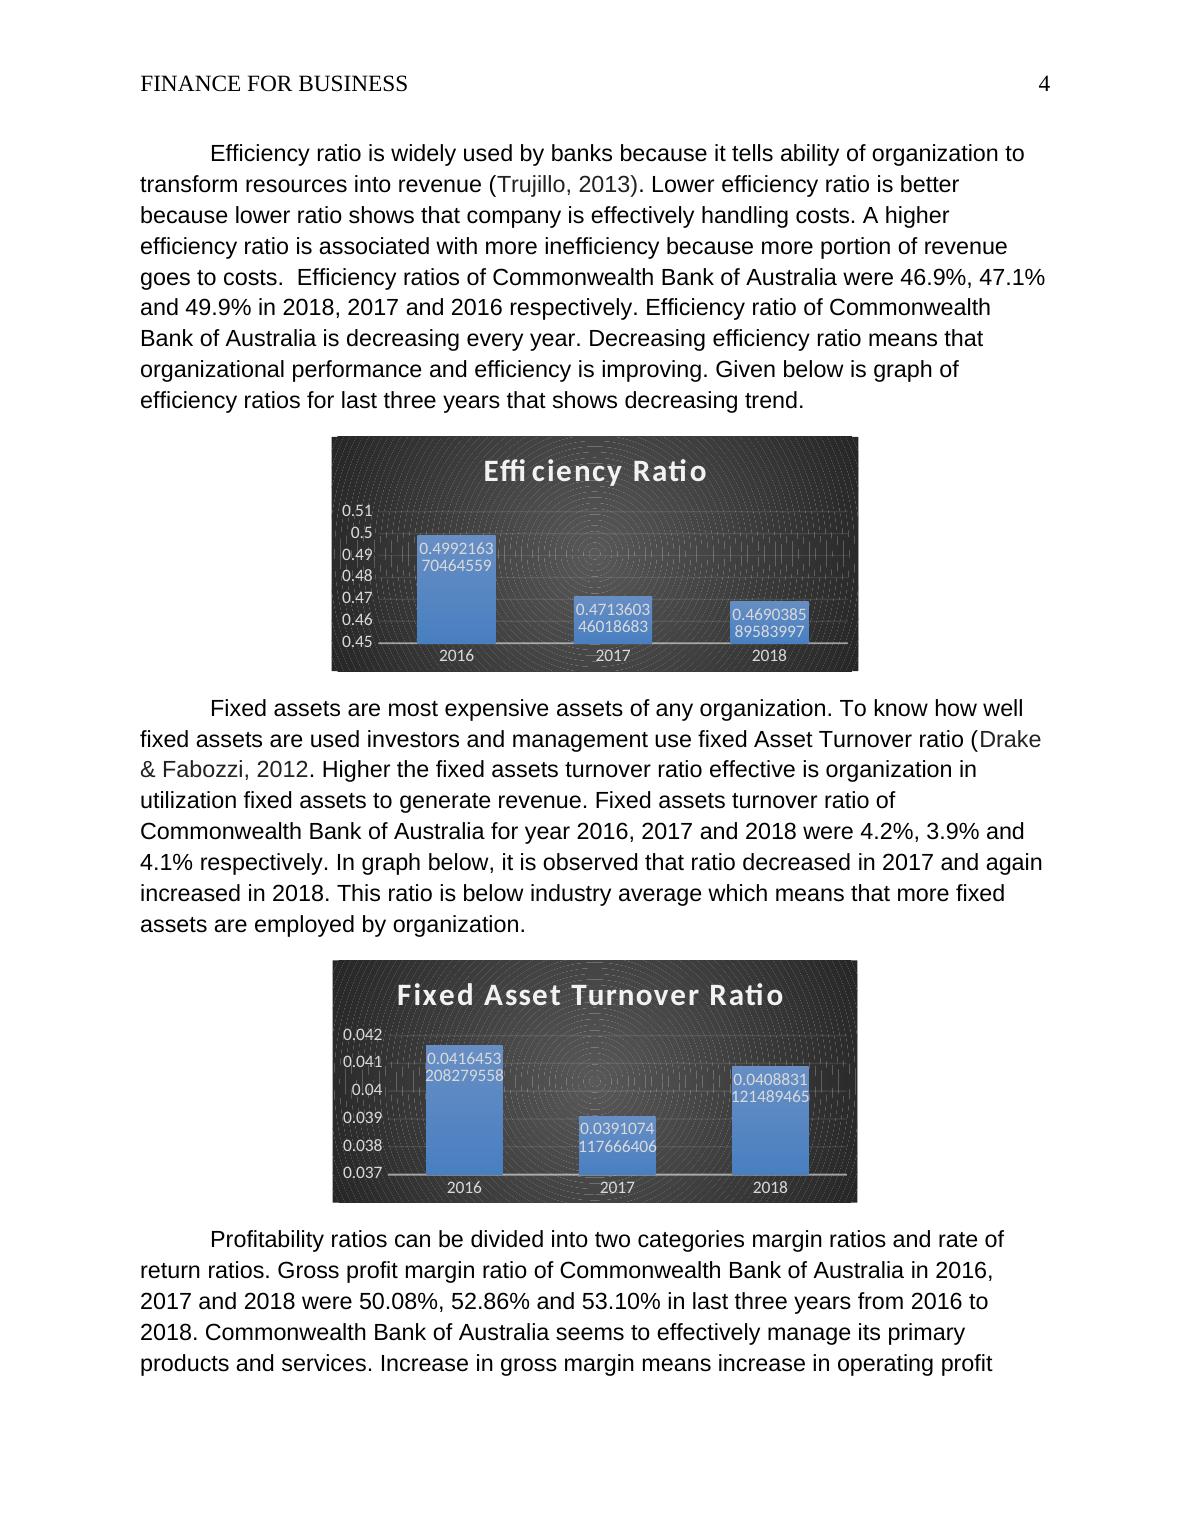
Fixed assets are most expensive assets of any organization. To know how well
fixed assets are used investors and management use fixed Asset Turnover ratio (Drake
& Fabozzi, 2012. Higher the fixed assets turnover ratio effective is organization in
utilization fixed assets to generate revenue. Fixed assets turnover ratio of
Commonwealth Bank of Australia for year 2016, 2017 and 2018 were 4.2%, 3.9% and
4.1% respectively. In graph below, it is observed that ratio decreased in 2017 and again
increased in 2018. This ratio is below industry average which means that more fixed
assets are employed by organization.
2016 2017 2018
0.04
0.04
0.05
0.04
0.04
0.04
Fixed Asset Turnover Ratio
Profitability ratios can be divided into two categories margin ratios and rate of
return ratios. Gross profit margin ratio of Commonwealth Bank of Australia in 2016,
2017 and 2018 were 50.08%, 52.86% and 53.10% in last three years from 2016 to
2018. Commonwealth Bank of Australia seems to effectively manage its primary
products and services. Increase in gross margin means increase in operating profit
Efficiency ratio is widely used by banks because it tells ability of organization to
transform resources into revenue (Trujillo, 2013). Lower efficiency ratio is better
because lower ratio shows that company is effectively handling costs. A higher
efficiency ratio is associated with more inefficiency because more portion of revenue
goes to costs. Efficiency ratios of Commonwealth Bank of Australia were 46.9%, 47.1%
and 49.9% in 2018, 2017 and 2016 respectively. Efficiency ratio of Commonwealth
Bank of Australia is decreasing every year. Decreasing efficiency ratio means that
organizational performance and efficiency is improving. Given below is graph of
efficiency ratios for last three years that shows decreasing trend.
2016 2017 2018
0.45
0.47
0.49
0.51
0.5
0.47 0.47
Effi ciency Ratio
Fixed assets are most expensive assets of any organization. To know how well
fixed assets are used investors and management use fixed Asset Turnover ratio (Drake
& Fabozzi, 2012. Higher the fixed assets turnover ratio effective is organization in
utilization fixed assets to generate revenue. Fixed assets turnover ratio of
Commonwealth Bank of Australia for year 2016, 2017 and 2018 were 4.2%, 3.9% and
4.1% respectively. In graph below, it is observed that ratio decreased in 2017 and again
increased in 2018. This ratio is below industry average which means that more fixed
assets are employed by organization.
2016 2017 2018
0.04
0.04
0.05
0.04
0.04
0.04
Fixed Asset Turnover Ratio
Profitability ratios can be divided into two categories margin ratios and rate of
return ratios. Gross profit margin ratio of Commonwealth Bank of Australia in 2016,
2017 and 2018 were 50.08%, 52.86% and 53.10% in last three years from 2016 to
2018. Commonwealth Bank of Australia seems to effectively manage its primary
products and services. Increase in gross margin means increase in operating profit
End of preview
Want to access all the pages? Upload your documents or become a member.
Related Documents
Finance for Masters: Analysis of Commonwealth Bank of Australia and Australia and New Zealand Bank of Australialg...
|20
|4276
|97
Business And Corporation Law docx.lg...
|9
|1408
|14
Analysis of Commonwealth Bank's Acquisition of Bank Westlg...
|8
|1145
|92
Financial Analysis of Commonwealth Banklg...
|14
|4134
|64
Principles of Financial Markets: Reportlg...
|16
|3891
|42
Analysis of ANZ and Commonwealth Banks in the Australian Banking Sectorlg...
|11
|2869
|135