Financial Analysis of Caltex
VerifiedAdded on 2020/05/28
|16
|3410
|55
AI Summary
This assignment delves into a financial analysis of Caltex, a prominent oil and gas company. It examines various financial ratios and indicators to assess Caltex's profitability, financial health, and operational efficiency. The analysis considers factors such as revenue streams, cost structures, capital structure, and working capital management to provide insights into Caltex's overall financial performance.
Contribute Materials
Your contribution can guide someone’s learning journey. Share your
documents today.
Running head: FINANCE FOR BUSINESS - MASTERS
Finance for business – Masters
Name of the student
Name of the university
Author note
Finance for business – Masters
Name of the student
Name of the university
Author note
Secure Best Marks with AI Grader
Need help grading? Try our AI Grader for instant feedback on your assignments.
1FINANCE FOR BUSINESS – MASTERS
Table of Contents
1. Description of the company................................................................................................2
2. Specification of the structure of ownership governance.....................................................2
3. Key ratios of Caltex............................................................................................................3
4. Information from ASX website..........................................................................................5
5. Recent announcement.........................................................................................................8
6. Stock field...........................................................................................................................8
7. WACC (weighted average cost of capital).........................................................................9
8. Optimal debt structure......................................................................................................11
9. Dividend policy.................................................................................................................12
10. Recommendation...............................................................................................................12
Reference..................................................................................................................................14
2FINANCE FOR BUSINESS – MASTERS
1. Description of the company
Caltex Australia limited is the convenience retailer and transport fuel supplier
company based in Australia. Caltex is engaged in business of refining, purchasing, marketing,
distributing the petroleum products and operating the convenience stores all over Australia. It
operates through 2 segments that include Lytton and Supply and Marketing. The supply and
marketing division is the integrated supply chain for transport fuel and it delivers refined
products in international market and sells the lubricants, Caltex fuels and it has speciality
with regard to the convenience store goods and products through national network of Caltex
Woolworths, Caltex and the branded service stations of Ampol along with through non-
equity and company owned resellers and through direct sales. During the year 2016, the
company had 3166 employees in Australia that includes the employees from all the
subsidiaries under the control of the company (Caltex 2017).
2. Specification of the structure of ownership governance
i) Major substantial shareholders
More than 20% holding of shares – from the annual report of Caltex, it is identified
that there are no shareholder holing more than 20% shares.
More than 5% holding of shares – among the substantial shareholders of the company
Lazard Asset Management Pacific Co held 18,810,624 shares that comes to 7.21%,
BlackRock Group held 16,465,153 shares that comes to 6.09% and Westpac Banking
Corporation held 13,902,131 shares that comes to 5.33%.
ii) Name of main people
Chairman – Greig Gailey
Board members
Trevor Bourne – Non-executive director
3FINANCE FOR BUSINESS – MASTERS
Steven Gregg – Non-executive director
Bruce Morgan – Non-executive director
Penny Winn – Non-executive director
Barbara Ward AM – Non-executive director
CEO – Julian Segal
From the annual report of Caltex, it is recognized that none of the members from the
board holds more than 5% or 20% of shares and therefore does not included in the substantial
shareholder.
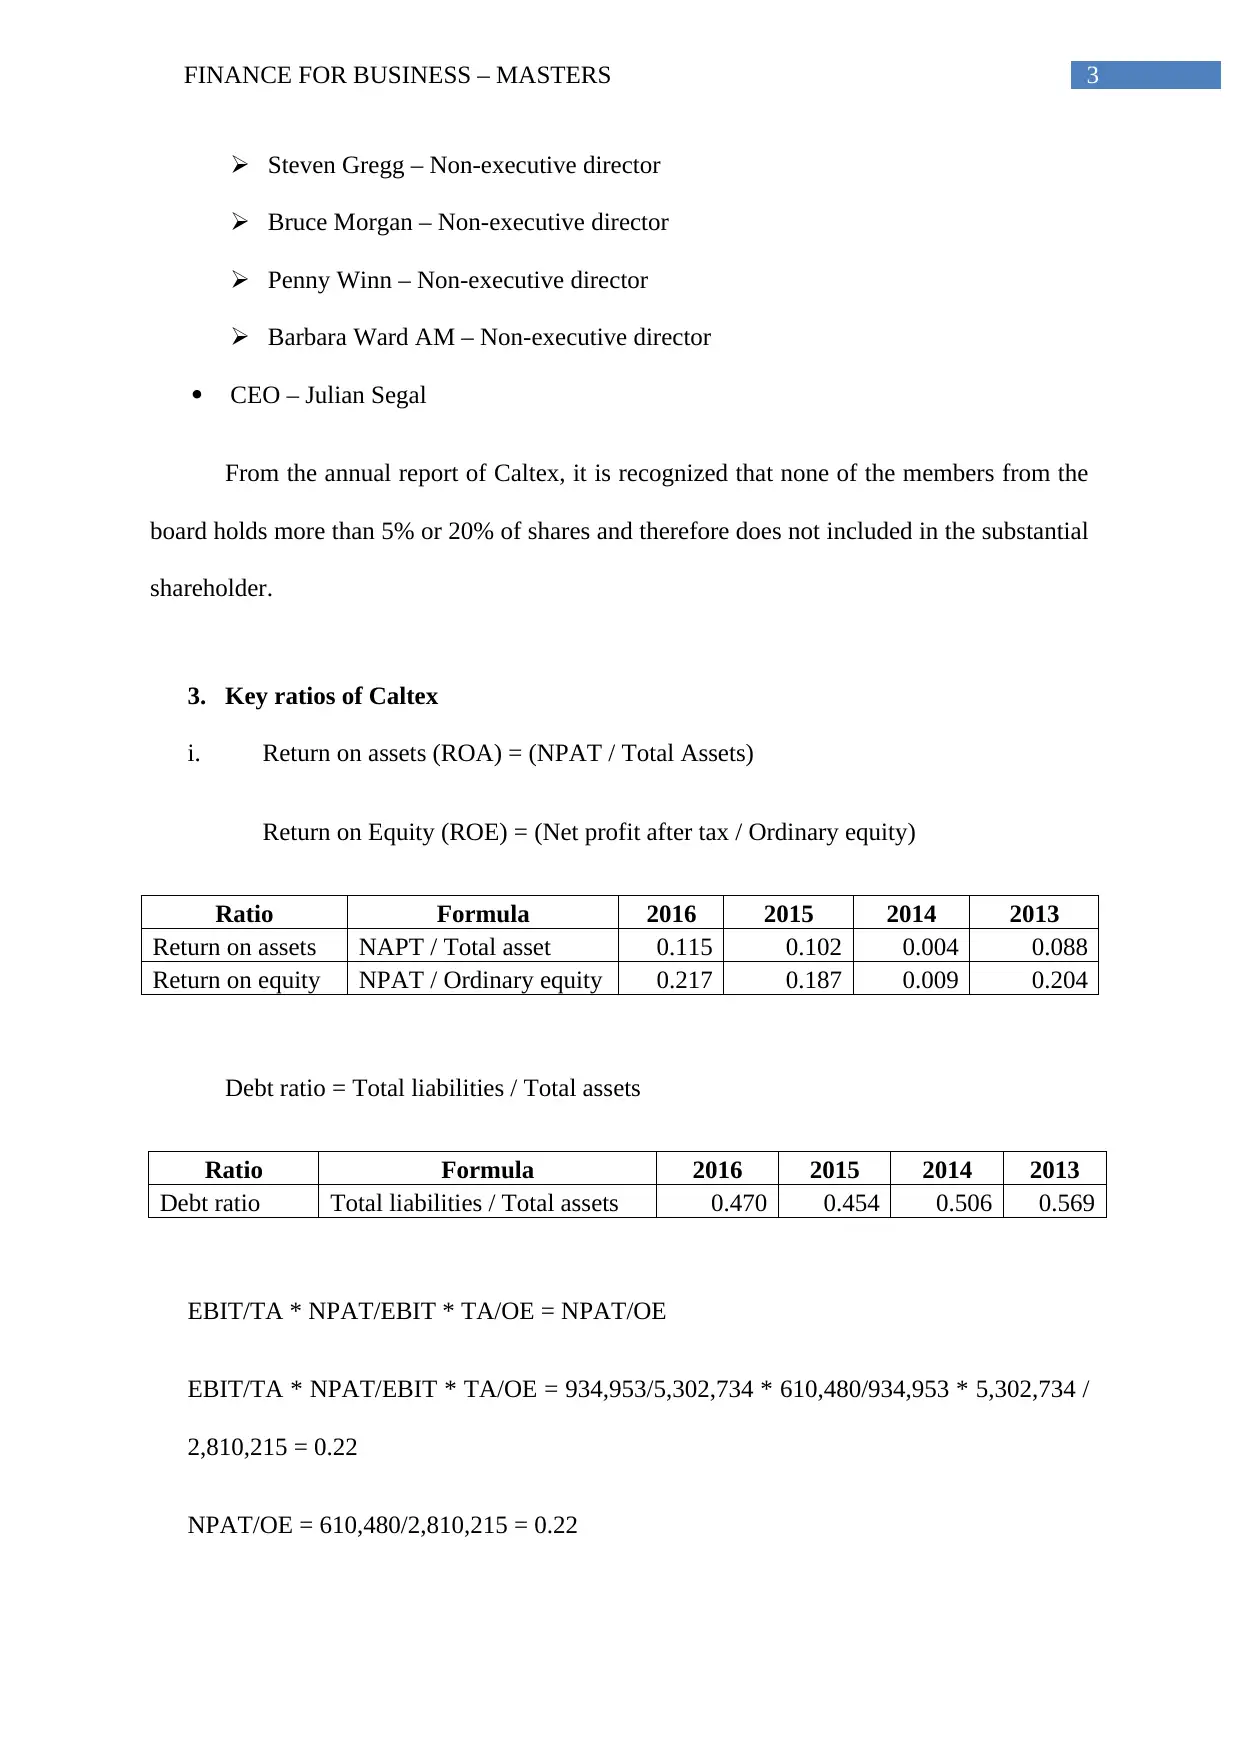
3. Key ratios of Caltex
i. Return on assets (ROA) = (NPAT / Total Assets)
Return on Equity (ROE) = (Net profit after tax / Ordinary equity)
Ratio Formula 2016 2015 2014 2013
Return on assets NAPT / Total asset 0.115 0.102 0.004 0.088
Return on equity NPAT / Ordinary equity 0.217 0.187 0.009 0.204
Debt ratio = Total liabilities / Total assets
Ratio Formula 2016 2015 2014 2013
Debt ratio Total liabilities / Total assets 0.470 0.454 0.506 0.569
EBIT/TA * NPAT/EBIT * TA/OE = NPAT/OE
EBIT/TA * NPAT/EBIT * TA/OE = 934,953/5,302,734 * 610,480/934,953 * 5,302,734 /
2,810,215 = 0.22
NPAT/OE = 610,480/2,810,215 = 0.22
Steven Gregg – Non-executive director
Bruce Morgan – Non-executive director
Penny Winn – Non-executive director
Barbara Ward AM – Non-executive director
CEO – Julian Segal
From the annual report of Caltex, it is recognized that none of the members from the
board holds more than 5% or 20% of shares and therefore does not included in the substantial
shareholder.
3. Key ratios of Caltex
i. Return on assets (ROA) = (NPAT / Total Assets)
Return on Equity (ROE) = (Net profit after tax / Ordinary equity)
Ratio Formula 2016 2015 2014 2013
Return on assets NAPT / Total asset 0.115 0.102 0.004 0.088
Return on equity NPAT / Ordinary equity 0.217 0.187 0.009 0.204
Debt ratio = Total liabilities / Total assets
Ratio Formula 2016 2015 2014 2013
Debt ratio Total liabilities / Total assets 0.470 0.454 0.506 0.569
EBIT/TA * NPAT/EBIT * TA/OE = NPAT/OE
EBIT/TA * NPAT/EBIT * TA/OE = 934,953/5,302,734 * 610,480/934,953 * 5,302,734 /
2,810,215 = 0.22
NPAT/OE = 610,480/2,810,215 = 0.22
Secure Best Marks with AI Grader
Need help grading? Try our AI Grader for instant feedback on your assignments.
4FINANCE FOR BUSINESS – MASTERS
Therefore, it is proved from the above computation that –
EBIT/TA * NPAT/EBIT * TA/OE = NPAT/OE
ii. Phenomenon captured by the variable TA/OE
The phenomenon for TA/OE states the company’s total asset as compared to the
ordinary equity of the company. It states the insolvency risks of the company and also reveals
the risks associated with the total assets of the company that is faced by the shareholders
(Akeem et al. 2014). The significance of total asset of the company in comparison to the
equity depends on the revenue of the company, economic status of the company, industry to
which it belongs and various other factors. When the total assets of the company increase it
will decrease the company’s return on assets and vice versa (Macdonald-Smith 2015).
Though no ideal value is there for total asset to ordinary equity ratio, a high ratio represents
that the entity is highly leveraged. Reason for high level of leverage is the higher level of
borrowed capital in the capital structure of the company (Baños-Caballero, García-Teruel and
Martínez-Solano 2014). However, high asset to equity ratio represents that the company is
exposed to sustainability risk as the higher level of risk will expose the company to interest
risk. On the contrary, if the company has lower total asset to ordinary equity ratio, it
represent that the company is lower leveraged and has strong position (Naser, Nuseibeh and
Al-Hadeya 2013). However, lower ratio represents that the company is missing out on the
business opportunities and is of conservative nature.
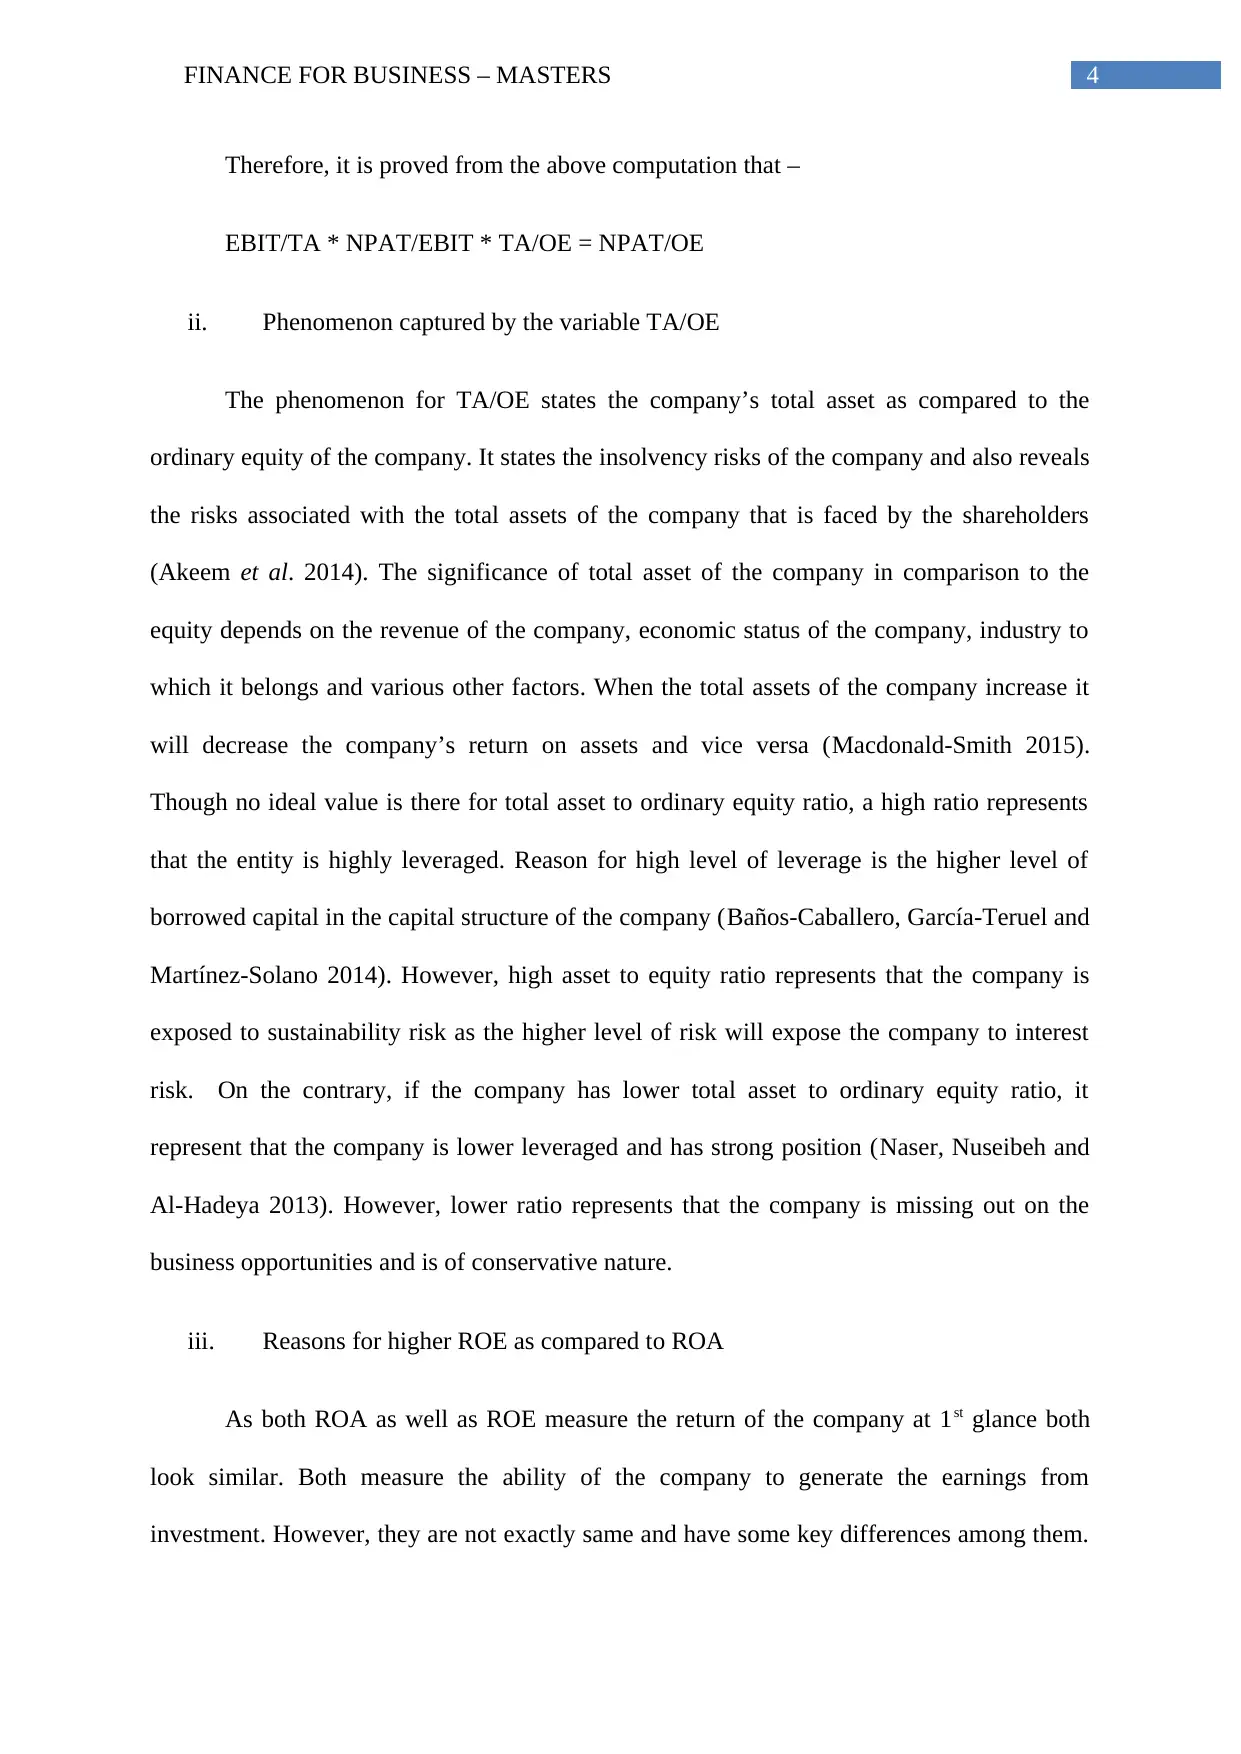
iii. Reasons for higher ROE as compared to ROA
As both ROA as well as ROE measure the return of the company at 1st glance both
look similar. Both measure the ability of the company to generate the earnings from
investment. However, they are not exactly same and have some key differences among them.
Therefore, it is proved from the above computation that –
EBIT/TA * NPAT/EBIT * TA/OE = NPAT/OE
ii. Phenomenon captured by the variable TA/OE
The phenomenon for TA/OE states the company’s total asset as compared to the
ordinary equity of the company. It states the insolvency risks of the company and also reveals
the risks associated with the total assets of the company that is faced by the shareholders
(Akeem et al. 2014). The significance of total asset of the company in comparison to the
equity depends on the revenue of the company, economic status of the company, industry to
which it belongs and various other factors. When the total assets of the company increase it
will decrease the company’s return on assets and vice versa (Macdonald-Smith 2015).
Though no ideal value is there for total asset to ordinary equity ratio, a high ratio represents
that the entity is highly leveraged. Reason for high level of leverage is the higher level of
borrowed capital in the capital structure of the company (Baños-Caballero, García-Teruel and
Martínez-Solano 2014). However, high asset to equity ratio represents that the company is
exposed to sustainability risk as the higher level of risk will expose the company to interest
risk. On the contrary, if the company has lower total asset to ordinary equity ratio, it
represent that the company is lower leveraged and has strong position (Naser, Nuseibeh and
Al-Hadeya 2013). However, lower ratio represents that the company is missing out on the
business opportunities and is of conservative nature.
iii. Reasons for higher ROE as compared to ROA
As both ROA as well as ROE measure the return of the company at 1st glance both
look similar. Both measure the ability of the company to generate the earnings from
investment. However, they are not exactly same and have some key differences among them.
5FINANCE FOR BUSINESS – MASTERS
However, they both together provide clear picture of the company’s performance. When the
shareholder’s equity is lower as compared to the total assets of the company, the ROE of the
company becomes higher than the ROA. The fundamental equation of the balance sheet is –
Assets = Shareholder’s equity + Liabilities. Therefore, the company takes on the financial
leverage, its ROE will be higher as compared to ROA. In other words, if the debt increases,
the equity decreases and as the equity is placed in the denominator of ROE, the ROE in turn
increases. Likewise, when the company taken on the debt, the denominator of ROA that is the
total asset will increase which in turn represents that the ROE will increase as compared to
ROA.
4. Information from ASX website
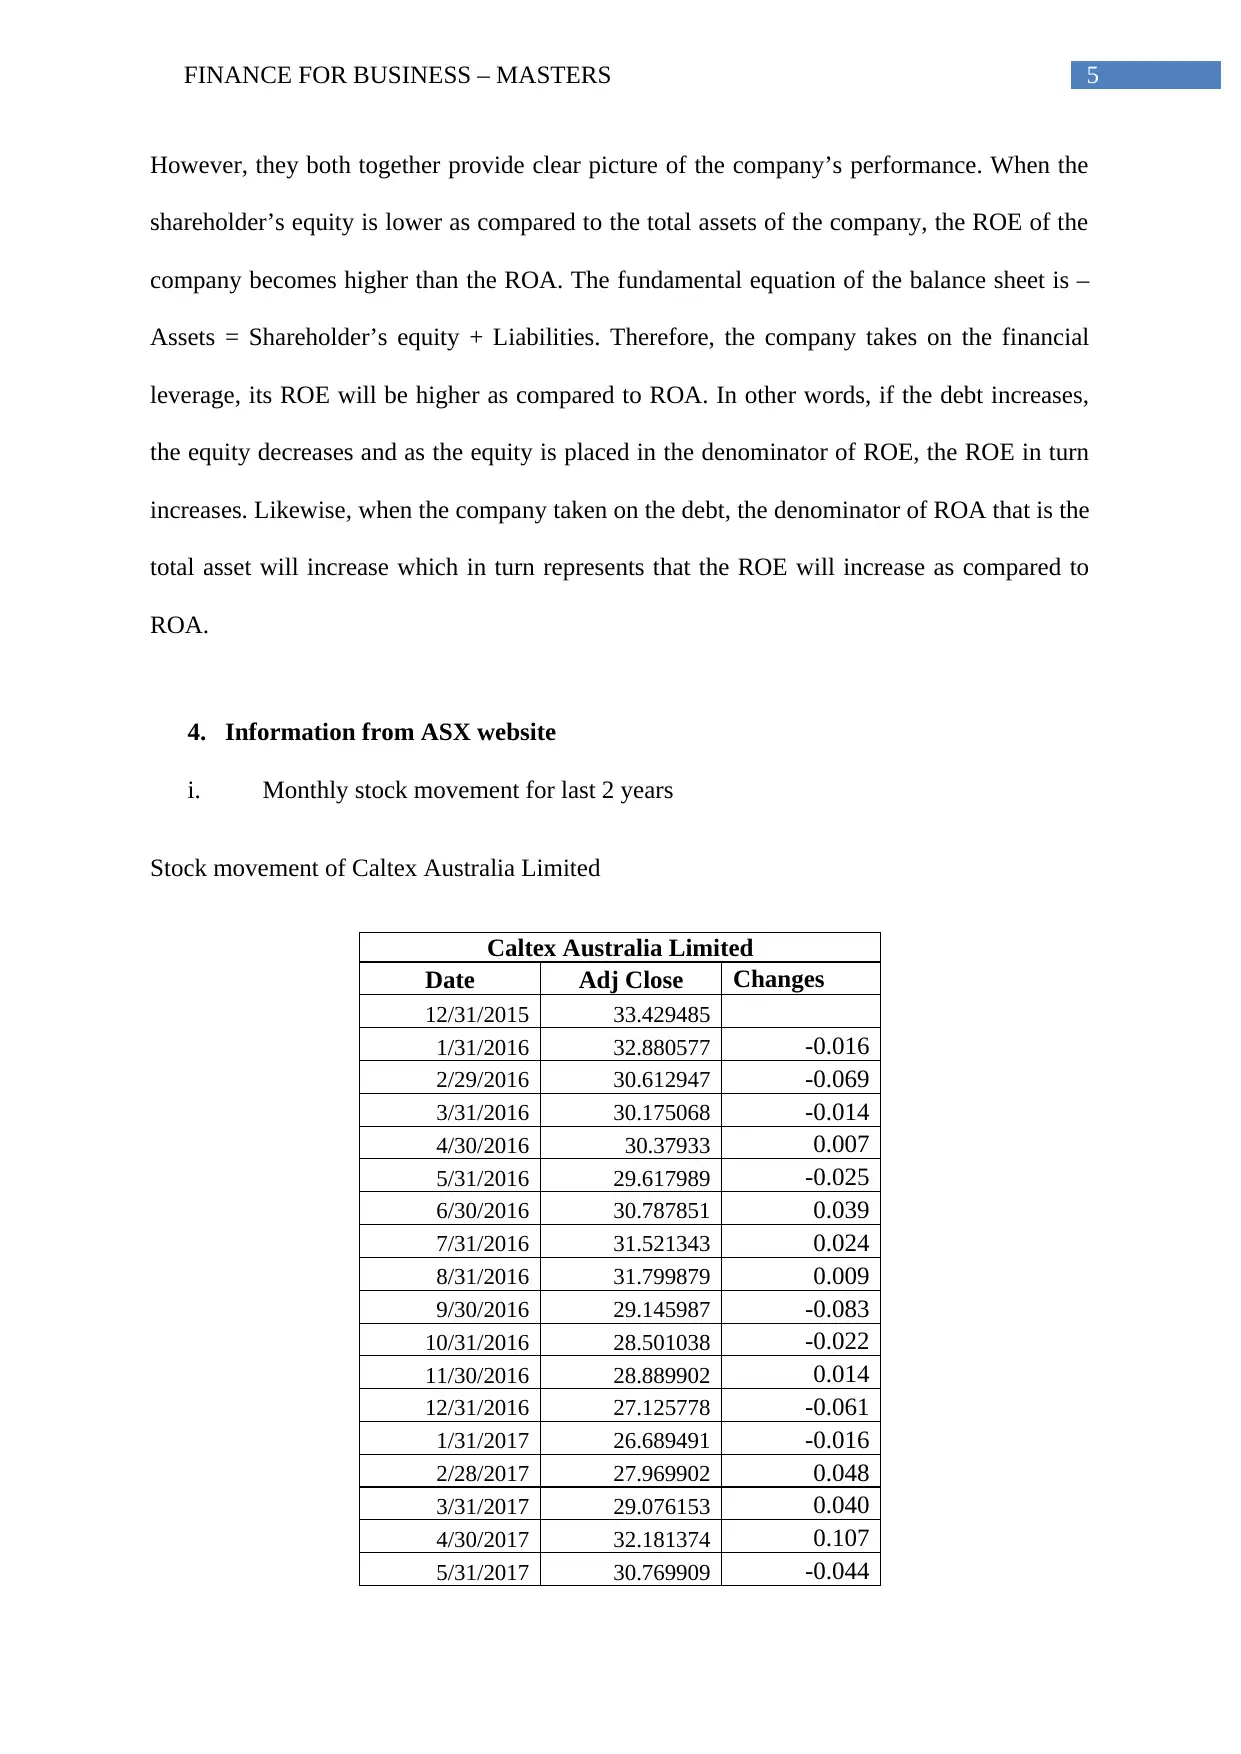
i. Monthly stock movement for last 2 years
Stock movement of Caltex Australia Limited
Caltex Australia Limited
Date Adj Close Changes
12/31/2015 33.429485
1/31/2016 32.880577 -0.016
2/29/2016 30.612947 -0.069
3/31/2016 30.175068 -0.014
4/30/2016 30.37933 0.007
5/31/2016 29.617989 -0.025
6/30/2016 30.787851 0.039
7/31/2016 31.521343 0.024
8/31/2016 31.799879 0.009
9/30/2016 29.145987 -0.083
10/31/2016 28.501038 -0.022
11/30/2016 28.889902 0.014
12/31/2016 27.125778 -0.061
1/31/2017 26.689491 -0.016
2/28/2017 27.969902 0.048
3/31/2017 29.076153 0.040
4/30/2017 32.181374 0.107
5/31/2017 30.769909 -0.044
However, they both together provide clear picture of the company’s performance. When the
shareholder’s equity is lower as compared to the total assets of the company, the ROE of the
company becomes higher than the ROA. The fundamental equation of the balance sheet is –
Assets = Shareholder’s equity + Liabilities. Therefore, the company takes on the financial
leverage, its ROE will be higher as compared to ROA. In other words, if the debt increases,
the equity decreases and as the equity is placed in the denominator of ROE, the ROE in turn
increases. Likewise, when the company taken on the debt, the denominator of ROA that is the
total asset will increase which in turn represents that the ROE will increase as compared to
ROA.
4. Information from ASX website
i. Monthly stock movement for last 2 years
Stock movement of Caltex Australia Limited
Caltex Australia Limited
Date Adj Close Changes
12/31/2015 33.429485
1/31/2016 32.880577 -0.016
2/29/2016 30.612947 -0.069
3/31/2016 30.175068 -0.014
4/30/2016 30.37933 0.007
5/31/2016 29.617989 -0.025
6/30/2016 30.787851 0.039
7/31/2016 31.521343 0.024
8/31/2016 31.799879 0.009
9/30/2016 29.145987 -0.083
10/31/2016 28.501038 -0.022
11/30/2016 28.889902 0.014
12/31/2016 27.125778 -0.061
1/31/2017 26.689491 -0.016
2/28/2017 27.969902 0.048
3/31/2017 29.076153 0.040
4/30/2017 32.181374 0.107
5/31/2017 30.769909 -0.044
6FINANCE FOR BUSINESS – MASTERS
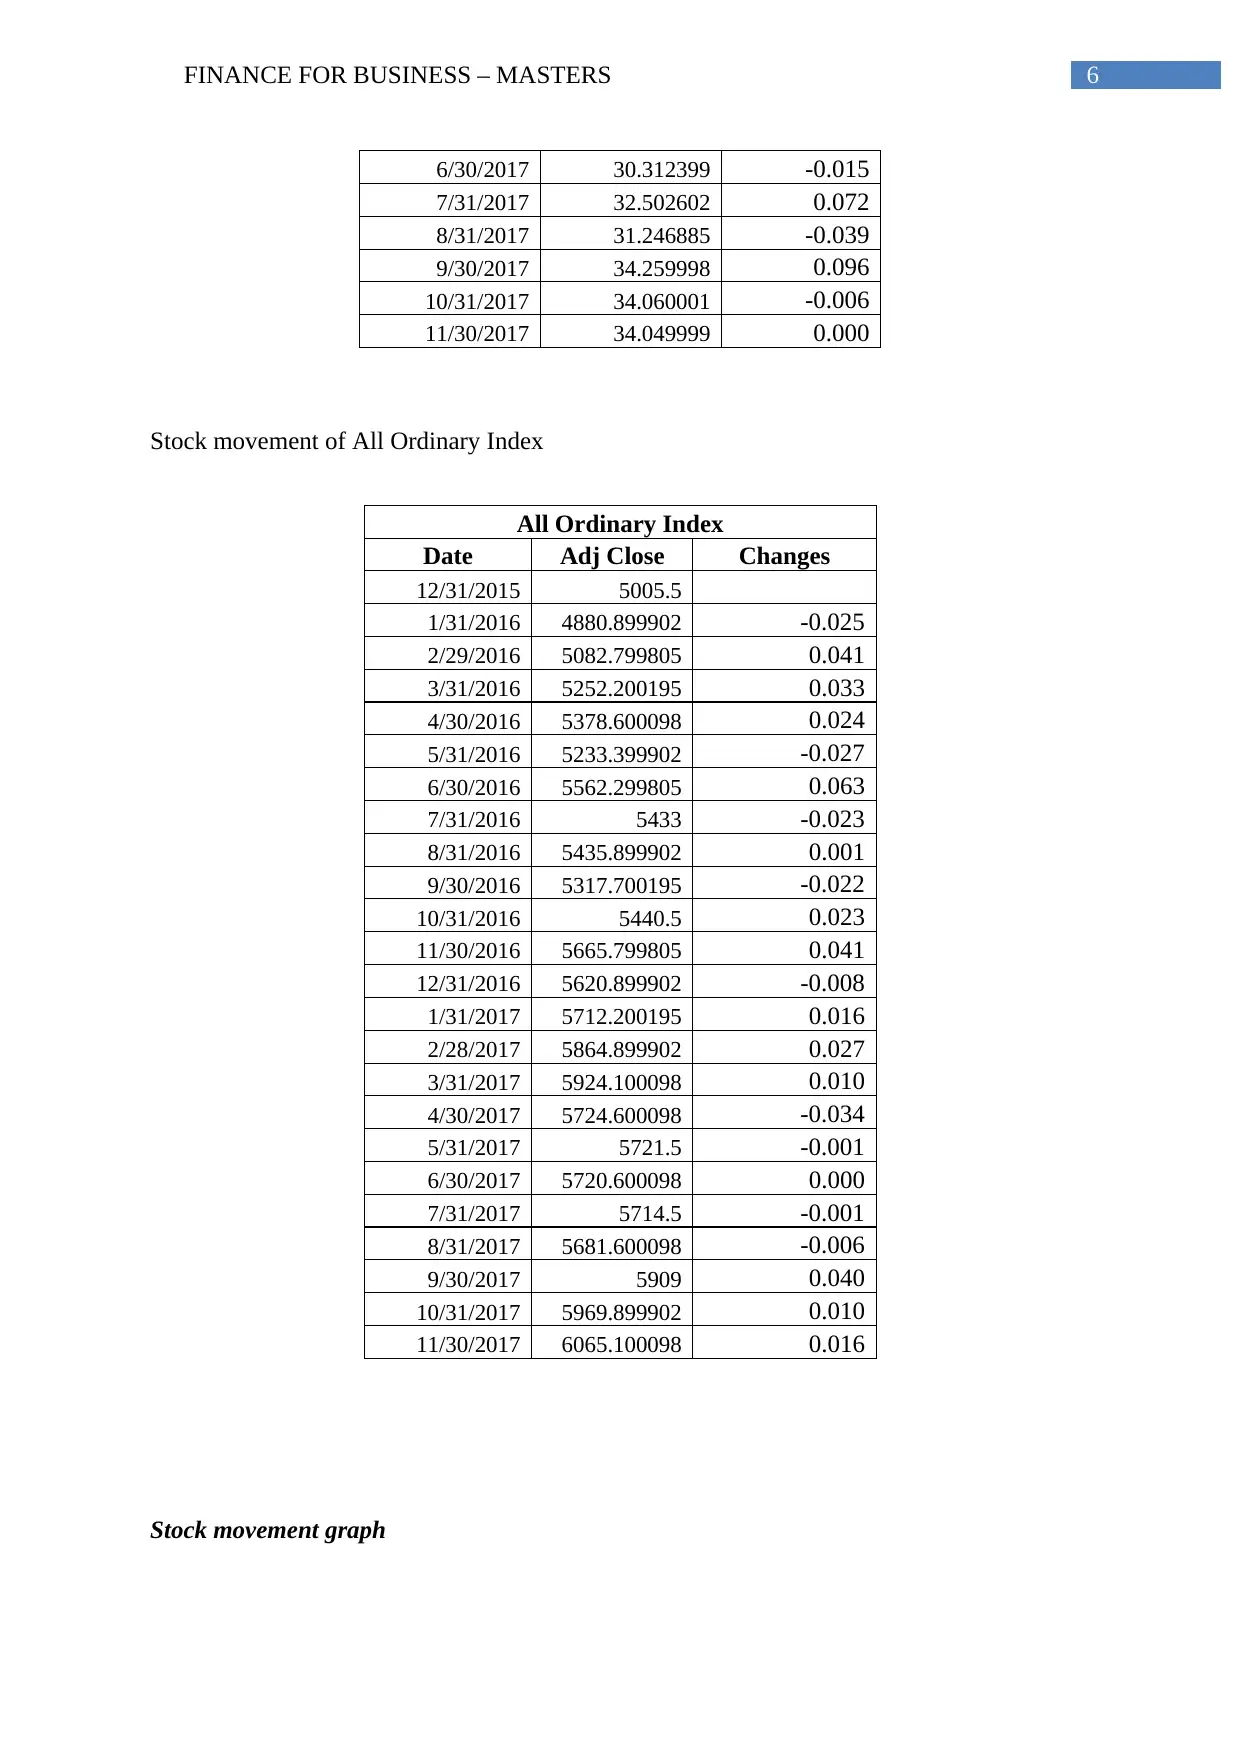
6/30/2017 30.312399 -0.015
7/31/2017 32.502602 0.072
8/31/2017 31.246885 -0.039
9/30/2017 34.259998 0.096
10/31/2017 34.060001 -0.006
11/30/2017 34.049999 0.000
Stock movement of All Ordinary Index
All Ordinary Index
Date Adj Close Changes
12/31/2015 5005.5
1/31/2016 4880.899902 -0.025
2/29/2016 5082.799805 0.041
3/31/2016 5252.200195 0.033
4/30/2016 5378.600098 0.024
5/31/2016 5233.399902 -0.027
6/30/2016 5562.299805 0.063
7/31/2016 5433 -0.023
8/31/2016 5435.899902 0.001
9/30/2016 5317.700195 -0.022
10/31/2016 5440.5 0.023
11/30/2016 5665.799805 0.041
12/31/2016 5620.899902 -0.008
1/31/2017 5712.200195 0.016
2/28/2017 5864.899902 0.027
3/31/2017 5924.100098 0.010
4/30/2017 5724.600098 -0.034
5/31/2017 5721.5 -0.001
6/30/2017 5720.600098 0.000
7/31/2017 5714.5 -0.001
8/31/2017 5681.600098 -0.006
9/30/2017 5909 0.040
10/31/2017 5969.899902 0.010
11/30/2017 6065.100098 0.016
Stock movement graph
Paraphrase This Document
Need a fresh take? Get an instant paraphrase of this document with our AI Paraphraser
7FINANCE FOR BUSINESS – MASTERS
01/12/2015
01/02/2016
01/04/2016
01/06/2016
01/08/2016
01/10/2016
01/12/2016
01/02/2017
01/04/2017
01/06/2017
01/08/2017
01/10/2017
0
5
10
15
20
25
30
35
40
Caltex Australia Limited
Adj Close
01/12/2015
01/02/2016
01/04/2016
01/06/2016
01/08/2016
01/10/2016
01/12/2016
01/02/2017
01/04/2017
01/06/2017
01/08/2017
01/10/2017
0
1000
2000
3000
4000
5000
6000
7000
All Ordinary Index
Adj Close
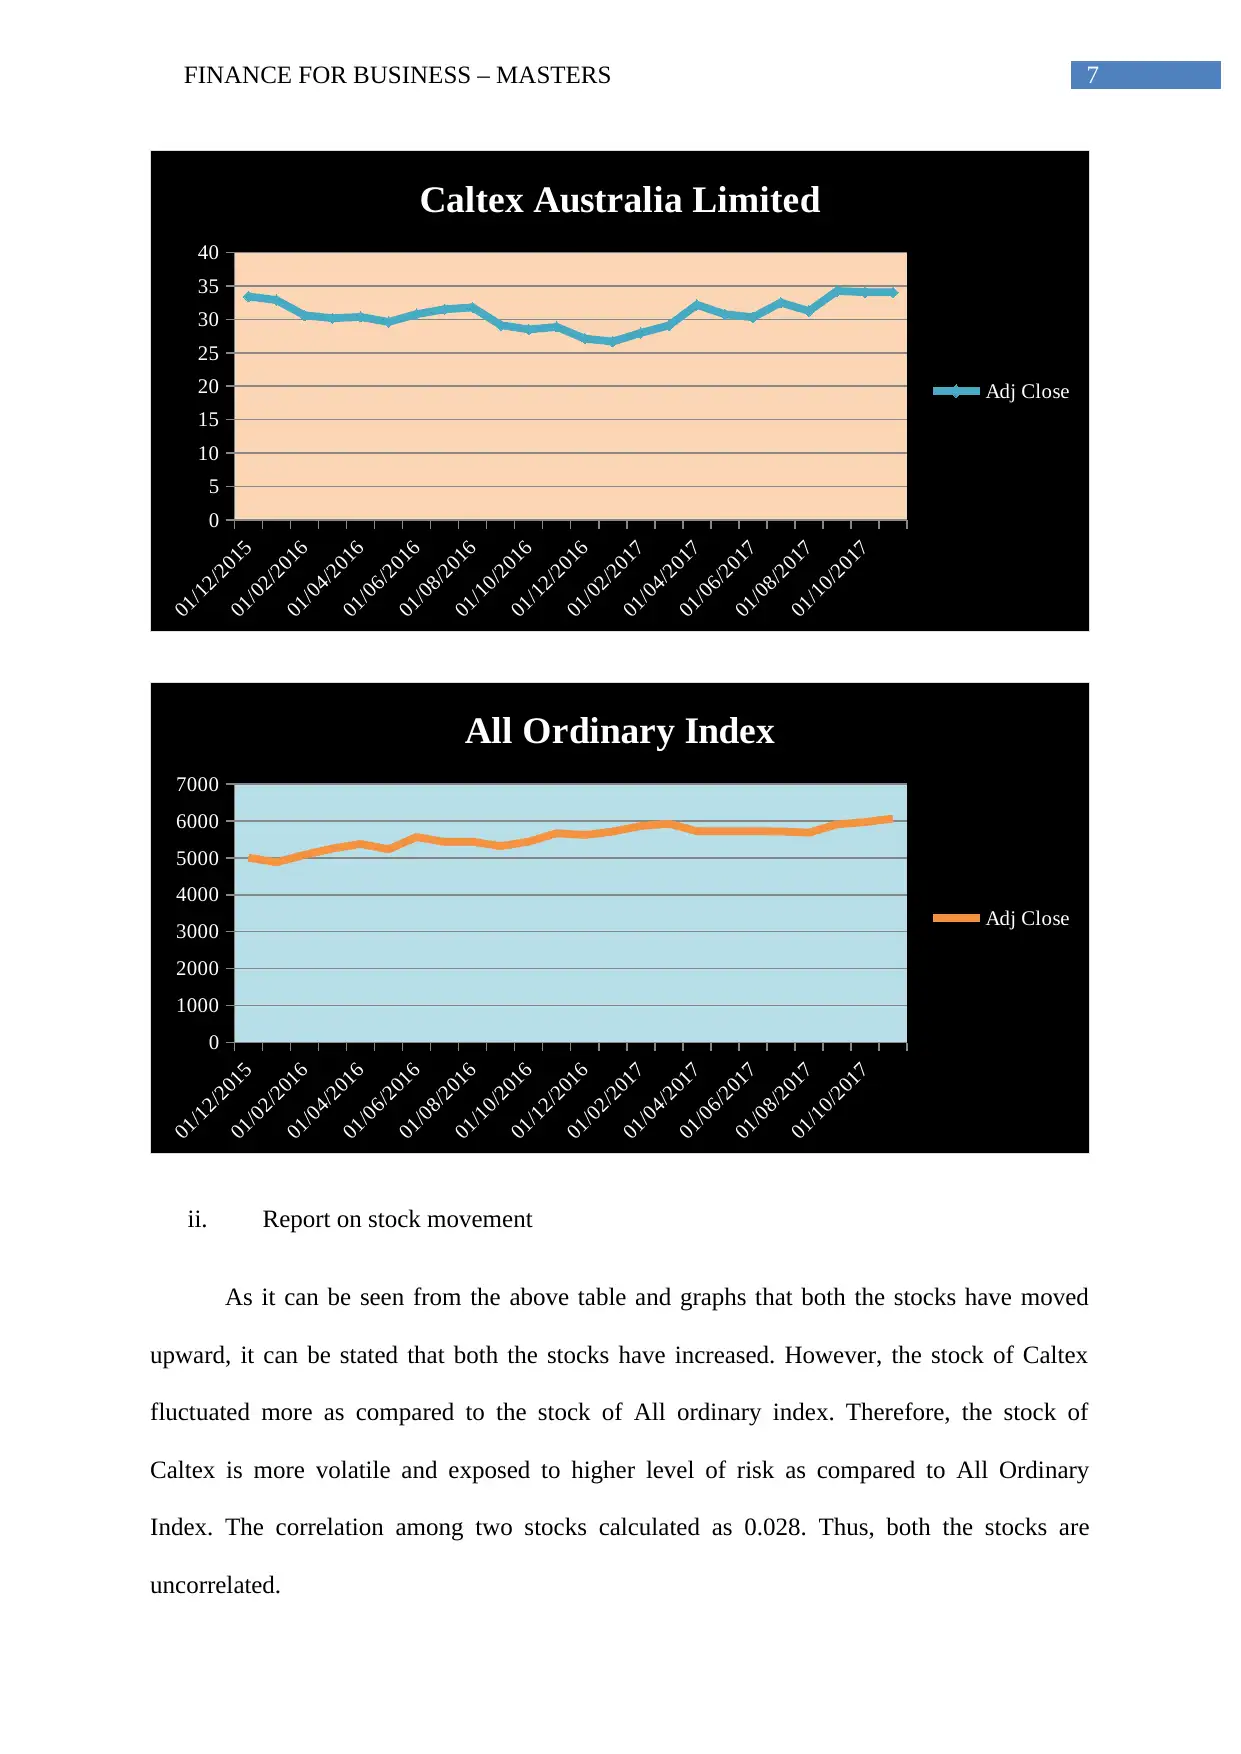
ii. Report on stock movement
As it can be seen from the above table and graphs that both the stocks have moved
upward, it can be stated that both the stocks have increased. However, the stock of Caltex
fluctuated more as compared to the stock of All ordinary index. Therefore, the stock of
Caltex is more volatile and exposed to higher level of risk as compared to All Ordinary
Index. The correlation among two stocks calculated as 0.028. Thus, both the stocks are
uncorrelated.
01/12/2015
01/02/2016
01/04/2016
01/06/2016
01/08/2016
01/10/2016
01/12/2016
01/02/2017
01/04/2017
01/06/2017
01/08/2017
01/10/2017
0
5
10
15
20
25
30
35
40
Caltex Australia Limited
Adj Close
01/12/2015
01/02/2016
01/04/2016
01/06/2016
01/08/2016
01/10/2016
01/12/2016
01/02/2017
01/04/2017
01/06/2017
01/08/2017
01/10/2017
0
1000
2000
3000
4000
5000
6000
7000
All Ordinary Index
Adj Close
ii. Report on stock movement
As it can be seen from the above table and graphs that both the stocks have moved
upward, it can be stated that both the stocks have increased. However, the stock of Caltex
fluctuated more as compared to the stock of All ordinary index. Therefore, the stock of
Caltex is more volatile and exposed to higher level of risk as compared to All Ordinary
Index. The correlation among two stocks calculated as 0.028. Thus, both the stocks are
uncorrelated.
8FINANCE FOR BUSINESS – MASTERS
5. Recent announcement
Towards the end of 4th quarter the company announced its 1st overseas acquisition that
is the purchase of the independent retailer of fuel Gull New Zealand. Entry in the
geographically advanced market of New Zealand is considered to be the logical
growth step for the company.
During August the company announced the commencement of construction for
upgrading $ 75 million investment which will be completed by end of the year 2017.
It is expected to increase the storage capacity of the company by additional 40 million
litres.
The company received the global innovation award for providing remediation facility
of Sydney soil. The facility was build and designed by Australian fuel supplier Caltex
for treating the contaminated soil.
The company opened a jet fuel pipeline amounting to $ 16 million for servicing the
Brisbane airport which is expected to underpin rapid expansion of international
aviation hub in next 20 years.
6. Stock field
i. Calculated beta of the company is 0.05
ii. Risk free rate = Rf = 4%, Market risk premium = Rm = 6%
Therefore, required rate of return of the company’s share =
R = Rf + β ( Rm – Rf )
R = 4% + 0.05* (6% – 4%) = 4.1%
iii. Conservative investment
9FINANCE FOR BUSINESS – MASTERS
It is the investment approach under which the value of the investment portfolio is
preserved through investment in the lower risks associated securities. An investment option
with regular income and fixed market securities are considered as conservative investment. a
conservative investment is also associated with higher return, lower beta and regular payment
for dividend (Heikal, Khaddafi and Ummah 2014). It is recognized from the above details
that the company’s beta is 0.05 which can be considered as low. Further, the company’s ROE
is better than the ROA. Further, the target payout ratio for dividend is 40 to 60% of RCOP
NPAT. To match this target it declared final dividend of 52 cents per share for 2 nd half of
2016 in addition to 50 cents per share for 1st half. This made the total dividend of 102 cents of
dividend per share for the year 2016 as compared to 117 cents dividend per share for the year
2015. Therefore, it can be stated that the company is regular in paying the dividend.
Therefore, Caltex Australia Limited will be regarded as conservative investment.
7. WACC (weighted average cost of capital)
i. Computation of WACC
WACC of the company calculated through proportionately weighting each category
of capital under the capital structure. For this purpose, all types of capital like equity capital,
preferred capital, common stock, bonds and long-term liabilities are taken into consideration
(Zabarankin, Pavlikov and Uryasev 2014). The weighted average cost of the capital for any
company increases with the increase in the beta as well as the return on equity rate. However,
if the WACC of the company goes up, the valuation of the company goes down and at the
same time the capital risk of the company increases. The WACC is computed as follows –
WACC = E/V * Re +D/V * Rd * (1-Tc), Where,
E/V = Equity percentage in the capital structure
Secure Best Marks with AI Grader
Need help grading? Try our AI Grader for instant feedback on your assignments.
10FINANCE FOR BUSINESS – MASTERS
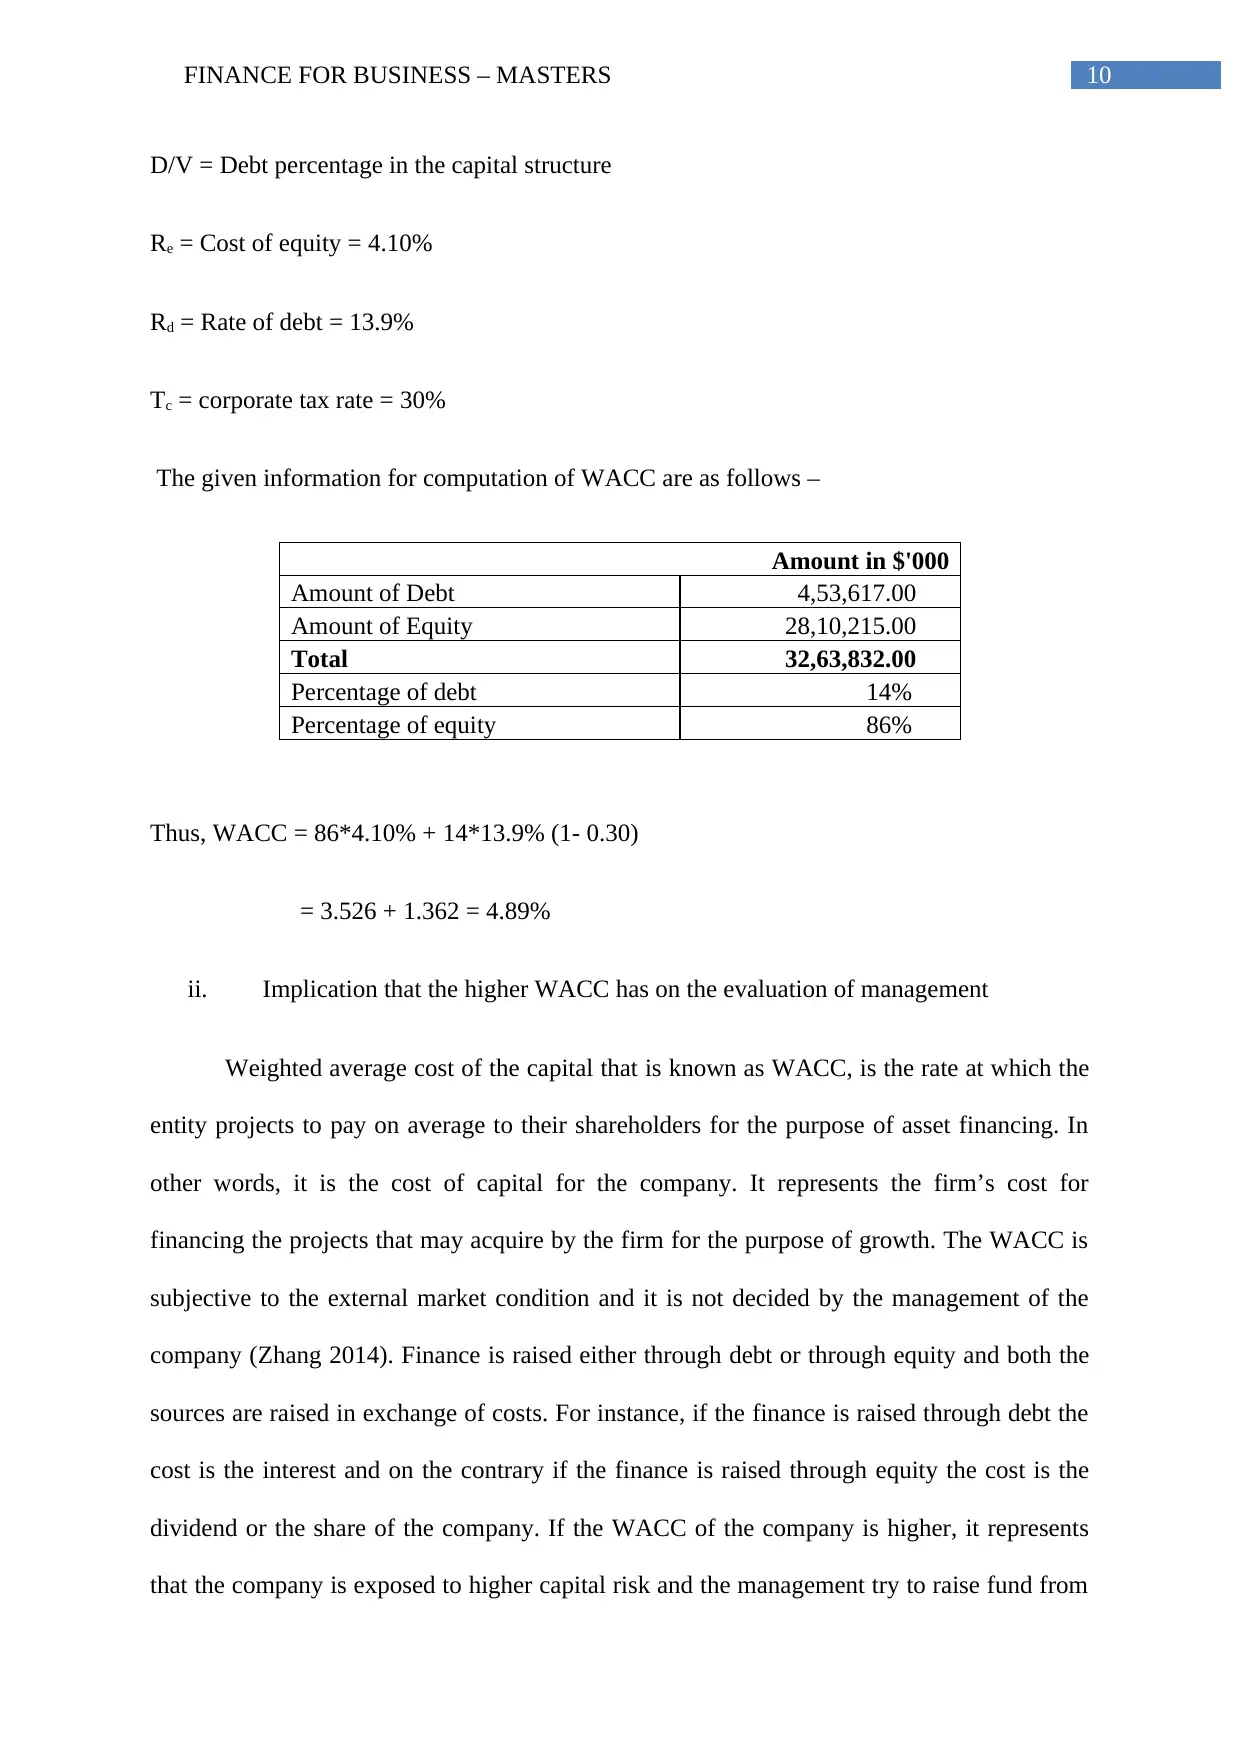
D/V = Debt percentage in the capital structure
Re = Cost of equity = 4.10%
Rd = Rate of debt = 13.9%
Tc = corporate tax rate = 30%
The given information for computation of WACC are as follows –
Amount in $'000
Amount of Debt 4,53,617.00
Amount of Equity 28,10,215.00
Total 32,63,832.00
Percentage of debt 14%
Percentage of equity 86%
Thus, WACC = 86*4.10% + 14*13.9% (1- 0.30)
= 3.526 + 1.362 = 4.89%
ii. Implication that the higher WACC has on the evaluation of management
Weighted average cost of the capital that is known as WACC, is the rate at which the
entity projects to pay on average to their shareholders for the purpose of asset financing. In
other words, it is the cost of capital for the company. It represents the firm’s cost for
financing the projects that may acquire by the firm for the purpose of growth. The WACC is
subjective to the external market condition and it is not decided by the management of the
company (Zhang 2014). Finance is raised either through debt or through equity and both the
sources are raised in exchange of costs. For instance, if the finance is raised through debt the
cost is the interest and on the contrary if the finance is raised through equity the cost is the
dividend or the share of the company. If the WACC of the company is higher, it represents
that the company is exposed to higher capital risk and the management try to raise fund from
11FINANCE FOR BUSINESS – MASTERS
cheaper source. It further indicates that the company is losing its worth and shall find for
more profitable and lower risk associated projects for investment.
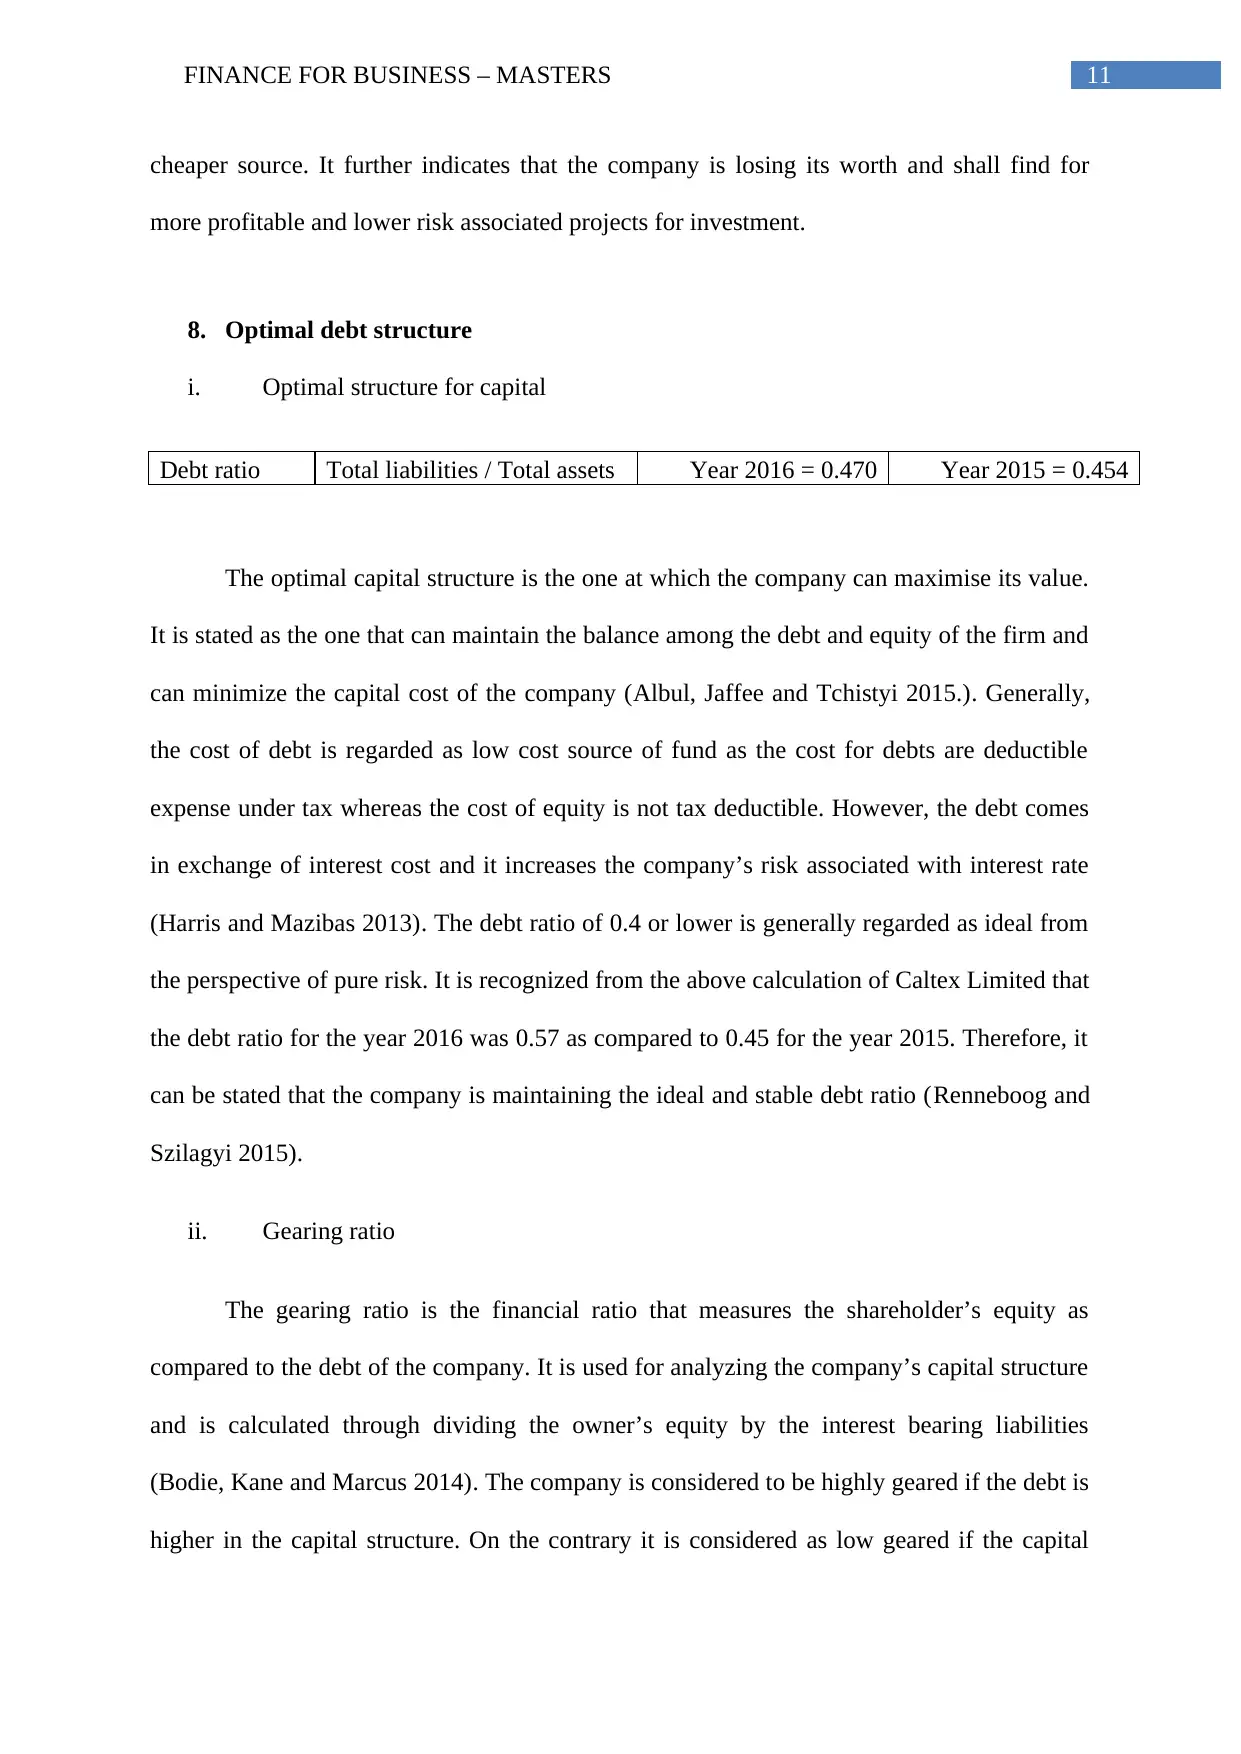
8. Optimal debt structure
i. Optimal structure for capital
Debt ratio Total liabilities / Total assets Year 2016 = 0.470 Year 2015 = 0.454
The optimal capital structure is the one at which the company can maximise its value.
It is stated as the one that can maintain the balance among the debt and equity of the firm and
can minimize the capital cost of the company (Albul, Jaffee and Tchistyi 2015.). Generally,
the cost of debt is regarded as low cost source of fund as the cost for debts are deductible
expense under tax whereas the cost of equity is not tax deductible. However, the debt comes
in exchange of interest cost and it increases the company’s risk associated with interest rate
(Harris and Mazibas 2013). The debt ratio of 0.4 or lower is generally regarded as ideal from
the perspective of pure risk. It is recognized from the above calculation of Caltex Limited that
the debt ratio for the year 2016 was 0.57 as compared to 0.45 for the year 2015. Therefore, it
can be stated that the company is maintaining the ideal and stable debt ratio (Renneboog and
Szilagyi 2015).
ii. Gearing ratio
The gearing ratio is the financial ratio that measures the shareholder’s equity as
compared to the debt of the company. It is used for analyzing the company’s capital structure
and is calculated through dividing the owner’s equity by the interest bearing liabilities
(Bodie, Kane and Marcus 2014). The company is considered to be highly geared if the debt is
higher in the capital structure. On the contrary it is considered as low geared if the capital
cheaper source. It further indicates that the company is losing its worth and shall find for
more profitable and lower risk associated projects for investment.
8. Optimal debt structure
i. Optimal structure for capital
Debt ratio Total liabilities / Total assets Year 2016 = 0.470 Year 2015 = 0.454
The optimal capital structure is the one at which the company can maximise its value.
It is stated as the one that can maintain the balance among the debt and equity of the firm and
can minimize the capital cost of the company (Albul, Jaffee and Tchistyi 2015.). Generally,
the cost of debt is regarded as low cost source of fund as the cost for debts are deductible
expense under tax whereas the cost of equity is not tax deductible. However, the debt comes
in exchange of interest cost and it increases the company’s risk associated with interest rate
(Harris and Mazibas 2013). The debt ratio of 0.4 or lower is generally regarded as ideal from
the perspective of pure risk. It is recognized from the above calculation of Caltex Limited that
the debt ratio for the year 2016 was 0.57 as compared to 0.45 for the year 2015. Therefore, it
can be stated that the company is maintaining the ideal and stable debt ratio (Renneboog and
Szilagyi 2015).
ii. Gearing ratio
The gearing ratio is the financial ratio that measures the shareholder’s equity as
compared to the debt of the company. It is used for analyzing the company’s capital structure
and is calculated through dividing the owner’s equity by the interest bearing liabilities
(Bodie, Kane and Marcus 2014). The company is considered to be highly geared if the debt is
higher in the capital structure. On the contrary it is considered as low geared if the capital
12FINANCE FOR BUSINESS – MASTERS
structure is composed of more equity. as the capital structure of the company composed of
14% debt and 86% equity, to adjust the gearing ration the company increased its long-term
borrowings from $ 695,238 in 2015 to $ 698,340 in 2016. Further, the company made
buyback of shares amounting to $ 18,471 in the year 2016. However, nothing is mentioned in
the director’s report regarding the adjustments (Halili, Saleh and Zeitun 2015).
9. Dividend policy
The provision for dividend payable is accounted for the total undistributed amount in
the reporting period during which the dividends are declared (Ajanthan 2013). The company
follows the target payout ratio for paying the dividend from 40 to 60% of RCOP NPAT. To
match this target it declared final dividend of 52 cents per share for 2nd half of 2016 in
addition to 50 cents per share for 1st half. This made the total dividend of 102 cents of
dividend per share for the year 2016 as compared to 117 cents dividend per share for the year
2015. Therefore, it can be stated that the company is regular in paying the dividend (He and
Krishnamurthy 2013).
10. Recommendation
It can be recommended from the above analysis that the client must include Caltex
Australia Limited in his investment portfolio. The reason in support of this is that the
company improved its ROA as well as ROE in 2016 as compared to the year 2015. Further,
the beta of the company is as low as 0.05 that indicates that the company is exposed to low
level of risk. Moreover, if the dividend policy of the company considered, it is found that the
company is regular in paying dividend and therefore for the investor, the stock of Caltex will
be regular source of income. In addition, it is recognized that the debt ratio of the company
over the last 4 years are stable and balanced. Therefore, as the stock of Caltex fulfils all the
Paraphrase This Document
Need a fresh take? Get an instant paraphrase of this document with our AI Paraphraser
13FINANCE FOR BUSINESS – MASTERS
basic criteria of an investor for considering a sock for investment, it shall be included in the
investment portfolio of the client.
basic criteria of an investor for considering a sock for investment, it shall be included in the
investment portfolio of the client.
14FINANCE FOR BUSINESS – MASTERS
Reference
Ajanthan, A., 2013. The relationship between dividend payout and firm profitability: A study
of listed hotels and restaurant companies in Sri Lanka. International Journal of Scientific and
Research Publications, 3(6), pp.1-6.
Akeem, L.B., Terer, E.K., Kiyanjui, M.W. and Kayode, A.M., 2014. Effects of capital
structure on firm’s performance: Empirical study of manufacturing companies in
Nigeria. Journal of Finance and Investment Analysis, 3(4), pp.39-57.
Albul, B., Jaffee, D.M. and Tchistyi, A., 2015. Contingent convertible bonds and capital
structure decisions.
Baños-Caballero, S., García-Teruel, P.J. and Martínez-Solano, P., 2014. Working capital
management, corporate performance, and financial constraints. Journal of Business
Research, 67(3), pp.332-338.
Bodie, Z., Kane, A. and Marcus, A.J., 2014. Investments, 10e. McGraw-Hill Education.
Caltex., 2017. Home - Caltex. [online] Available at: http://caltex.com.au/ [Accessed 17 Jan.
2018].
Halili, E, Saleh, A and Zeitun, R., 2015. 'Governance and Long-Term Operating Performance of
Family and Non-Family Firms in Australia', Studies in Economics and Finance, vol.32, no.4,
pp.398-421.
Harris, R.D. and Mazibas, M., 2013. Dynamic hedge fund portfolio construction: A semi-
parametric approach. Journal of Banking & Finance, 37(1), pp.139-149.
He, Z. and Krishnamurthy, A., 2013. Intermediary asset pricing. The American Economic
Review, 103(2), pp.732-770.
15FINANCE FOR BUSINESS – MASTERS
Heikal, M., Khaddafi, M. and Ummah, A., 2014. Influence analysis of return on assets
(ROA), return on equity (ROE), net profit margin (NPM), debt to equity ratio (DER), and
current ratio (CR), against corporate profit growth in automotive in Indonesia stock
exchange. International Journal of Academic Research in Business and Social
Sciences, 4(12), p.101.
Macdonald-Smith, A., 2015. Caltex profit benefits from supply chain.
Naser, K.A.M.A.L., Nuseibeh, R.A.N.A. and Al-Hadeya, A.H.M.E.D., 2013. Factors
influencing Corporate working capital management: Evidence from an Emerging
Economy. Journal of Contemporary Issues in Business Research, 2(1), pp.11-30.
Renneboog, L. and Szilagyi, P.G., 2015. How relevant is dividend policy under low
shareholder protection?. Journal of International Financial Markets, Institutions and Money.
Zabarankin, M., Pavlikov, K. and Uryasev, S., 2014. Capital asset pricing model (CAPM)
with drawdown measure. European Journal of Operational Research, 234(2), pp.508-517.
Zhang, Z., 2014. On a risk model with randomized dividend-decision times. Journal of
Industrial & Management Optimization, 10(4), pp.1041-1058.
1 out of 16
Related Documents


Your All-in-One AI-Powered Toolkit for Academic Success.
+13062052269
info@desklib.com
Available 24*7 on WhatsApp / Email
![[object Object]](/_next/static/media/star-bottom.7253800d.svg)
Unlock your academic potential
© 2024 | Zucol Services PVT LTD | All rights reserved.