Finance for Business – Masters
Added on 2020-05-28
16 Pages3410 Words55 Views
Running head: FINANCE FOR BUSINESS - MASTERSFinance for business – MastersName of the studentName of the universityAuthor note
1FINANCE FOR BUSINESS – MASTERS Table of Contents1.Description of the company................................................................................................22.Specification of the structure of ownership governance.....................................................23.Key ratios of Caltex............................................................................................................34.Information from ASX website..........................................................................................55.Recent announcement.........................................................................................................86.Stock field...........................................................................................................................87.WACC (weighted average cost of capital).........................................................................98.Optimal debt structure......................................................................................................119.Dividend policy.................................................................................................................1210. Recommendation...............................................................................................................12Reference..................................................................................................................................14
2FINANCE FOR BUSINESS – MASTERS 1.Description of the companyCaltex Australia limited is the convenience retailer and transport fuel suppliercompany based in Australia. Caltex is engaged in business of refining, purchasing, marketing,distributing the petroleum products and operating the convenience stores all over Australia. Itoperates through 2 segments that include Lytton and Supply and Marketing. The supply andmarketing division is the integrated supply chain for transport fuel and it delivers refinedproducts in international market and sells the lubricants, Caltex fuels and it has specialitywith regard to the convenience store goods and products through national network of CaltexWoolworths, Caltex and the branded service stations of Ampol along with through non-equity and company owned resellers and through direct sales. During the year 2016, thecompany had 3166 employees in Australia that includes the employees from all thesubsidiaries under the control of the company (Caltex 2017).2.Specification of the structure of ownership governancei)Major substantial shareholders More than 20% holding of shares – from the annual report of Caltex, it is identifiedthat there are no shareholder holing more than 20% shares. More than 5% holding of shares – among the substantial shareholders of the companyLazard Asset Management Pacific Co held 18,810,624 shares that comes to 7.21%,BlackRock Group held 16,465,153 shares that comes to 6.09% and Westpac BankingCorporation held 13,902,131 shares that comes to 5.33%. ii)Name of main people Chairman – Greig GaileyBoard membersTrevor Bourne – Non-executive director
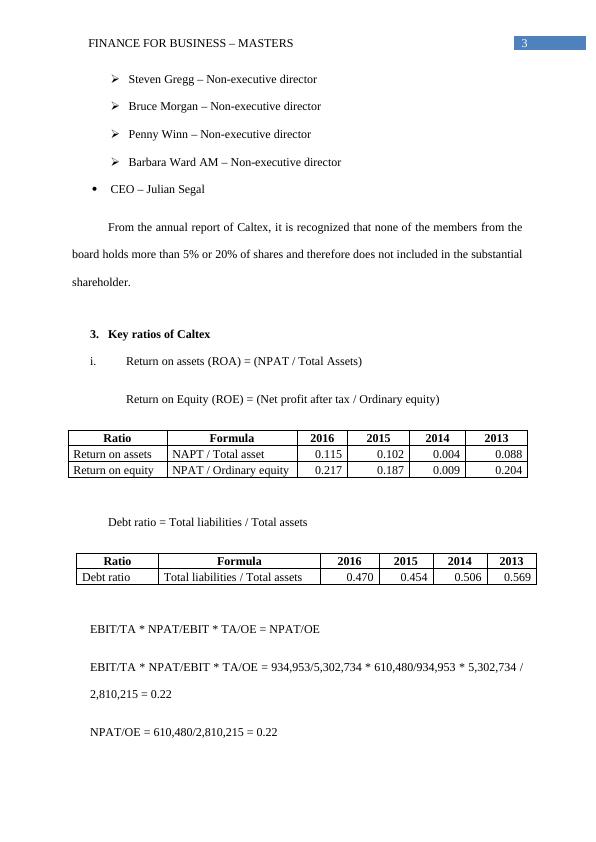
3FINANCE FOR BUSINESS – MASTERS Steven Gregg – Non-executive directorBruce Morgan – Non-executive directorPenny Winn – Non-executive directorBarbara Ward AM – Non-executive directorCEO – Julian SegalFrom the annual report of Caltex, it is recognized that none of the members from theboard holds more than 5% or 20% of shares and therefore does not included in the substantialshareholder.3.Key ratios of Caltex i.Return on assets (ROA) = (NPAT / Total Assets)Return on Equity (ROE) = (Net profit after tax / Ordinary equity)RatioFormula2016201520142013Return on assetsNAPT / Total asset0.1150.1020.0040.088Return on equityNPAT / Ordinary equity0.2170.1870.0090.204Debt ratio = Total liabilities / Total assetsRatioFormula2016201520142013Debt ratio Total liabilities / Total assets0.4700.4540.5060.569EBIT/TA * NPAT/EBIT * TA/OE = NPAT/OEEBIT/TA * NPAT/EBIT * TA/OE = 934,953/5,302,734 * 610,480/934,953 * 5,302,734 /2,810,215 = 0.22NPAT/OE = 610,480/2,810,215 = 0.22
End of preview
Want to access all the pages? Upload your documents or become a member.
Related Documents
Report on Masters In Financelg...
|9
|1646
|38
HI5002 Masters in Finance for Businesslg...
|9
|1905
|25
Finance for Business - Masterslg...
|13
|2409
|30
Assignment on Finance for Businesslg...
|13
|2488
|60
HI5002 Masters in Business Finance - Assignmentlg...
|10
|1643
|56
Business Finance Assignment - Oil Search Limitedlg...
|16
|3257
|80