Finance for Business: Financial Analysis of Caltex Australian Ltd.
VerifiedAdded on 2022/11/28
|21
|4008
|197
AI Summary
This report provides a comprehensive financial analysis of Caltex Australian Ltd., including ratio analysis, cash management, sensitivity analysis, systematic and unsystematic risk, dividend payout ratio, and recommendations for improvement.
Contribute Materials
Your contribution can guide someone’s learning journey. Share your
documents today.
Running head: Finance for business
Finance for business
Finance for business
Secure Best Marks with AI Grader
Need help grading? Try our AI Grader for instant feedback on your assignments.
Finance for business
Abstract
Financial analysis is the main concept and all the companies are required to perform this. By the
help of this, it is possible to evaluate the financial position of the business and then take the
required actions. The report has been prepared in this context and here the evaluation for Caltex
Australian Ltd. has been made. The details in regards to the company have been collected and
then they have been used to carry out various analyses for performance evaluation. The ratio
analysis has helped in ascertain the relationships that exist and with that, the position of the
business in terms of profitability is identified. The sensitivity analysis is performed to determine
the variable which is most variable. The cash management shall be strong and all the concepts
for the same have been considered. All of the risks which are involved in the business have been
ascertained and then the recommendations for their improvement have been provided.
2
Finance for business
Table of Contents
Abstract............................................................................................................................................2
Introduction......................................................................................................................................4
Caltex Australian Limited and its financial analysis.......................................................................4
Company’s overview...................................................................................................................4
Ratio analysis...............................................................................................................................5
Analysis of Cash management.....................................................................................................8
Sensitivity analysis......................................................................................................................9
Systematic and un-systematic risk.............................................................................................10
Dividend payout ratio and dividend policy...............................................................................11
Recommendations..........................................................................................................................12
Conclusion.....................................................................................................................................12
References......................................................................................................................................14
Appendix 1.....................................................................................................................................17
3
Finance for business
Introduction
In the global market, it is necessary that continuous improvement shall be made in the business
to maintain its position and also to further enhance the same. The report is prepared in respect of
the financial analysis which is performed for Caltex Australia Ltd. there is the coverage of the
description of the company in this report. All the details will be provided in that and also the
products and areas in which the operations are performed by the business will be determined.
There will be the performance of the ratio analysis for the past years in which the measurement
for the performance will be made and then the trend in the same will be calculated and
represented on the graph. The marketable securities which are held by the company shall be
identified and by the use of that the position of the company in cash aspect will be ascertained.
There will be an undertaking of this process so that cash management is made in the most
effective manner. The sensitivity analysis is important as by that the impact on the variable is
identified and that will be performed in the report below. All the factors in relation to net present
value will be covered in this. There will be involvement of the systematic and unsystematic risks
which are involved in the business. The risk and their impact will be analyzed so that they can be
avoided in the coming period. The dividend policy of the company will be undertaken and there
will be a calculation of the dividend payout ratio. This will be useful for the investors to take
further decisions and also recommendations will be provided on the basis of all the findings
which will be made.
Caltex Australian Limited and its financial analysis
Company's Overview
Caltex Australian limited is the company which is established in Australia and deals in the
transportation of the fuel and also the convenience retailer. The main operations which are
performed by the company are purchase, distribution, and selling of the petroleum products
(Caltex Australia Limited, 2019). The company operates in many countries and that involves
New Zealand, Australia, and Singapore. The various segments through which the operations are
carried by the company include infrastructure segment, fuels, and convenience retail. There are
various stores which are involved in the network of Caltex and all the working is carried through
4
Secure Best Marks with AI Grader
Need help grading? Try our AI Grader for instant feedback on your assignments.
Finance for business
them (Bloomberg, 2019). There are various depots and pipelines which are used by fuel and
infrastructure segment.
The company enjoys various comparative advantages over others such as there is a better facility
for the supply and also the marketing infrastructure of the business is strong. By the help of this,
it is able to provide the facilities which are above other competitors. As there is growth which is
experienced in the marketing sector so this has led to the enhancement in the profitability of
Caltex (Mbaskool, 2019). There are various acquisitions which are made and by the help of that
a continuous increase has been observed in the revenues.
Ratio analysis
The performance of the company is required to be evaluated and that too on a timely basis. In
that, there will be the use of some of the other technique which helps in the ascertainment of the
correct results. This will be done with the help of ratio analysis in the given assignment
(Efinance management, 2019). The ratio is the comparison of the two aspects of the business so
that the relation between them can be evaluated and monitors. The results which will be obtained
will be used for the analyzation of the performance. After that, it will be possible for the
company to use the outcomes in the making of the required decisions for the coming period
(Thebalancesmb, 2019). The efficiency and profitability with which the operations are carried in
the company will be ascertained with the use of the ratios calculated in this respect.
Particulars 2015 2016 2017 2018
Net profit 610482 620752 561590
Equity 2797399 3094418 3376007
Sales 17933201 17933201 21731342
Inventories 969885 1080920 1694915 1616125
5
Finance for business
Average Inventories 1025402.5 1387918 1655520
Total assets 5104741 5302734 6355220 6727623
Average
assets
5203737.5 5828977 6541422
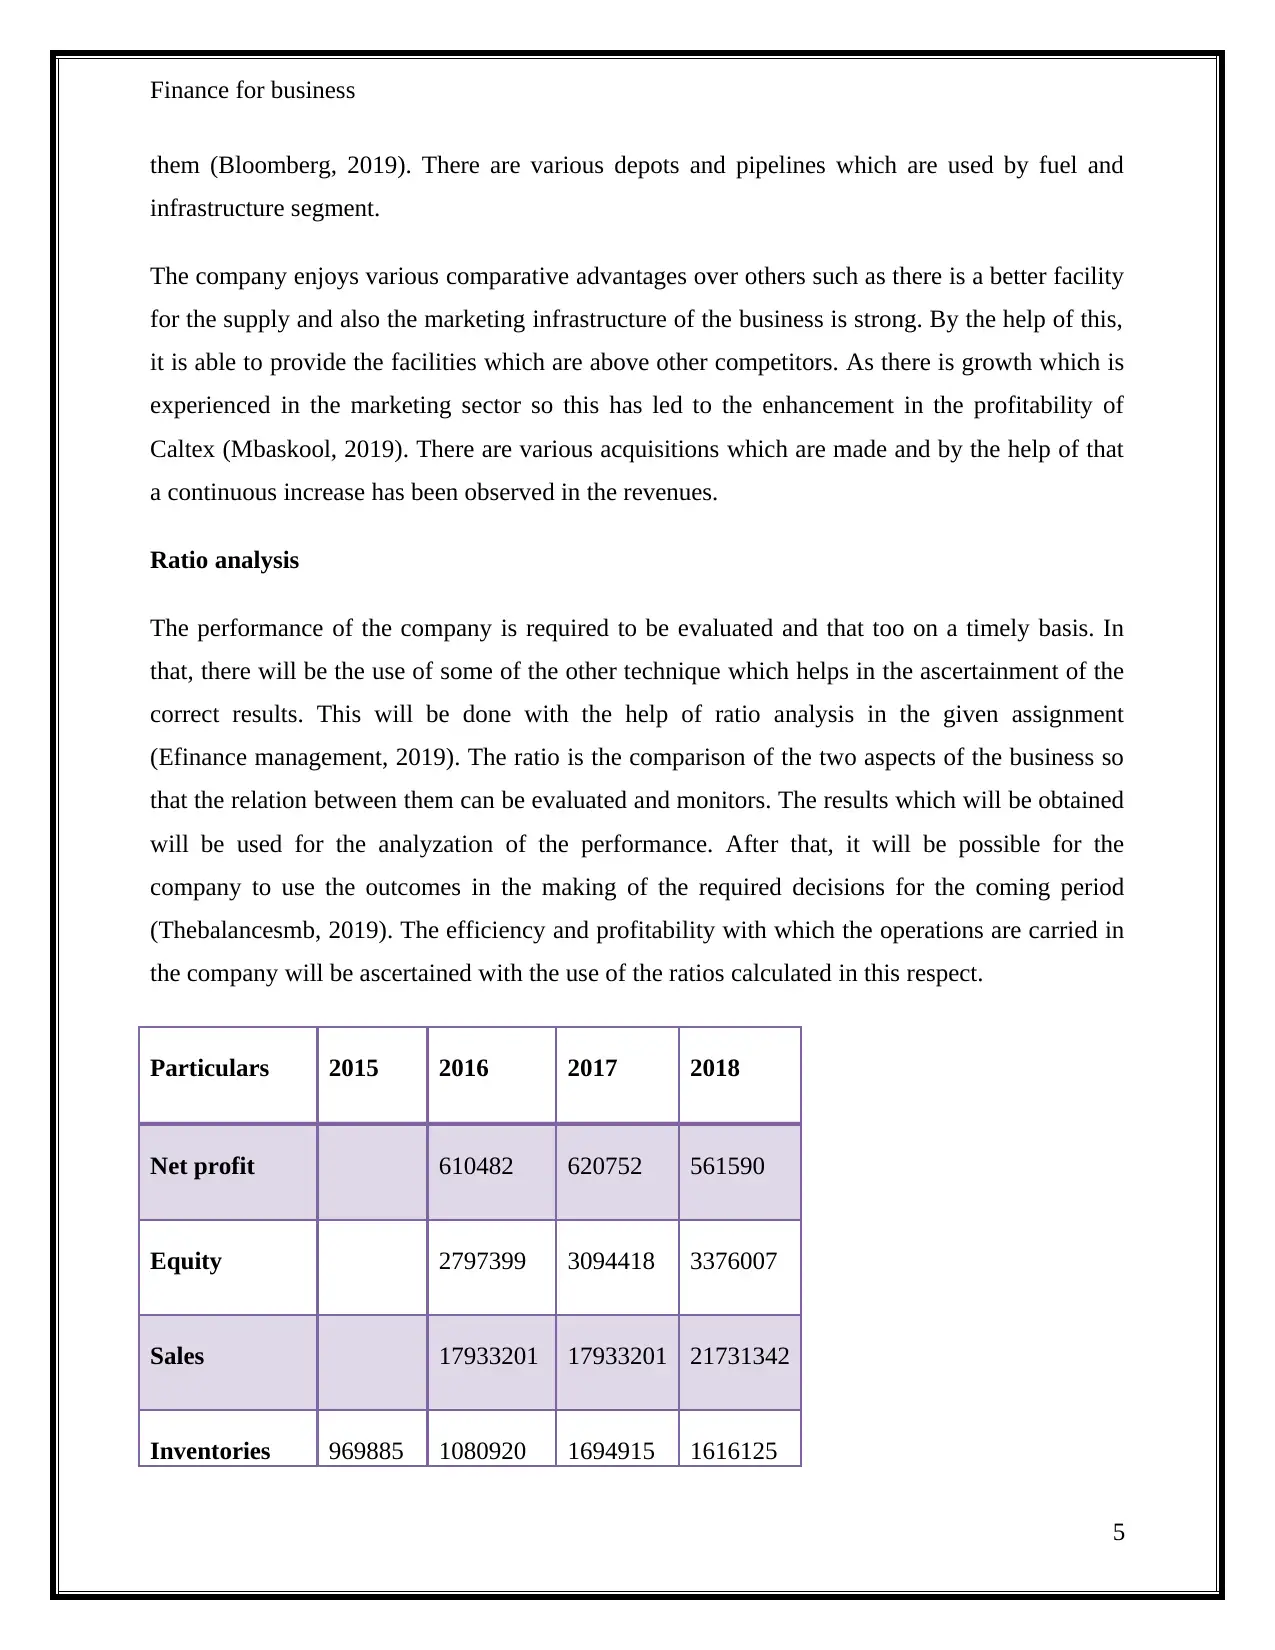
Efficiency ratios
In the company, there are various tasks which are performed and it is required that they are
carried with full potential. For that, it is required that the efficiency in various areas is required to
be measured and analyzed. This will be done with the help of the efficiency ratios. Under the
given case two ratios are calculated which includes asset turnover and inventory turnover ratio.
This will be describing the level of efficiency with which two of the assets have been utilized by
Caltex (Caltex Australia Limited, 2018). There will be proper evaluation and that will be
describing the overall abilities of the company to use the available resources. The calculation of
the ratios is presented below:
Particulars Formula 2016 2017 2018
Inventories
turnover
Net sales/Average Inventory 17.49 12.92 13.13
Asset turnover
ratio
Net sales/Average Total
assets
3.45 3.08 3.32
6
Average Inventories 1025402.5 1387918 1655520
Total assets 5104741 5302734 6355220 6727623
Average
assets
5203737.5 5828977 6541422
Efficiency ratios
In the company, there are various tasks which are performed and it is required that they are
carried with full potential. For that, it is required that the efficiency in various areas is required to
be measured and analyzed. This will be done with the help of the efficiency ratios. Under the
given case two ratios are calculated which includes asset turnover and inventory turnover ratio.
This will be describing the level of efficiency with which two of the assets have been utilized by
Caltex (Caltex Australia Limited, 2018). There will be proper evaluation and that will be
describing the overall abilities of the company to use the available resources. The calculation of
the ratios is presented below:
Particulars Formula 2016 2017 2018
Inventories
turnover
Net sales/Average Inventory 17.49 12.92 13.13
Asset turnover
ratio
Net sales/Average Total
assets
3.45 3.08 3.32
6
Finance for business
2016 2017 2018
0.00
2.00
4.00
6.00
8.00
10.00
12.00
14.00
16.00
18.00
20.00
Inventories turnover
Linear (Inventories
turnover)
Asset turnover ratio
Linear (Asset
turnover ratio )
Both the ratios are experiencing a decline which is not a good perspective. It will be needed that
there shall be an improvement as the inventories turnover is reducing which means that there is
no proper utilization of the available stock. Also, the company is not able to make the effective
use of the total assets which are involved and that are the reason for the decline in rations.
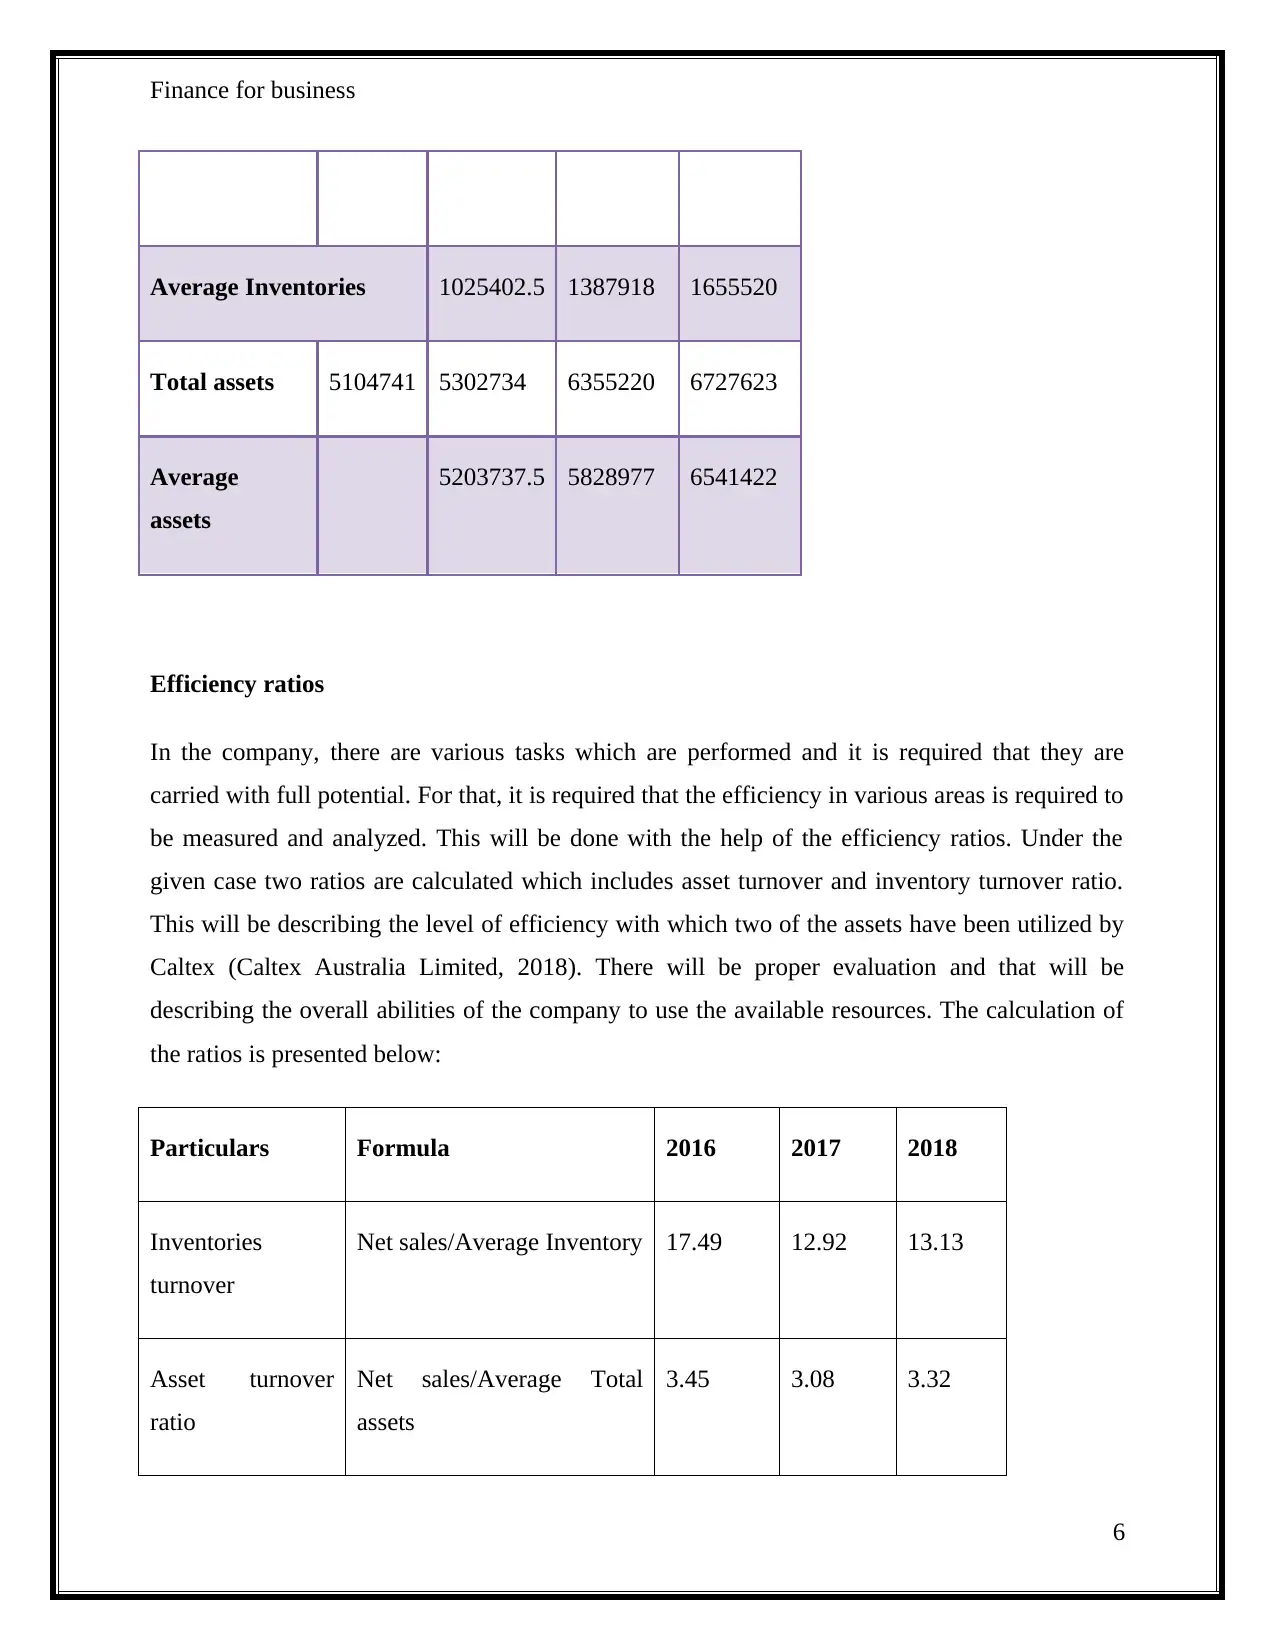
Profitability ratios
The profits which are made in a period are identified by these ratios so that the position of the
business can be evaluated. There is the consideration of the earnings of the company and then a
comparison of then is made with the sales of the company (Ali and Haque, 2014). The amount
which is earned on the equity will also be calculated so that the return which is made is
ascertained and that will be used by all those interested in making the investment in the
company.
Particulars Formula 2016 2017 2018
Return on
equity
Net
profit/Equity*100
21.82% 20.06% 16.63%
7
2016 2017 2018
0.00
2.00
4.00
6.00
8.00
10.00
12.00
14.00
16.00
18.00
20.00
Inventories turnover
Linear (Inventories
turnover)
Asset turnover ratio
Linear (Asset
turnover ratio )
Both the ratios are experiencing a decline which is not a good perspective. It will be needed that
there shall be an improvement as the inventories turnover is reducing which means that there is
no proper utilization of the available stock. Also, the company is not able to make the effective
use of the total assets which are involved and that are the reason for the decline in rations.
Profitability ratios
The profits which are made in a period are identified by these ratios so that the position of the
business can be evaluated. There is the consideration of the earnings of the company and then a
comparison of then is made with the sales of the company (Ali and Haque, 2014). The amount
which is earned on the equity will also be calculated so that the return which is made is
ascertained and that will be used by all those interested in making the investment in the
company.
Particulars Formula 2016 2017 2018
Return on
equity
Net
profit/Equity*100
21.82% 20.06% 16.63%
7
Paraphrase This Document
Need a fresh take? Get an instant paraphrase of this document with our AI Paraphraser
Finance for business
Net profit ratio Net
profit/Sales*100
3.40% 3.46% 2.58%
2016 2017 2018
0.00%
5.00%
10.00%
15.00%
20.00%
25.00%
Return on equity
Linear (Return on
equity)
Net profit ratio
Linear (Net profit
ratio)
The ratios have been calculated and representation of them has been made on the graph for the
better understanding. It can be noted that there is a decline in the ratios which is identified and
needed to be considered. Although the company is earning profits there is downfall which needs
to be covered in an effective manner as this shows the downward trend (Caltex Australia
Limited, 2018).
Analysis of Cash management
The business is carried out and for that, there is the need for resources. In that, the most
important is the cash which will be required for all the operations. Due to this, it is required that
it shall be managed in a proper manner. There will be the use of the cash balance for various
purposes by which earnings will be made and therefore they shall be accounted for in an
adequate manner
(Corominas, Lusa and Olivella, 2012). There are various forms in which the cash is available in
8
Finance for business
the company and so they all shall be recognized and measured before taking any decisions. The
management of the cash will require investing it in various assets which will be providing the
appropriate returns on the same. There are several securities and binds in which the amount can
be invested. Marketable securities are ones which can be used by the company at any time as
they are highly liquid and can be converted in an easy manner (Kroes and Manikas, 2014). This
will be identified and so that the performance of the company can be evaluated.
The company maintains all of these in various forms and manners and in the given case of Caltex
also they are managed in several ways. There are various investments which are made and on
them, the company is earning interest for all the period. If the company keeps cash balance then
it will not be earning any amount in that but by making them invested there is the additional
earning which is made on them (da Costa Moraes and Nagano, 2014). This amount can be
further utilized in some other purpose and make the business strong in terms of cash availability.
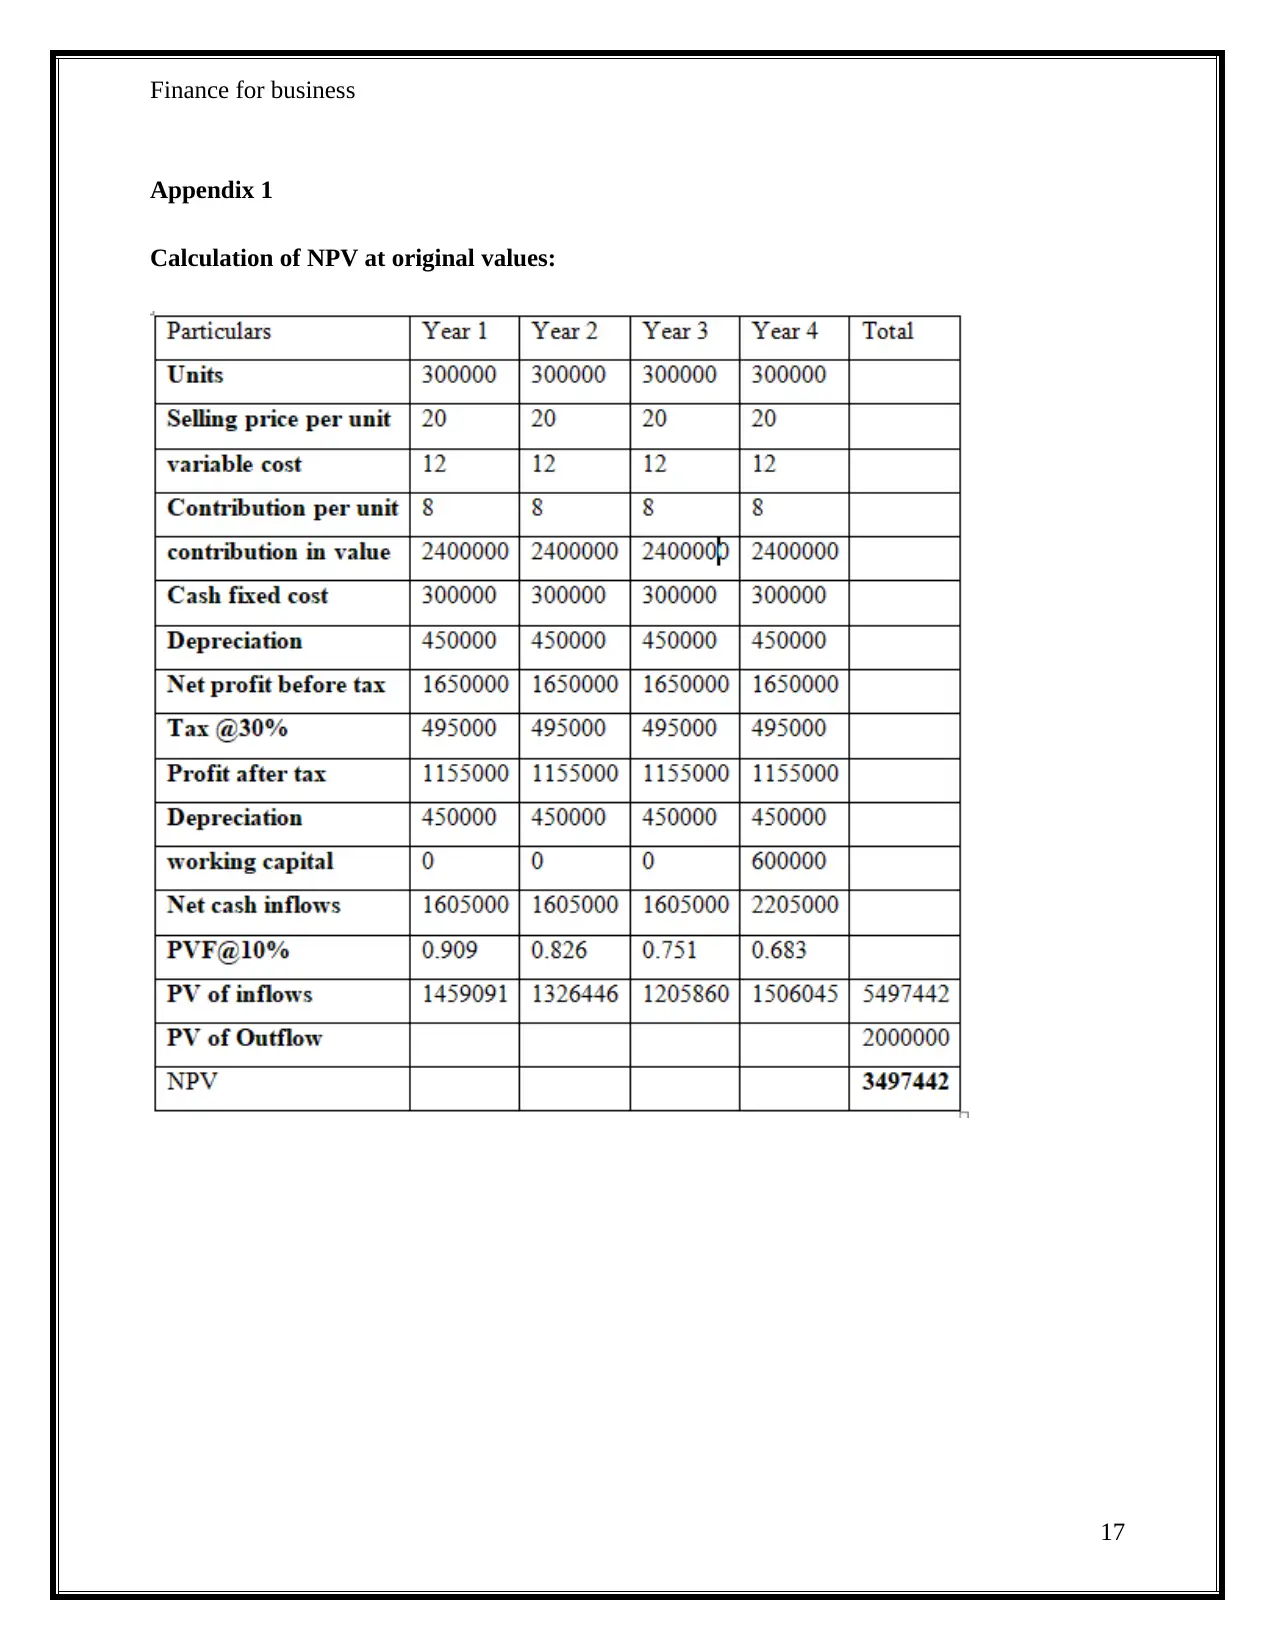
Sensitivity analysis
The analysis of sensitivity is performed in the business due to the availability of various
variables which affect the business and overall income that is made. In the calculation of the net
present value also there are many such factors because of which the result will be affected. If one
of the variables will be changed then the outcome which is gained is also changed in some or
other manner (Iooss and Lemaître, 2015). For this the sensitivity analysis is undertaken in which
the impact made is identified and also the most sensitive variable is detected. By the help of this,
the factors affecting profitability are determined and then the company will be to establish
control on those aspects which are identified as highly sensitive (CFI, 2019).
The calculation for the same is performed by taking the change in output versus change in input.
There is the consideration of net present value in the present scenario and all the variables which
are involved in its calculation. The calculation for the same is performed and in that firstly the
NPV at the original values is determined. After that, all the variables are modified one by one
and change made by them is identified. The net present value at all values is calculated and then
the sensitivity test for the same is performed (Rodríguez et al., 2013). All of the calculations
which are performed in this respect have been presented in appendix 1. The final results of the
analysis are provided hereunder which shows the results obtained by all the changes. In this, it
9
the company and so they all shall be recognized and measured before taking any decisions. The
management of the cash will require investing it in various assets which will be providing the
appropriate returns on the same. There are several securities and binds in which the amount can
be invested. Marketable securities are ones which can be used by the company at any time as
they are highly liquid and can be converted in an easy manner (Kroes and Manikas, 2014). This
will be identified and so that the performance of the company can be evaluated.
The company maintains all of these in various forms and manners and in the given case of Caltex
also they are managed in several ways. There are various investments which are made and on
them, the company is earning interest for all the period. If the company keeps cash balance then
it will not be earning any amount in that but by making them invested there is the additional
earning which is made on them (da Costa Moraes and Nagano, 2014). This amount can be
further utilized in some other purpose and make the business strong in terms of cash availability.
Sensitivity analysis
The analysis of sensitivity is performed in the business due to the availability of various
variables which affect the business and overall income that is made. In the calculation of the net
present value also there are many such factors because of which the result will be affected. If one
of the variables will be changed then the outcome which is gained is also changed in some or
other manner (Iooss and Lemaître, 2015). For this the sensitivity analysis is undertaken in which
the impact made is identified and also the most sensitive variable is detected. By the help of this,
the factors affecting profitability are determined and then the company will be to establish
control on those aspects which are identified as highly sensitive (CFI, 2019).
The calculation for the same is performed by taking the change in output versus change in input.
There is the consideration of net present value in the present scenario and all the variables which
are involved in its calculation. The calculation for the same is performed and in that firstly the
NPV at the original values is determined. After that, all the variables are modified one by one
and change made by them is identified. The net present value at all values is calculated and then
the sensitivity test for the same is performed (Rodríguez et al., 2013). All of the calculations
which are performed in this respect have been presented in appendix 1. The final results of the
analysis are provided hereunder which shows the results obtained by all the changes. In this, it
9
Finance for business
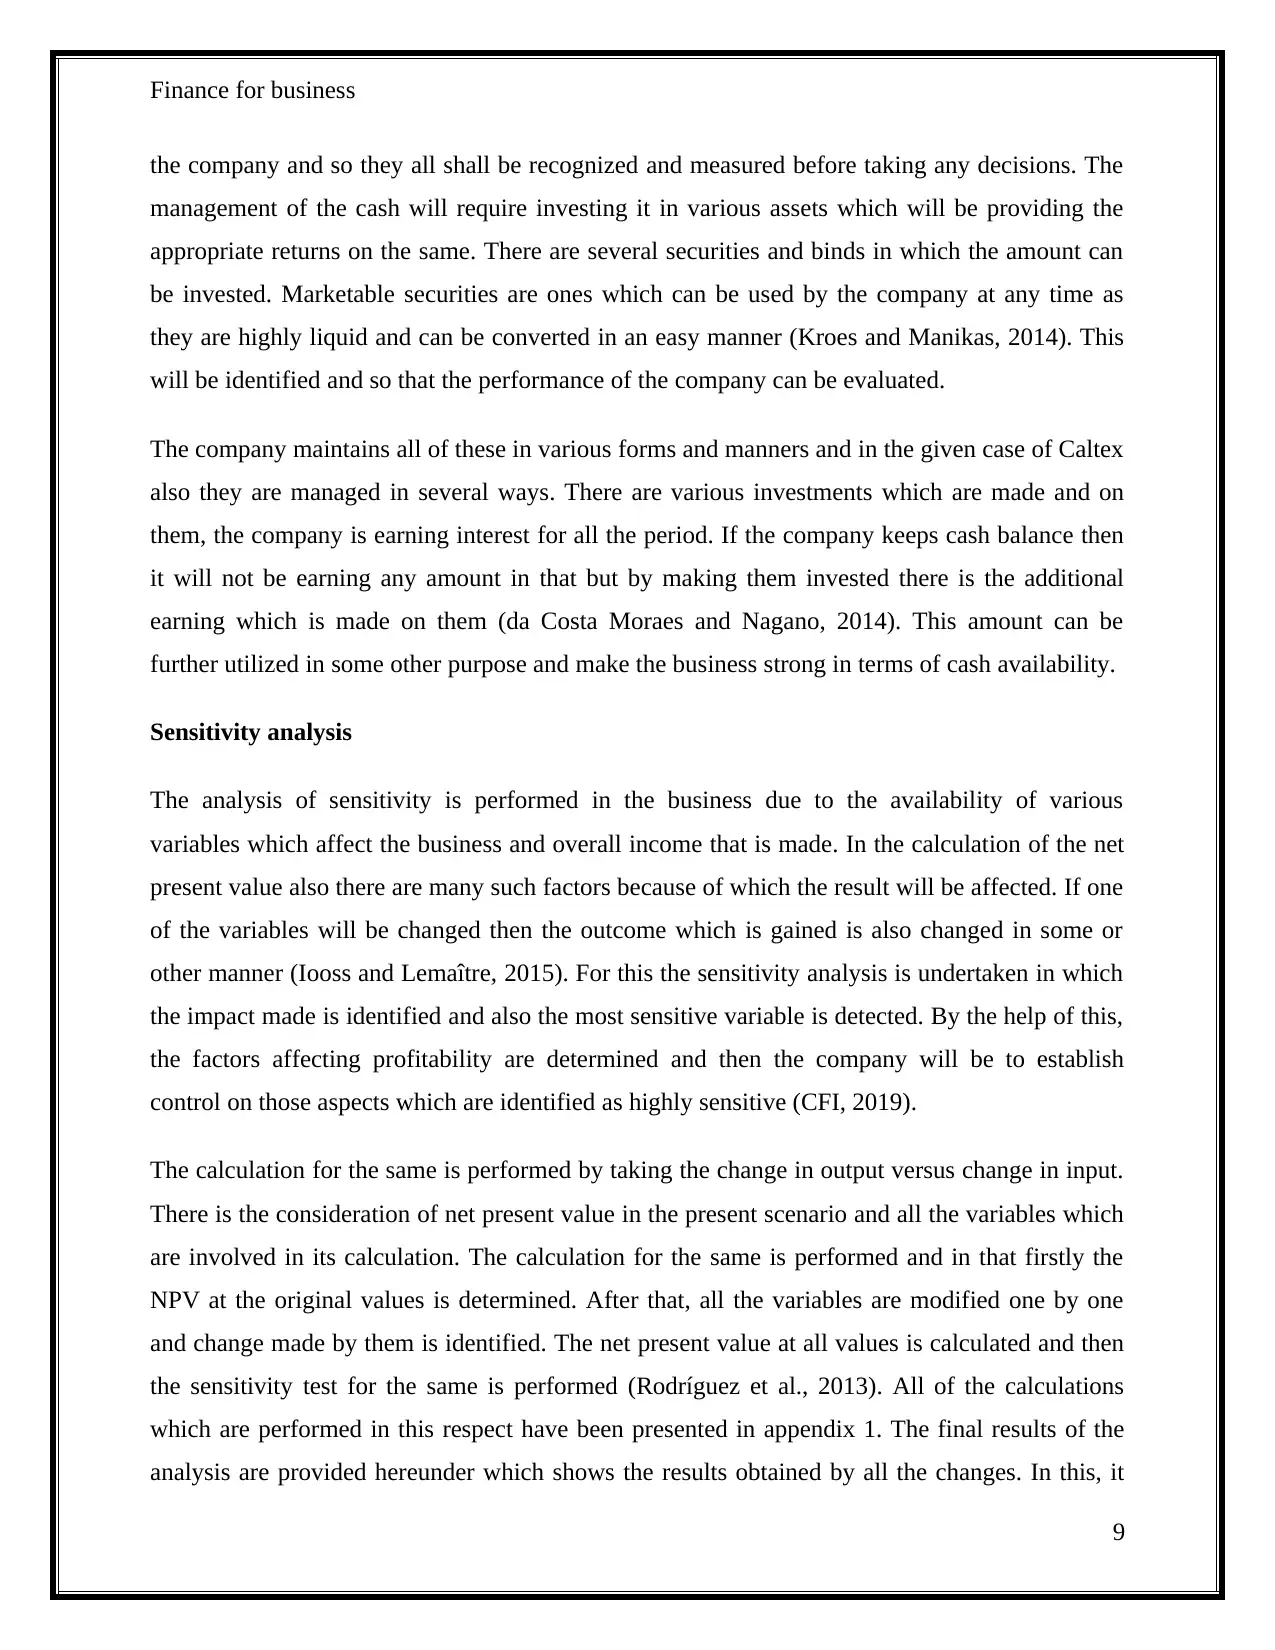
can be noted that selling price is highly sensitive and if there will be any change which will be
made in that then the net present value will be affected to a great extent.
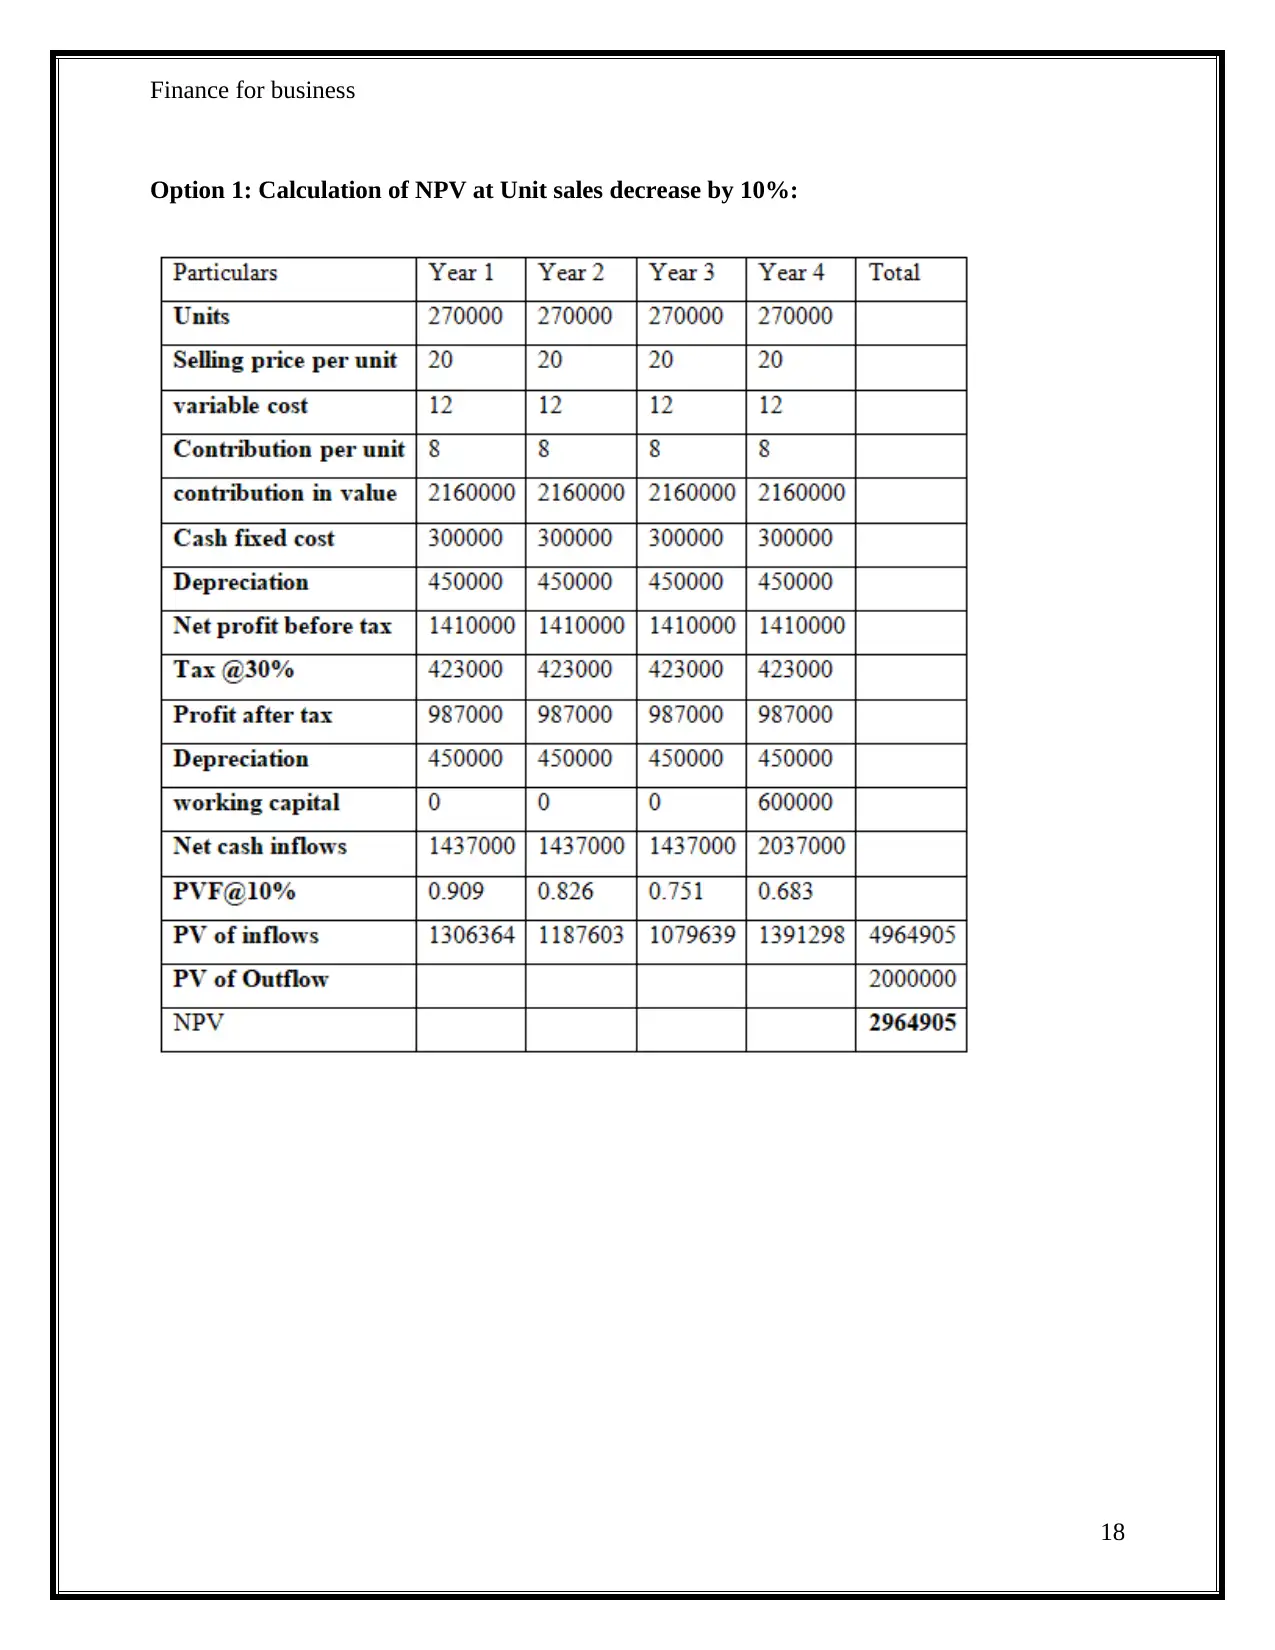
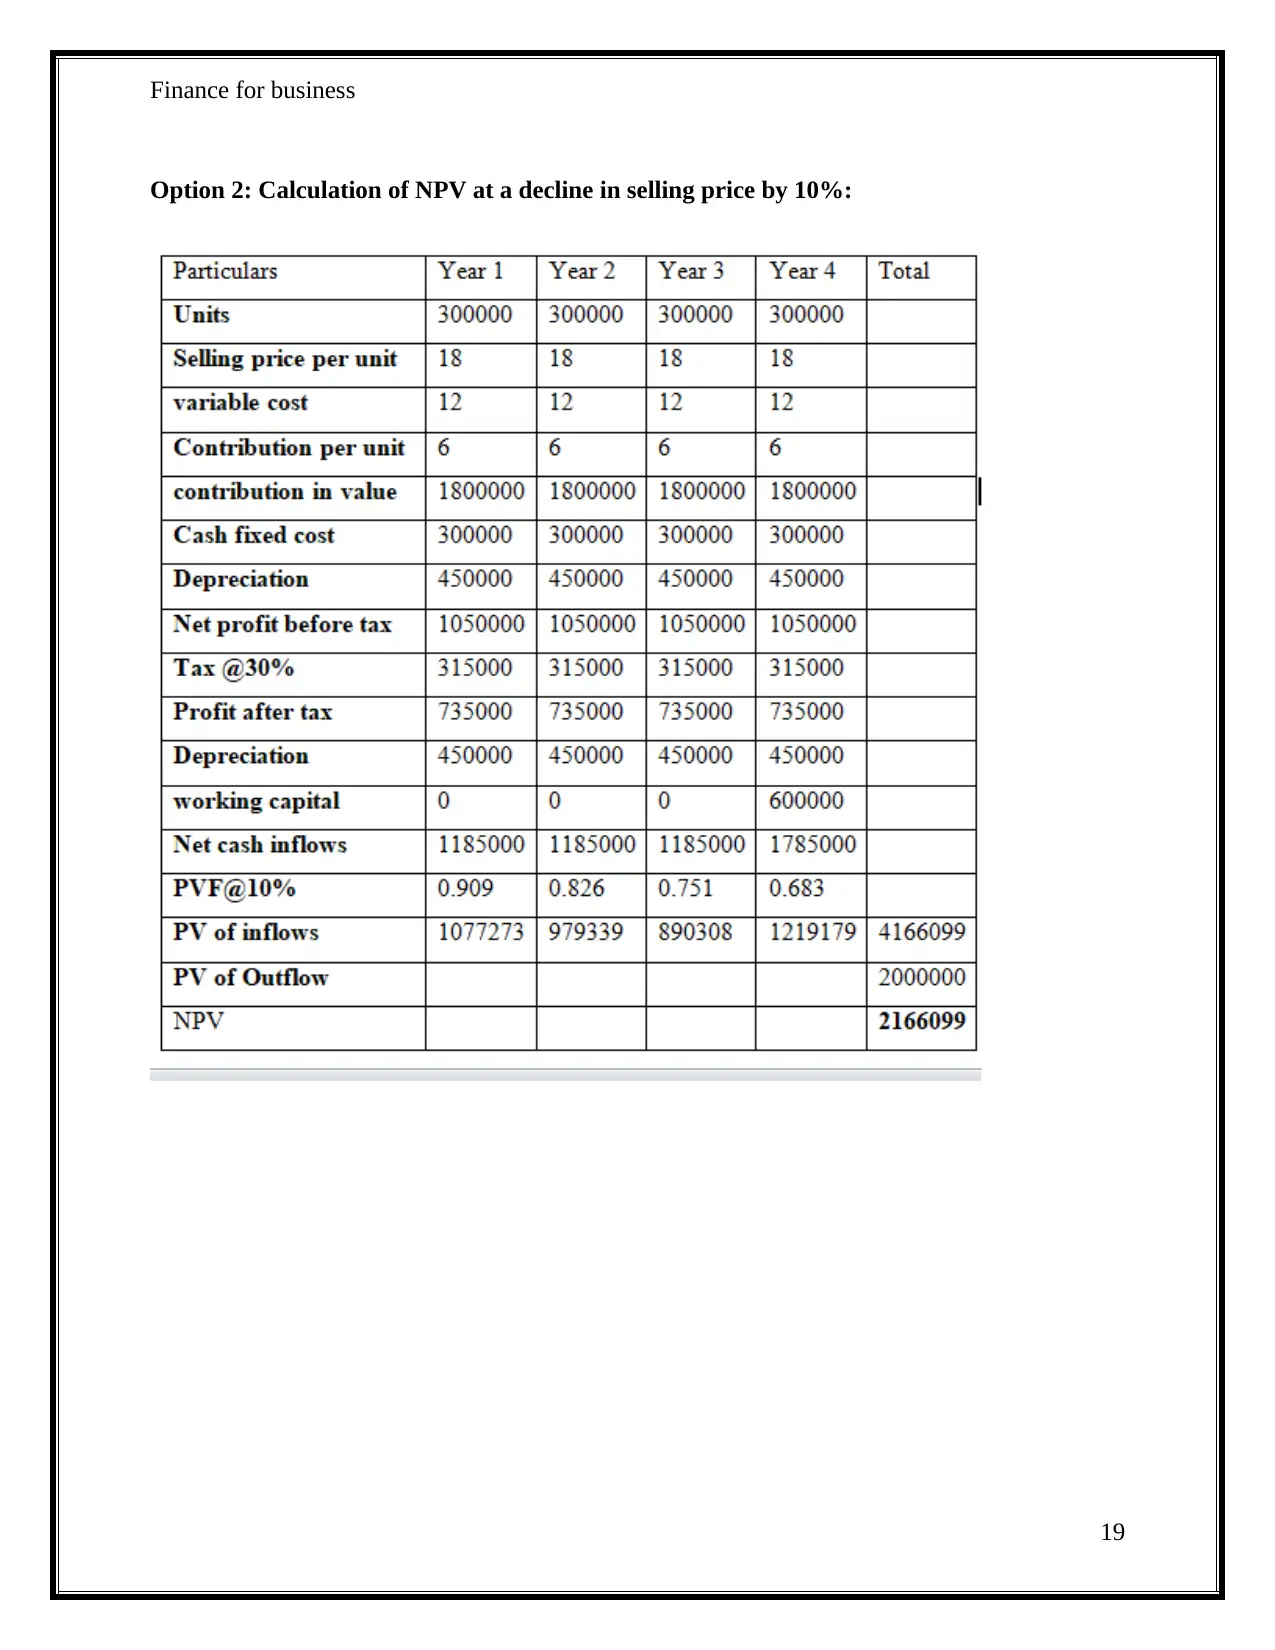
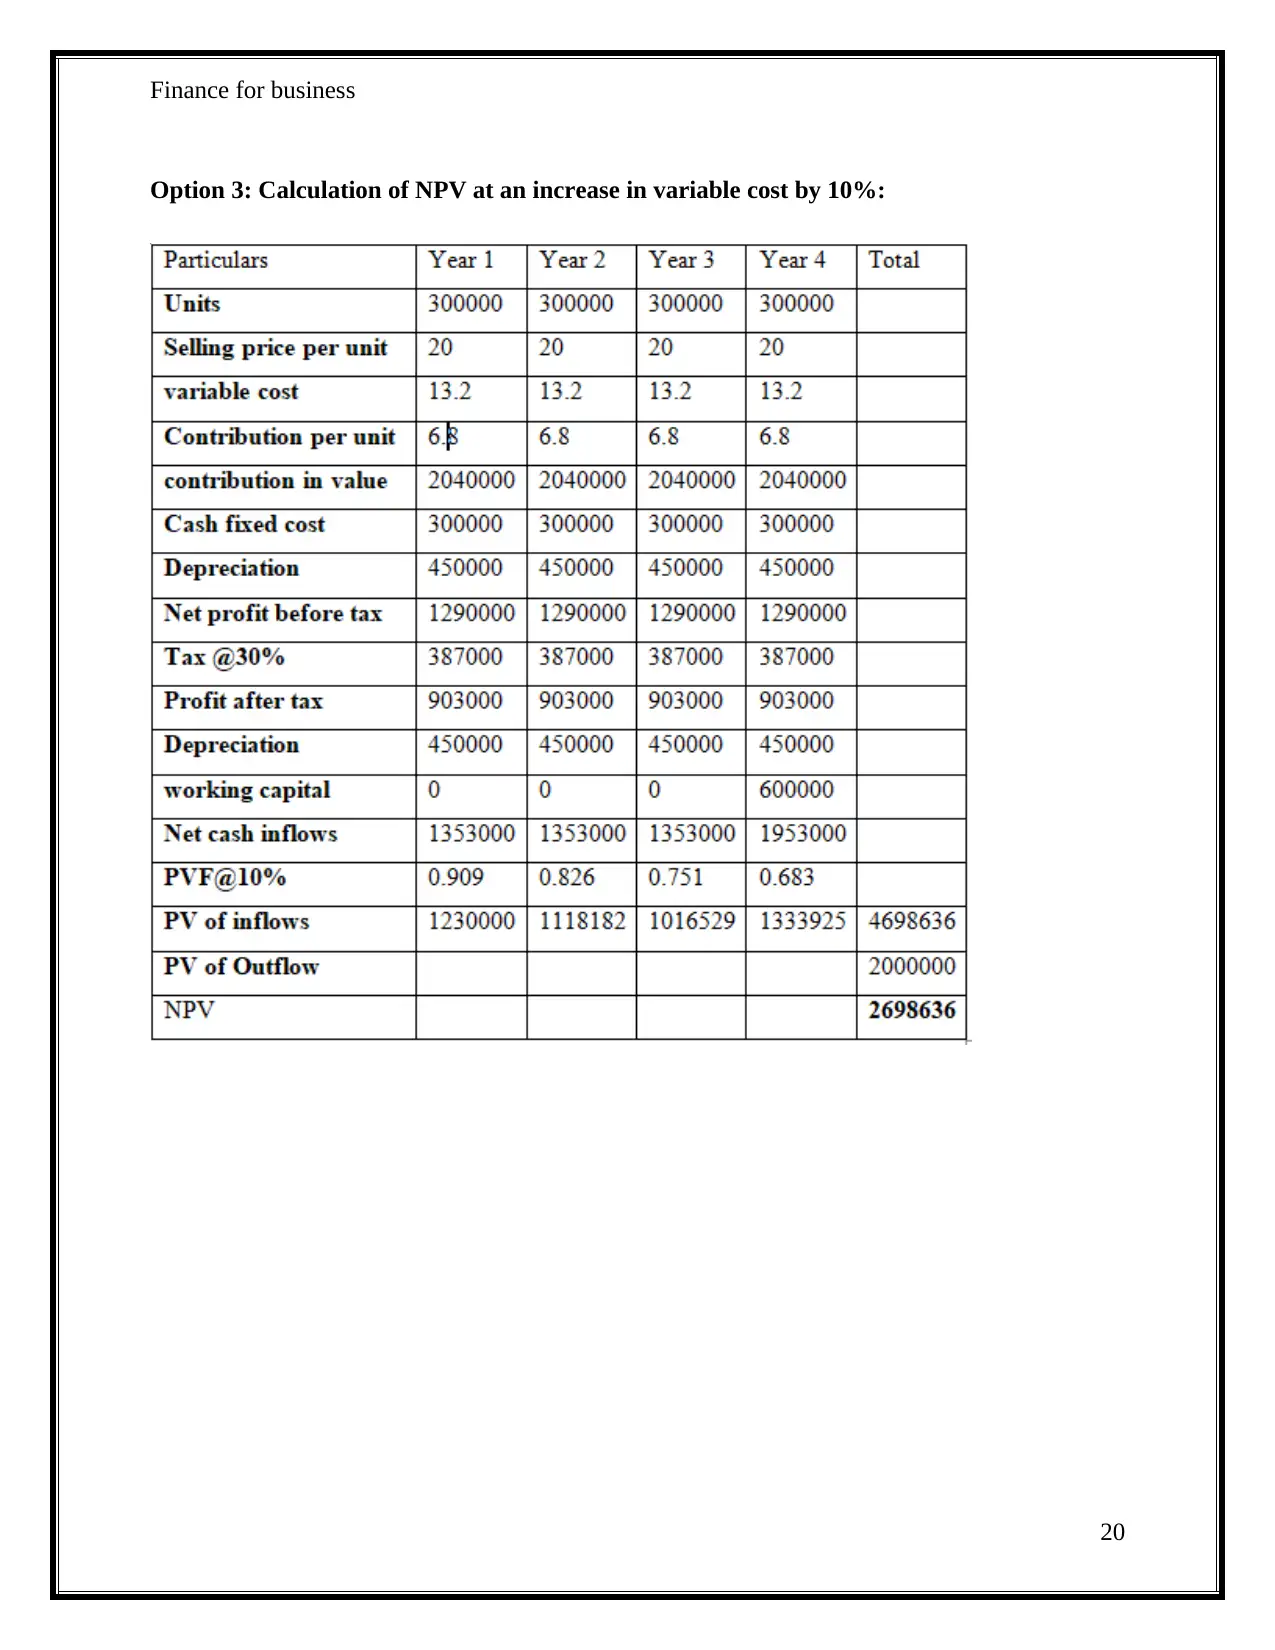
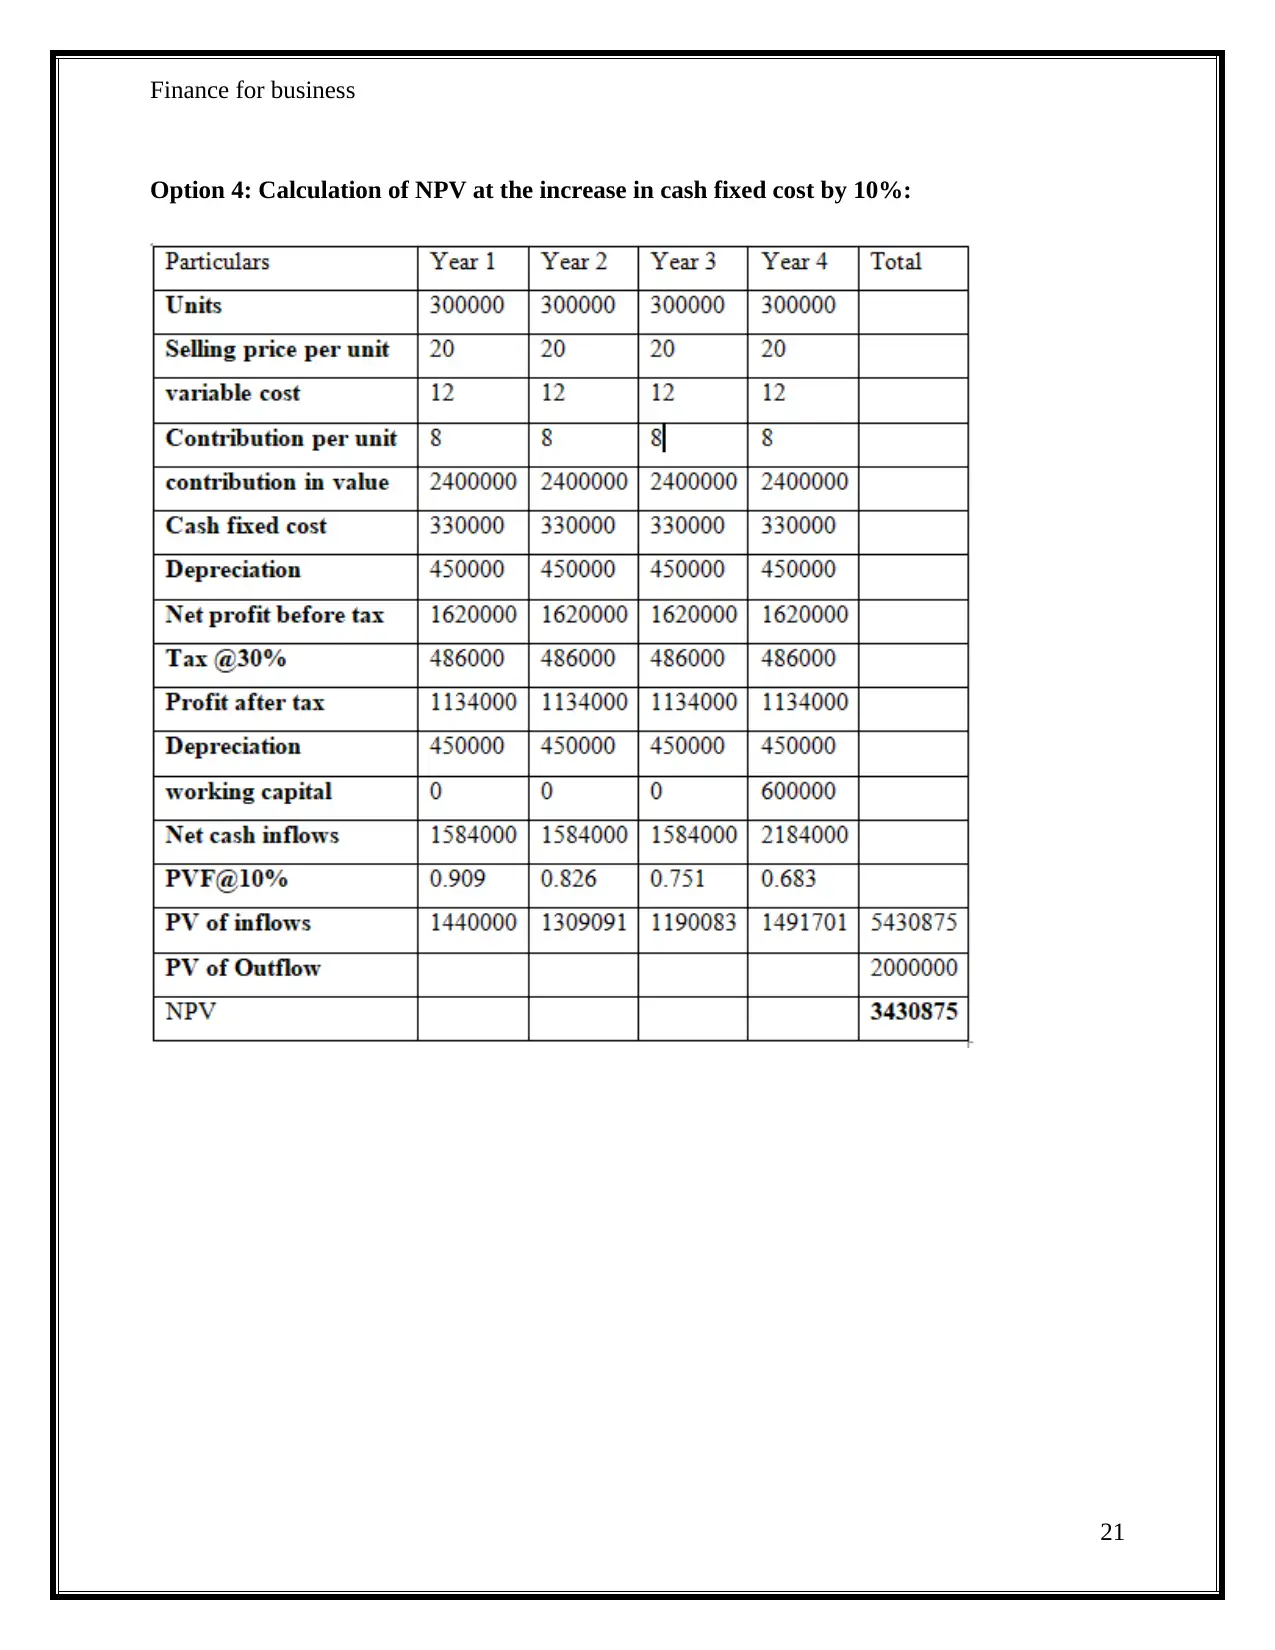
Particulars Original Option 1 Option 2 Option 3 Option 4
NPV 349744
2
2964905 2166099 2698636 3430875
% Change in NPV (A) -15.226 -38.066 -22.84 -1.9033
Input changing Sales units selling price variable cost fixed cost
% change in Input (B) 10 10 10 10
Sensitivity (A/B) -1.5226 -3.8066 -2.284 -0.1903
Systematic and un-systematic risk
The business is carried out with the involvement of various elements and due to that, there is a
certain amount of the risk which is involved in it. In order to make the proper performance
evaluation, it is necessary that the risk which is incorporated shall also be taken into account. The
main reason because of which the risk is involved in the uncertainty that is present in business
(Iqbal and Shah, 2012). The further classification of the risk can be made and it is divided into
two parts which are systematic and unsystematic risks. There is a need to reduce them to a
certain extent as it is not possible to avoid them in a complete manner. This is because the
company will not be able to identify all of them and that beforehand (Bali, Brown and Caglayan,
2012). The identification of them will be made and then appropriate actions in this direction will
be made.
10
can be noted that selling price is highly sensitive and if there will be any change which will be
made in that then the net present value will be affected to a great extent.
Particulars Original Option 1 Option 2 Option 3 Option 4
NPV 349744
2
2964905 2166099 2698636 3430875
% Change in NPV (A) -15.226 -38.066 -22.84 -1.9033
Input changing Sales units selling price variable cost fixed cost
% change in Input (B) 10 10 10 10
Sensitivity (A/B) -1.5226 -3.8066 -2.284 -0.1903
Systematic and un-systematic risk
The business is carried out with the involvement of various elements and due to that, there is a
certain amount of the risk which is involved in it. In order to make the proper performance
evaluation, it is necessary that the risk which is incorporated shall also be taken into account. The
main reason because of which the risk is involved in the uncertainty that is present in business
(Iqbal and Shah, 2012). The further classification of the risk can be made and it is divided into
two parts which are systematic and unsystematic risks. There is a need to reduce them to a
certain extent as it is not possible to avoid them in a complete manner. This is because the
company will not be able to identify all of them and that beforehand (Bali, Brown and Caglayan,
2012). The identification of them will be made and then appropriate actions in this direction will
be made.
10
Secure Best Marks with AI Grader
Need help grading? Try our AI Grader for instant feedback on your assignments.
Finance for business
The risk which is associated with the complete market is systematic and it is not possible to
avoid the same. On the contrary, the unsystematic risk is the one which is related to a particular
segment and there is the control on the same so it can be eliminated (Waemustafa and Sukri,
2016). There are several such risks which are involved in Caltex also which includes the
commodity price risk which is due to the movement of the price of crude. In addition to this
foreign exchange, the risk is also there which is incorporated by the change in the foreign rates.
After this, comes the operational and liquidity risk which is involved in the business. This is due
to the internal functioning of the company as the various activities which are involved are highly
risky to be performed. The competition level of the industry is high and that leads to the
competition risk (Caltex Australia Limited, 2018). The risk of the environment is also there
which is involved and should be taken into consideration with due care. The market will have to
be regularly studied to deal with the credit risk that is available with Caltex.
Dividend payout ratio and dividend policy
All the investors who have made the investment in the company require some of the returns on
the same. In this, it will be required by the company that all the earnings which are made by
them shall be allocated in an adequate manner (CFI, 2019). There is some portion which is
retained for the future use by the organization but the remaining is required to be distributed
among all the shareholders. It is done on a specified rate and that is identified as the dividend
payout of the company. It is required that the dividend which is paid is compared with the
earnings of the business for a specified duration (Malik et al., 2013). By this, the payout will be
identified which will help in the formulation of the policies for a future period. In the given case
of Caltex, there are almost half of the earnings which are paid as dividends. It is considered as a
good policy for shareholders and they will be satisfied (Caltex Australia Limited, 2018). The
calculations in this respect are provided below so that proper understanding can be gained.
Calculation of Dividend payout ratio
Particulars 2016 2017 2018
Dividend 319405 292107 307757
11
Finance for business
Earnings 610482 620752 561590
dividend payout
ratio
52.32% 47.06% 54.80%
It is the policy of the company that the dividends shall be paid between 50 to 70 percent every
year. It is identified that the rate is followed but there is a certain decline in 2017 (Caltex
Australia Limited, 2018). In other years the payout is above the specified level of 50%.
Recommendations
In the financial analysis of the Caltex which is performed above, there are various aspects which
have been evaluated. In that, there is the use of several techniques by which all the required
results have been obtained. There is the need to use them for the benefit of the company and for
that all of them will be undertaken in the making of the required policies for the coming period.
There will be proper use and the available issues have been identified and the corrective
measures for all of them will be taken. The ratio analysis is performed and with that, the
performance is evaluated and there is the profit which is made by the company which can further
be increased. The company is involving the risk of various factors and that will have to be
controlled by involving all the required policies for them. There is the proper dividend payout
ratio which is followed by the company and this will be in the interest of the shareholders. The
company can look to increasing the capital as the investors will be willing to invest with the
regular payouts.
Conclusion
The report presented above has provided all the required information about the company and its
financial aspects. The details about the company are identified together with the activities which
12
Finance for business
are performed by it. The areas in which the company is undertaking its business have been
determined and with that, the manner in which it is gaining the advantage over other competitors
has also been taken into consideration. There is the performance of the ratio analysis in which
the performance and efficiency of the business are considered and several ratios have been
calculated. The company is maintaining profitability and is also using its resources in the proper
manner. The further analysis for the sensitivity measurement has been made in which the net
present value is calculated and then the test of all the elements involved in it is made. The results
have been determined which showed selling price as the most sensitive and so main focus will
have to be made on the same. There is cash management which is needed in the company and for
that, all the aspects have been discussed. The trend analysis is also used for the identification of
the trend which is involved and also the dividend payout of the Caltex is identified which shows
that the company is making the appropriate payments to the investors which will make them
satisfied. The business involves the risk and all the risks which are involved in the current
company have been identified. The manner in which business will be affected by them has also
been considered. On the basis of all the results which are obtained, there are certain
recommendations which are made so that improvement can be made in an overall manner.
13
Paraphrase This Document
Need a fresh take? Get an instant paraphrase of this document with our AI Paraphraser
Finance for business
References
Ali, A. and Haque, M. (2014) Ratio Analysis: A Comparative Study of National Petrochemicals
Co. and Sahara Petrochemicals Co. of Saudi Arabia. International Journal of Management
Academy, 2(4), pp.53-61.
Bali, T.G., Brown, S.J. and Caglayan, M.O. (2012) Systematic risk and the cross-section of
hedge fund returns. Journal of Financial Economics, 106(1), pp.114-131.
Bloomberg. (2019) Company Overview of Caltex Australia Limited. [Online] Available at
https://www.bloomberg.com/research/stocks/private/snapshot.asp?privcapId=877088 [Accessed
20 May 2019]
Caltex Australia Limited. (2016) Annual report 2016. [Online] Available at
http://microsites.caltex.com.au/annualreports/2016/files/Caltex-AR2016.pdf [Accessed 20 May
2019]
Caltex Australia Limited. (2017) Annual report 2017. [Online] Available at:
http://microsites.caltex.com.au/annualreports/2017/ [Accessed 20 May 2019]
Caltex Australia Limited. (2018) 2018 Annual report. [Online] Available at:
https://www.caltex.com.au/annual-report-2018 [Accessed 20 May 2019]
Caltex Australia Limited. (2019) About us. [Online] Available at:
https://www.caltex.com.au/our-company [Accessed 20 May 2019]
CFI. (2019) Dividend Payout Ratio. [Online] Available at:
https://corporatefinanceinstitute.com/resources/knowledge/finance/dividend-payout-ratio-
formula/ [Accessed 20 May 2019]
CFI. (2019) What is Sensitivity Analysis?. [Online] Available at:
https://corporatefinanceinstitute.com/resources/knowledge/modeling/what-is-sensitivity-analysis/
[Accessed 20 May 2019]
14
Finance for business
Corominas, A., Lusa, A. and Olivella, J. (2012) A detailed workforce planning model including
non-linear dependence of capacity on the size of the staff and cash management. European
Journal of Operational Research, 216(2), pp.445-458.
da Costa Moraes, M.B. and Nagano, M.S. (2014) Evolutionary models in cash management
policies with multiple assets. Economic Modelling, 39, pp.1-7.
Efinance managment. (2019) Efficiency Ratios. [Online] Available at:
https://efinancemanagement.com/financial-analysis/efficiency-ratios [Accessed 20 May 2019]
Iooss, B. and Lemaître, P. (2015) A review on global sensitivity analysis methods.
In Uncertainty management in simulation-optimization of complex systems, 59, pp.101-122.
Iqbal, M.J. and Shah, S.Z.A. (2012) Determinants of systematic risk. The Journal of
Commerce, 4(1), pp.47-56.
Kroes, J.R. and Manikas, A.S. (2014) Cash flow management and manufacturing firm financial
performance: A longitudinal perspective. International Journal of Production Economics, 148,
pp.37-50.
Malik, F., Gul, S., Khan, M.T., Rehman, S.U. and Khan, M. (2013) Factors influencing corporate
dividend payout decisions of financial and non-financial firms. Research Journal of Finance and
Accounting, 4(1), pp.35-46.
Mbaskool. (2019) Caltex Australia SWOT Analysis, Competitors & USP. [Online] Available at:
https://www.mbaskool.com/brandguide/energy/8149-caltex-australia.html [Accessed 20 May
2019]
Rodríguez, G.C., Andrés, A.C., Muñoz, F.D., López, J.M.C. and Zhang, Y. (2013) Uncertainties
and sensitivity analysis in building energy simulation using macroparameters. Energy and
Buildings, 67, pp.79-87.
Thebalancesmb. (2019) Profitability Ratio Analysis. [Online] Available at:
https://www.thebalancesmb.com/profitability-ratio-analysis-393185 [Accessed 20 May 2019]
15

Finance for business
Waemustafa, W. and Sukri, S. (2016) Systematic and unsystematic risk determinants of liquidity
risk between Islamic and conventional banks. International Journal of Economics and Financial
Issues, 6(4), pp.1321-1327.
16
Waemustafa, W. and Sukri, S. (2016) Systematic and unsystematic risk determinants of liquidity
risk between Islamic and conventional banks. International Journal of Economics and Financial
Issues, 6(4), pp.1321-1327.
16
Secure Best Marks with AI Grader
Need help grading? Try our AI Grader for instant feedback on your assignments.
Finance for business
Appendix 1
Calculation of NPV at original values:
17
Appendix 1
Calculation of NPV at original values:
17
Finance for business
Option 1: Calculation of NPV at Unit sales decrease by 10%:
18
Option 1: Calculation of NPV at Unit sales decrease by 10%:
18
Finance for business
Option 2: Calculation of NPV at a decline in selling price by 10%:
19
Option 2: Calculation of NPV at a decline in selling price by 10%:
19
Paraphrase This Document
Need a fresh take? Get an instant paraphrase of this document with our AI Paraphraser
Finance for business
Option 3: Calculation of NPV at an increase in variable cost by 10%:
20
Option 3: Calculation of NPV at an increase in variable cost by 10%:
20
Finance for business
Option 4: Calculation of NPV at the increase in cash fixed cost by 10%:
21
Option 4: Calculation of NPV at the increase in cash fixed cost by 10%:
21
1 out of 21
Related Documents


Your All-in-One AI-Powered Toolkit for Academic Success.
+13062052269
info@desklib.com
Available 24*7 on WhatsApp / Email
![[object Object]](/_next/static/media/star-bottom.7253800d.svg)
Unlock your academic potential
© 2024 | Zucol Services PVT LTD | All rights reserved.