ACC91210 Finance for Managers: Case Study 1 - Risk and Return Analysis
VerifiedAdded on 2023/06/15
|9
|2217
|356
Case Study
AI Summary
This case study involves a comprehensive risk and return analysis using historical market data for Boral Ltd, a reference company, and a market index. The analysis includes calculating historical monthly returns, average rates of return, standard deviation, covariance, portfolio return, portfolio standard deviation, beta, and expected return. The study applies modern portfolio theory to assess the impact of portfolio construction on risk reduction. The results indicate that while portfolio construction may slightly decrease the rate of return, it significantly reduces the rate of risk. The analysis also includes a comparison of beta values for Boral Ltd and the reference company, highlighting the volatility and systematic risks associated with each. The case study concludes that balancing the portfolio to minimize risk and maximize return is crucial, aligning with the principles of modern portfolio theory.
Running head: FINANCE FOR MANAGERS
Finance for Managers
Name of the Student:
Name of the University:
Author Note
Finance for Managers
Name of the Student:
Name of the University:
Author Note
Paraphrase This Document
Need a fresh take? Get an instant paraphrase of this document with our AI Paraphraser
1
FINANCE FOR MANAGERS
Table of Contents
Answer to Question a:.....................................................................................................................2
Requirement 1:.............................................................................................................................2
Requirement 2:.............................................................................................................................2
Answer to Question b:.....................................................................................................................3
Answer to Question c:.....................................................................................................................3
Answer to Question d:.....................................................................................................................4
Answer to Question e:.....................................................................................................................4
References and Bibliography...........................................................................................................6
2
FINANCE FOR MANAGERS
Answer to Question a:
Requirement 1:
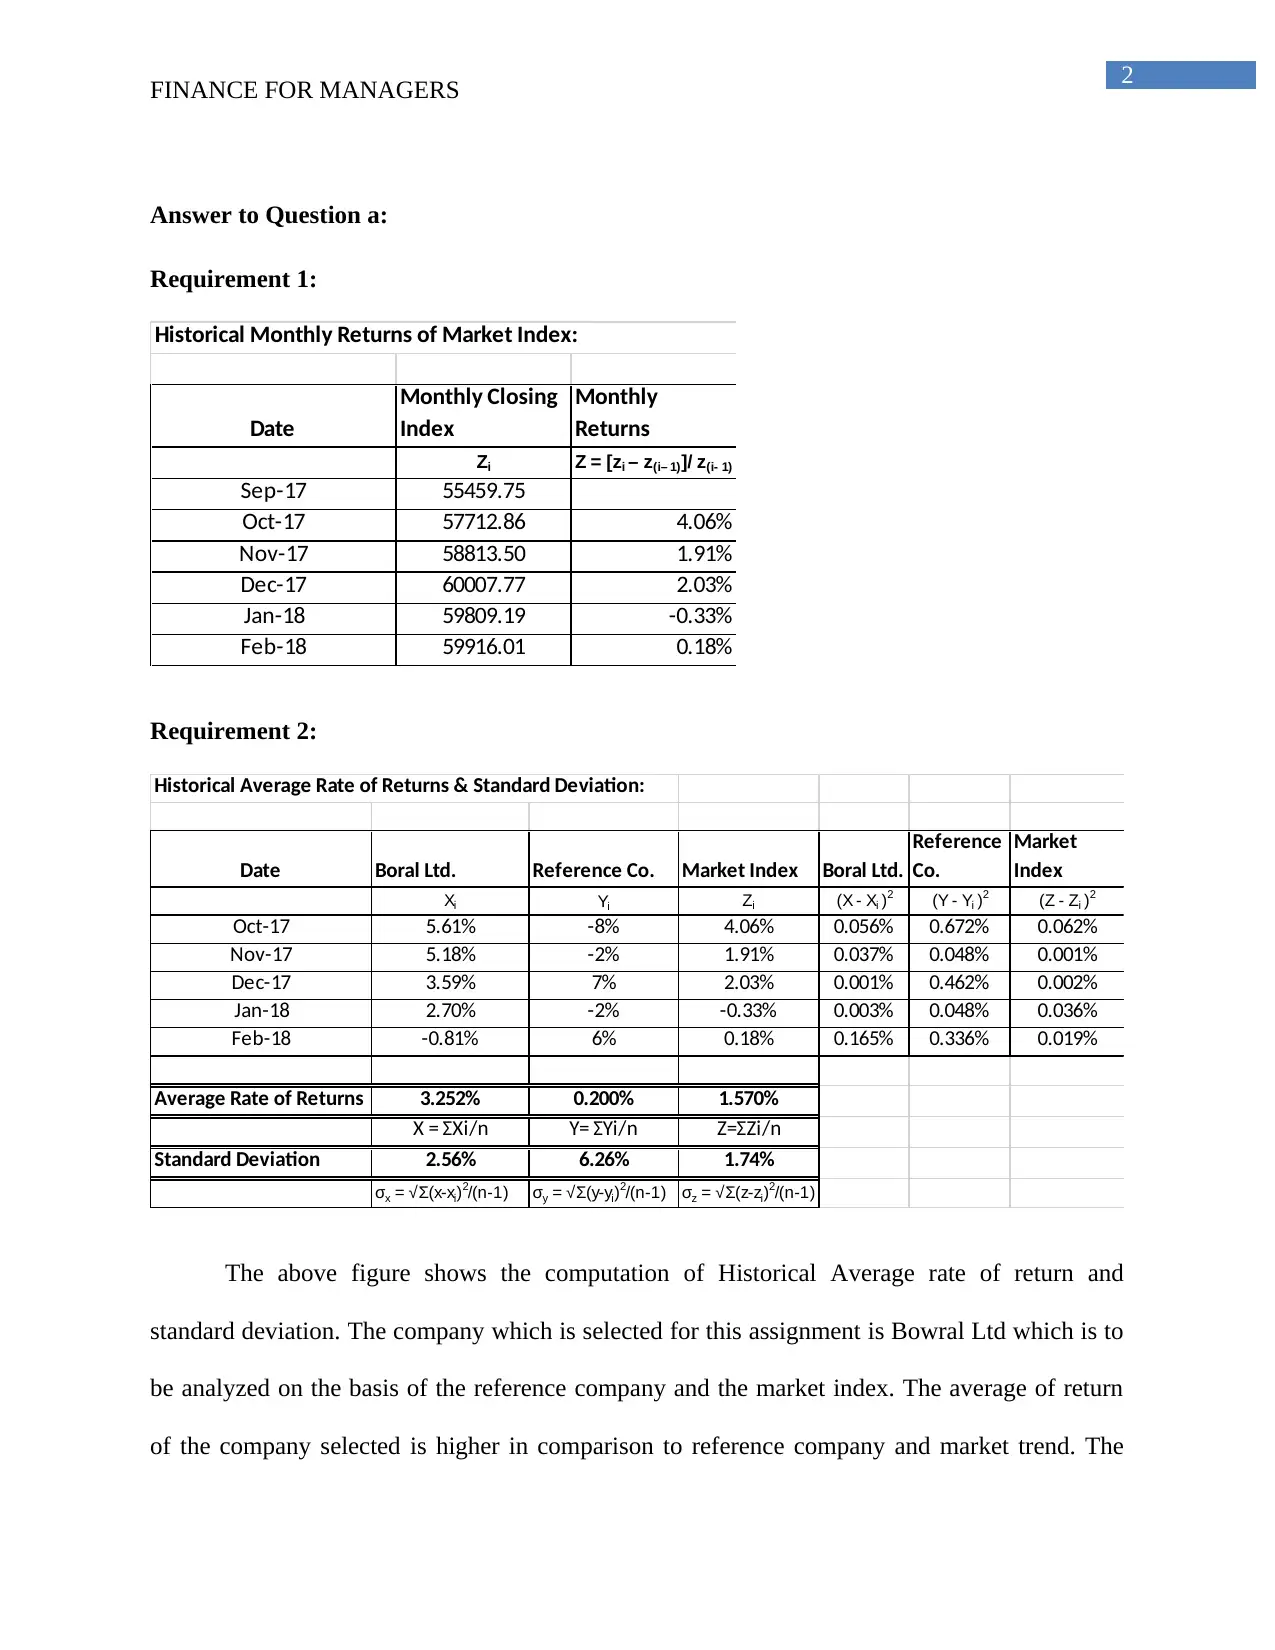
Historical Monthly Returns of Market Index:
Date
Monthly Closing
Index
Monthly
Returns
Zi Z = [zi – z(i– 1)]/ z(i- 1)
Sep-17 55459.75
Oct-17 57712.86 4.06%
Nov-17 58813.50 1.91%
Dec-17 60007.77 2.03%
Jan-18 59809.19 -0.33%
Feb-18 59916.01 0.18%
Requirement 2:
Historical Average Rate of Returns & Standard Deviation:
Date Boral Ltd. Reference Co. Market Index Boral Ltd.
Reference
Co.
Market
Index
Xi Yi Zi (X - Xi )2 (Y - Yi )2 (Z - Zi )2
Oct-17 5.61% -8% 4.06% 0.056% 0.672% 0.062%
Nov-17 5.18% -2% 1.91% 0.037% 0.048% 0.001%
Dec-17 3.59% 7% 2.03% 0.001% 0.462% 0.002%
Jan-18 2.70% -2% -0.33% 0.003% 0.048% 0.036%
Feb-18 -0.81% 6% 0.18% 0.165% 0.336% 0.019%
Average Rate of Returns 3.252% 0.200% 1.570%
X = ΣXi/n Y= ΣYi/n Z=ΣZi/n
Standard Deviation 2.56% 6.26% 1.74%
σx = √Σ(x-xi)2/(n-1) σy = √Σ(y-yi)2/(n-1) σz = √Σ(z-zi)2/(n-1)
The above figure shows the computation of Historical Average rate of return and
standard deviation. The company which is selected for this assignment is Bowral Ltd which is to
be analyzed on the basis of the reference company and the market index. The average of return
of the company selected is higher in comparison to reference company and market trend. The
FINANCE FOR MANAGERS
Answer to Question a:
Requirement 1:
Historical Monthly Returns of Market Index:
Date
Monthly Closing
Index
Monthly
Returns
Zi Z = [zi – z(i– 1)]/ z(i- 1)
Sep-17 55459.75
Oct-17 57712.86 4.06%
Nov-17 58813.50 1.91%
Dec-17 60007.77 2.03%
Jan-18 59809.19 -0.33%
Feb-18 59916.01 0.18%
Requirement 2:
Historical Average Rate of Returns & Standard Deviation:
Date Boral Ltd. Reference Co. Market Index Boral Ltd.
Reference
Co.
Market
Index
Xi Yi Zi (X - Xi )2 (Y - Yi )2 (Z - Zi )2
Oct-17 5.61% -8% 4.06% 0.056% 0.672% 0.062%
Nov-17 5.18% -2% 1.91% 0.037% 0.048% 0.001%
Dec-17 3.59% 7% 2.03% 0.001% 0.462% 0.002%
Jan-18 2.70% -2% -0.33% 0.003% 0.048% 0.036%
Feb-18 -0.81% 6% 0.18% 0.165% 0.336% 0.019%
Average Rate of Returns 3.252% 0.200% 1.570%
X = ΣXi/n Y= ΣYi/n Z=ΣZi/n
Standard Deviation 2.56% 6.26% 1.74%
σx = √Σ(x-xi)2/(n-1) σy = √Σ(y-yi)2/(n-1) σz = √Σ(z-zi)2/(n-1)
The above figure shows the computation of Historical Average rate of return and
standard deviation. The company which is selected for this assignment is Bowral Ltd which is to
be analyzed on the basis of the reference company and the market index. The average of return
of the company selected is higher in comparison to reference company and market trend. The
⊘ This is a preview!⊘
Do you want full access?
Subscribe today to unlock all pages.
Trusted by 1+ million students worldwide
3
FINANCE FOR MANAGERS
average rate of return of the Bowral ltd is shown in the above chart at 3.252. The standard
deviation which is shown in the above table for the company 2.56% and that of the market trend
and reference company’s calculated standard deviation is shown at 6.26% and 1.74%
respectively.
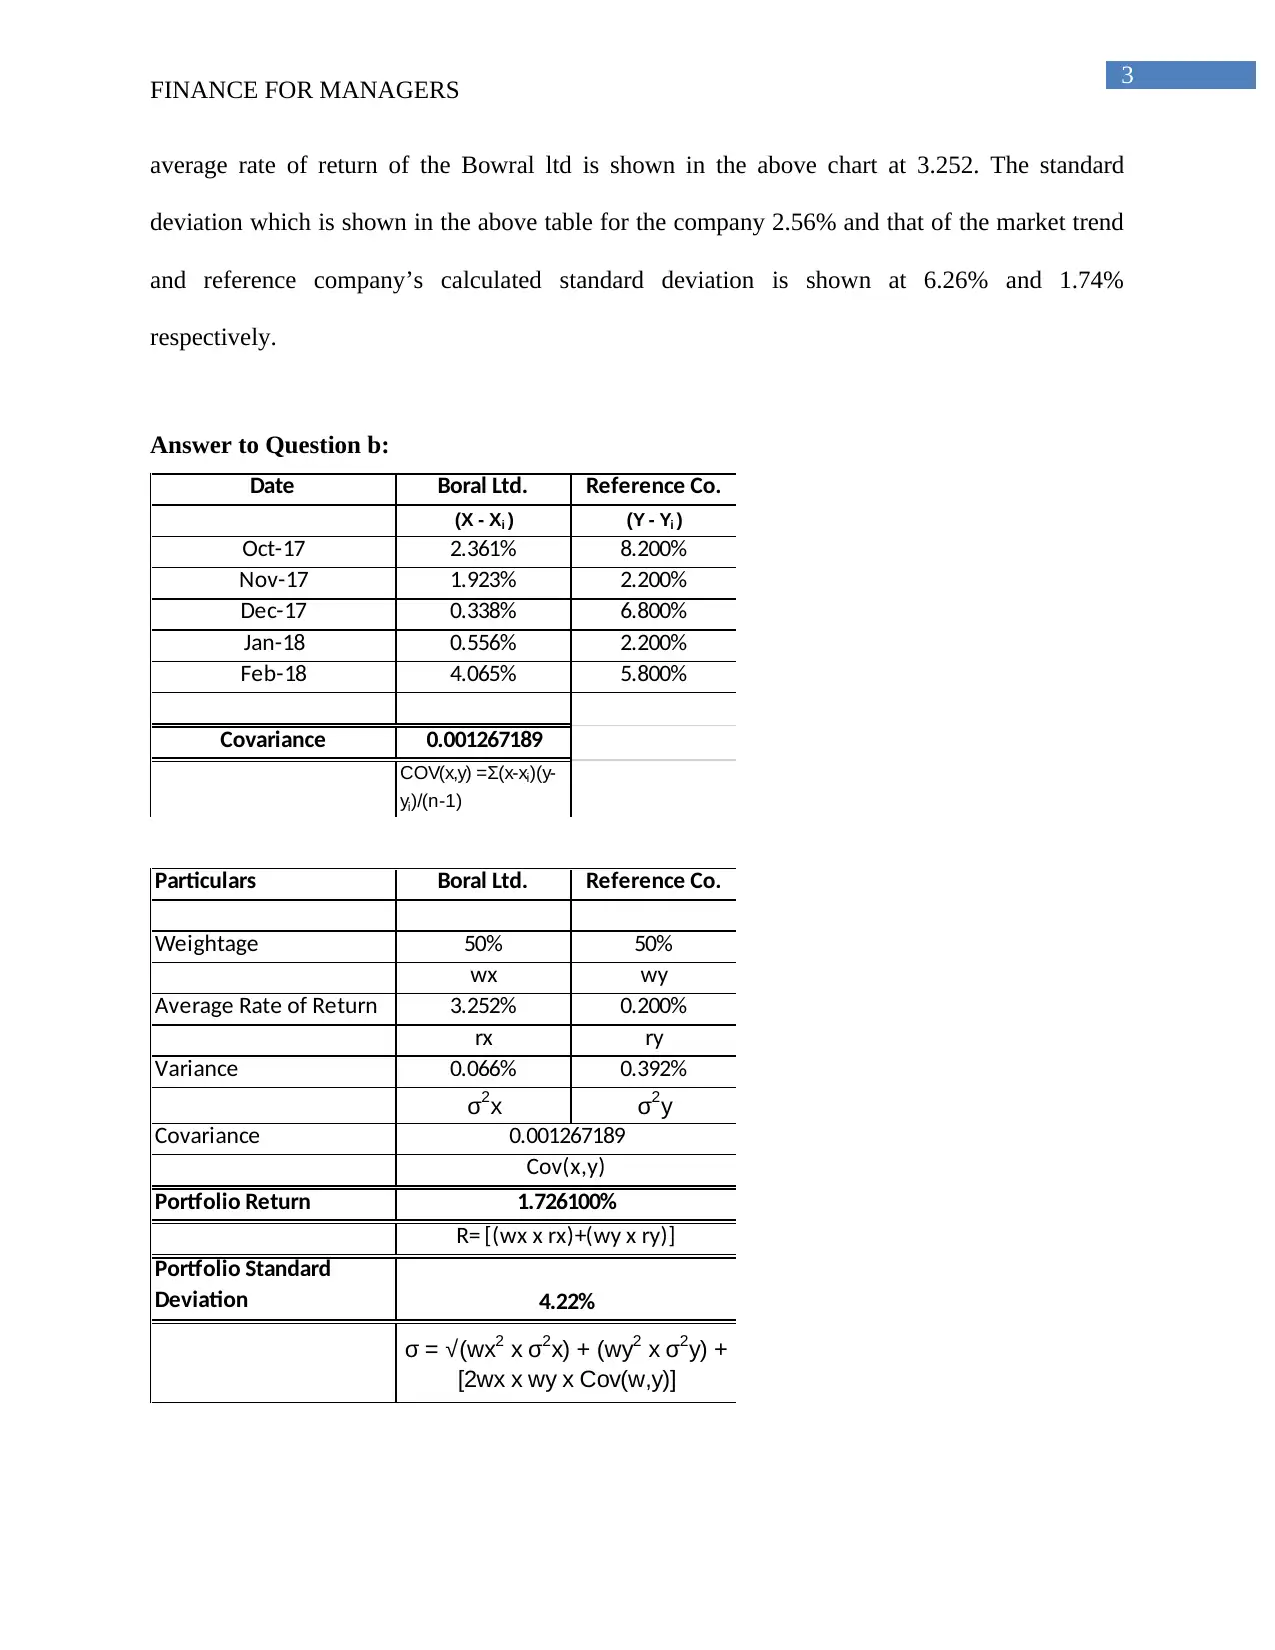
Answer to Question b:
Date Boral Ltd. Reference Co.
(X - Xi ) (Y - Yi )
Oct-17 2.361% 8.200%
Nov-17 1.923% 2.200%
Dec-17 0.338% 6.800%
Jan-18 0.556% 2.200%
Feb-18 4.065% 5.800%
Covariance 0.001267189
COV(x,y) =Σ(x-xi)(y-
yi)/(n-1)
Particulars Boral Ltd. Reference Co.
Weightage 50% 50%
wx wy
Average Rate of Return 3.252% 0.200%
rx ry
Variance 0.066% 0.392%
σ2x σ2y
Covariance
Portfolio Return
Portfolio Standard
Deviation
0.001267189
Cov(x,y)
1.726100%
R= [(wx x rx)+(wy x ry)]
σ = √(wx2 x σ2x) + (wy2 x σ2y) +
[2wx x wy x Cov(w,y)]
4.22%
FINANCE FOR MANAGERS
average rate of return of the Bowral ltd is shown in the above chart at 3.252. The standard
deviation which is shown in the above table for the company 2.56% and that of the market trend
and reference company’s calculated standard deviation is shown at 6.26% and 1.74%
respectively.
Answer to Question b:
Date Boral Ltd. Reference Co.
(X - Xi ) (Y - Yi )
Oct-17 2.361% 8.200%
Nov-17 1.923% 2.200%
Dec-17 0.338% 6.800%
Jan-18 0.556% 2.200%
Feb-18 4.065% 5.800%
Covariance 0.001267189
COV(x,y) =Σ(x-xi)(y-
yi)/(n-1)
Particulars Boral Ltd. Reference Co.
Weightage 50% 50%
wx wy
Average Rate of Return 3.252% 0.200%
rx ry
Variance 0.066% 0.392%
σ2x σ2y
Covariance
Portfolio Return
Portfolio Standard
Deviation
0.001267189
Cov(x,y)
1.726100%
R= [(wx x rx)+(wy x ry)]
σ = √(wx2 x σ2x) + (wy2 x σ2y) +
[2wx x wy x Cov(w,y)]
4.22%
Paraphrase This Document
Need a fresh take? Get an instant paraphrase of this document with our AI Paraphraser
4
FINANCE FOR MANAGERS
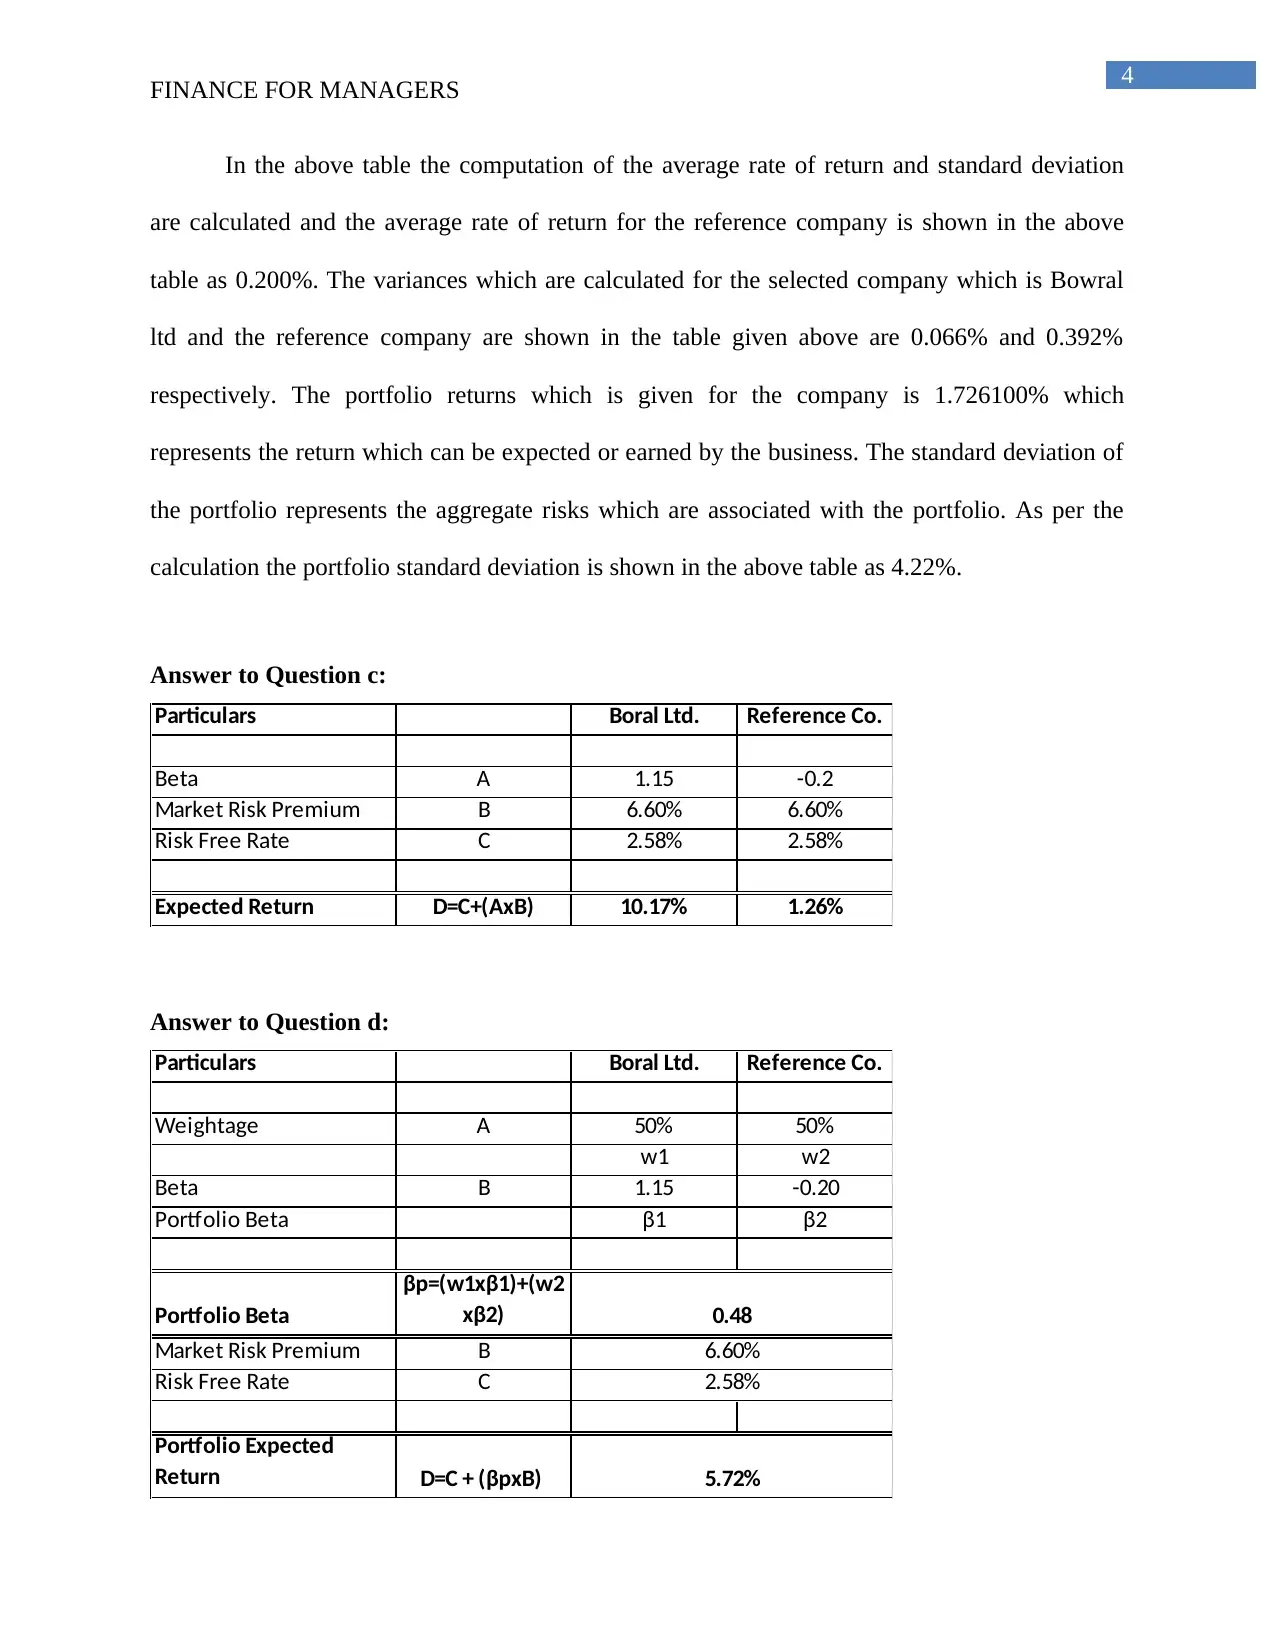
In the above table the computation of the average rate of return and standard deviation
are calculated and the average rate of return for the reference company is shown in the above
table as 0.200%. The variances which are calculated for the selected company which is Bowral
ltd and the reference company are shown in the table given above are 0.066% and 0.392%
respectively. The portfolio returns which is given for the company is 1.726100% which
represents the return which can be expected or earned by the business. The standard deviation of
the portfolio represents the aggregate risks which are associated with the portfolio. As per the
calculation the portfolio standard deviation is shown in the above table as 4.22%.
Answer to Question c:
Particulars Boral Ltd. Reference Co.
Beta A 1.15 -0.2
Market Risk Premium B 6.60% 6.60%
Risk Free Rate C 2.58% 2.58%
Expected Return D=C+(AxB) 10.17% 1.26%
Answer to Question d:
Particulars Boral Ltd. Reference Co.
Weightage A 50% 50%
w1 w2
Beta B 1.15 -0.20
Portfolio Beta β1 β2
Portfolio Beta
βp=(w1xβ1)+(w2
xβ2)
Market Risk Premium B
Risk Free Rate C
Portfolio Expected
Return D=C + (βpxB)
0.48
6.60%
2.58%
5.72%
FINANCE FOR MANAGERS
In the above table the computation of the average rate of return and standard deviation
are calculated and the average rate of return for the reference company is shown in the above
table as 0.200%. The variances which are calculated for the selected company which is Bowral
ltd and the reference company are shown in the table given above are 0.066% and 0.392%
respectively. The portfolio returns which is given for the company is 1.726100% which
represents the return which can be expected or earned by the business. The standard deviation of
the portfolio represents the aggregate risks which are associated with the portfolio. As per the
calculation the portfolio standard deviation is shown in the above table as 4.22%.
Answer to Question c:
Particulars Boral Ltd. Reference Co.
Beta A 1.15 -0.2
Market Risk Premium B 6.60% 6.60%
Risk Free Rate C 2.58% 2.58%
Expected Return D=C+(AxB) 10.17% 1.26%
Answer to Question d:
Particulars Boral Ltd. Reference Co.
Weightage A 50% 50%
w1 w2
Beta B 1.15 -0.20
Portfolio Beta β1 β2
Portfolio Beta
βp=(w1xβ1)+(w2
xβ2)
Market Risk Premium B
Risk Free Rate C
Portfolio Expected
Return D=C + (βpxB)
0.48
6.60%
2.58%
5.72%
5
FINANCE FOR MANAGERS
Answer to Question e:
The issue that has been presented in the question is that the risk and return measures that
have been calculated have been asked to discuss. The particular trend that can be observed from
the set of computations that have been carried out in this particular study refers to the fact that
the rate of return and risk rate in a normal situation are effectively high. However, when the
particular portfolio has been constructed the percentage of returns decreases optimally but the
rate of risk decreases by a rapid rate. Therefore, it can be further be concluded that the
construction of a portfolio results in a decreased rate of risk.
This can be further evidenced by the modern portfolio theory that puts forward a
particular hypothesis based on the idea that the investors that are risk-averse in nature will be
able to construct the portfolios for the purpose of maximizing the expected return that has been
based on a given level of market risk (Schulmerich, Leporcher and Eu 2015). The modern
portfolio theory has been founded on the particular emphasis that the particular component of
financial risk is an inherent part of the higher reward. The modern portfolio theory further
suggests that it will be possible to create an efficient barrier in regards to the construction of
optimal portfolios by facilitating a rate of estimated return that is maximum for a given level of
risk. Moreover, it should be noted here that by investing in a multiple stocks an investor could
gain the advantages of diversification and reduction in the riskiness of the constructed portfolio
(Hawley and Lukomnik 2018).
The analysis of the above risks and returns can be done on the basis of the Modern
portfolio theory. The modern portfolio theory states that a risk averse investor will be
constructing a portfolio in order to get as much returns from the market as possible considering a
given level of market risks. The theory recognizes that the risks which are associated with a
⊘ This is a preview!⊘
Do you want full access?
Subscribe today to unlock all pages.
Trusted by 1+ million students worldwide
6
FINANCE FOR MANAGERS
particular portfolio is closely related with the rewards which can be gained from the portfolio.
The theory is closely followed by the investors to decide in which portfolio the investors can
invest in order to amplify the returns associated with the portfolio.
As per the calculations which is shown in tables above the historical returns are computed
for the reference company for the same data is provided in the case study as given in the
assignment. The calculations as shown in the table above also show market trends for which
calculations of have done for the risk associated and the expected return on the same. The
closing stock index are given for the reference company from the month of September 2017 to
February 2018. As per the market closing stock index the index has been fluctuating in nature.
The monthly closing index shows that it has increased from 55459.75 in September 17 and
further shown an increasing trend in the months of October, November, December and then it
has decreased in January 2018 which shows an index which was 59809.19. The overall monthly
return in terms of percentage of the returns is shown in the month of October is at 4.06% and
then the return falls in the next month and it is shown at 1.91%. The monthly returns for the
month of December has again increased which is shown at 2.03%. The monthly return of
January which is calculated is shown in negative figure which is not favorable for the business.
The analysis of the risks and returns are carried out on the basis of comparison of Market trend,
Reference company and the selected company which is Bowral ltd. For the purpose of analysis
of market stocks, standard deviation and average rate of return is calculated. The average rate of
return for Bowral limited is more than the return which is expected from the market trend and
reference company. In addition to this the calculation also show the analysis of Beta comparison
between the company and the reference company. Beta refers to the measure of volatility of
security or portfolio and it represent the systematic risks which are associated with the portfolio
Paraphrase This Document
Need a fresh take? Get an instant paraphrase of this document with our AI Paraphraser
7
FINANCE FOR MANAGERS
or security. In case of a security where the beta needs to be calculated than the covariances of the
security’s returns in order so that the measure of beta is effectively done. The beta of the
company responds to the various market swings. The use of beta is quite useful in the capital
asset pricing model which is used in the calculation of expected return of an asset based on the
beta of the asset and also the expected market returns. The beta of the portfolio which is shown
in the above calculation in case of Bowral ltd show an estimate of 1.15 and the beta of the
portfolio of the reference company is shown in the table at -0.20. The market risk free rate of
return which is shown in the calculation of expected portfolio return shows that the estimate is
6.60% and the risk-free rate of return as shown is of 2.58%. The expected return from the
portfolio which is calculated shows an estimate of 5.72%.
The beta of the portfolio is calculated to be 0.48 which is lower than the 1 which signifies
that the security or the portfolio is less volatile in comparison with the market. In case the beta is
more than 1 than the security or the portfolio is considered to be volatile in comparison to the
market. Similarly, if the beta estimate is equal to 1 then it signifies that the stock or the portfolio
moves with the market. Most of the companies balances the portfolio of the company in such a
way that the risk of the portfolio is minimum and the return which is associated with the
portfolio is more. In the above case as well, the return of the portfolio is comparatively more and
the risks which are associated with the portfolio is relatively less as the beta of the portfolio is
less than one. The analysis of the expected return which the company can generate from the
portfolio and the calculation of the same depends on the Beta, market risk premium and risk-free
rate of return.
8
FINANCE FOR MANAGERS
References and Bibliography
Chen, J.M., 2016. Postmodern Portfolio Theory. In Postmodern Portfolio Theory (pp. 27-38).
Palgrave Macmillan, New York.
Hawley, J. and Lukomnik, J., 2018. The Long and Short of It: Are We Asking the Right
Questions? Modern Portfolio Theory and Time Horizons. Seattle University Law Review, 41(2),
p.449.
Hua, S., Liang, J., Zeng, G., Xu, M., Zhang, C., Yuan, Y., Li, X., Li, P., Liu, J. and Huang, L.,
2015. How to manage future groundwater resource of China under climate change and
urbanization: An optimal stage investment design from modern portfolio theory. Water research,
85, pp.31-37.
Rutterford, J. and Sotiropoulos, D.P., 2016. Financial diversification before modern portfolio
theory: UK financial advice documents in the late nineteenth and the beginning of the twentieth
century. The European Journal of the History of Economic Thought, 23(6), pp.919-945.
Schulmerich, M., Leporcher, Y.M. and Eu, C.H., 2015. Modern portfolio theory and its
problems. In Applied Asset and Risk Management (pp. 101-173). Springer, Berlin, Heidelberg.
Way, R., Lafond, F., Farmer, J.D., Lillo, F. and Panchenko, V., 2017. Wright meets Markowitz:
How standard portfolio theory changes when assets are technologies following experience
curves.
⊘ This is a preview!⊘
Do you want full access?
Subscribe today to unlock all pages.
Trusted by 1+ million students worldwide
1 out of 9

Your All-in-One AI-Powered Toolkit for Academic Success.
+13062052269
info@desklib.com
Available 24*7 on WhatsApp / Email
![[object Object]](/_next/static/media/star-bottom.7253800d.svg)
Unlock your academic potential
© 2024 | Zucol Services PVT LTD | All rights reserved.