Analysis of Verizon's Financial Statements: Performance Review
VerifiedAdded on 2022/12/27
|12
|1286
|89
Report
AI Summary
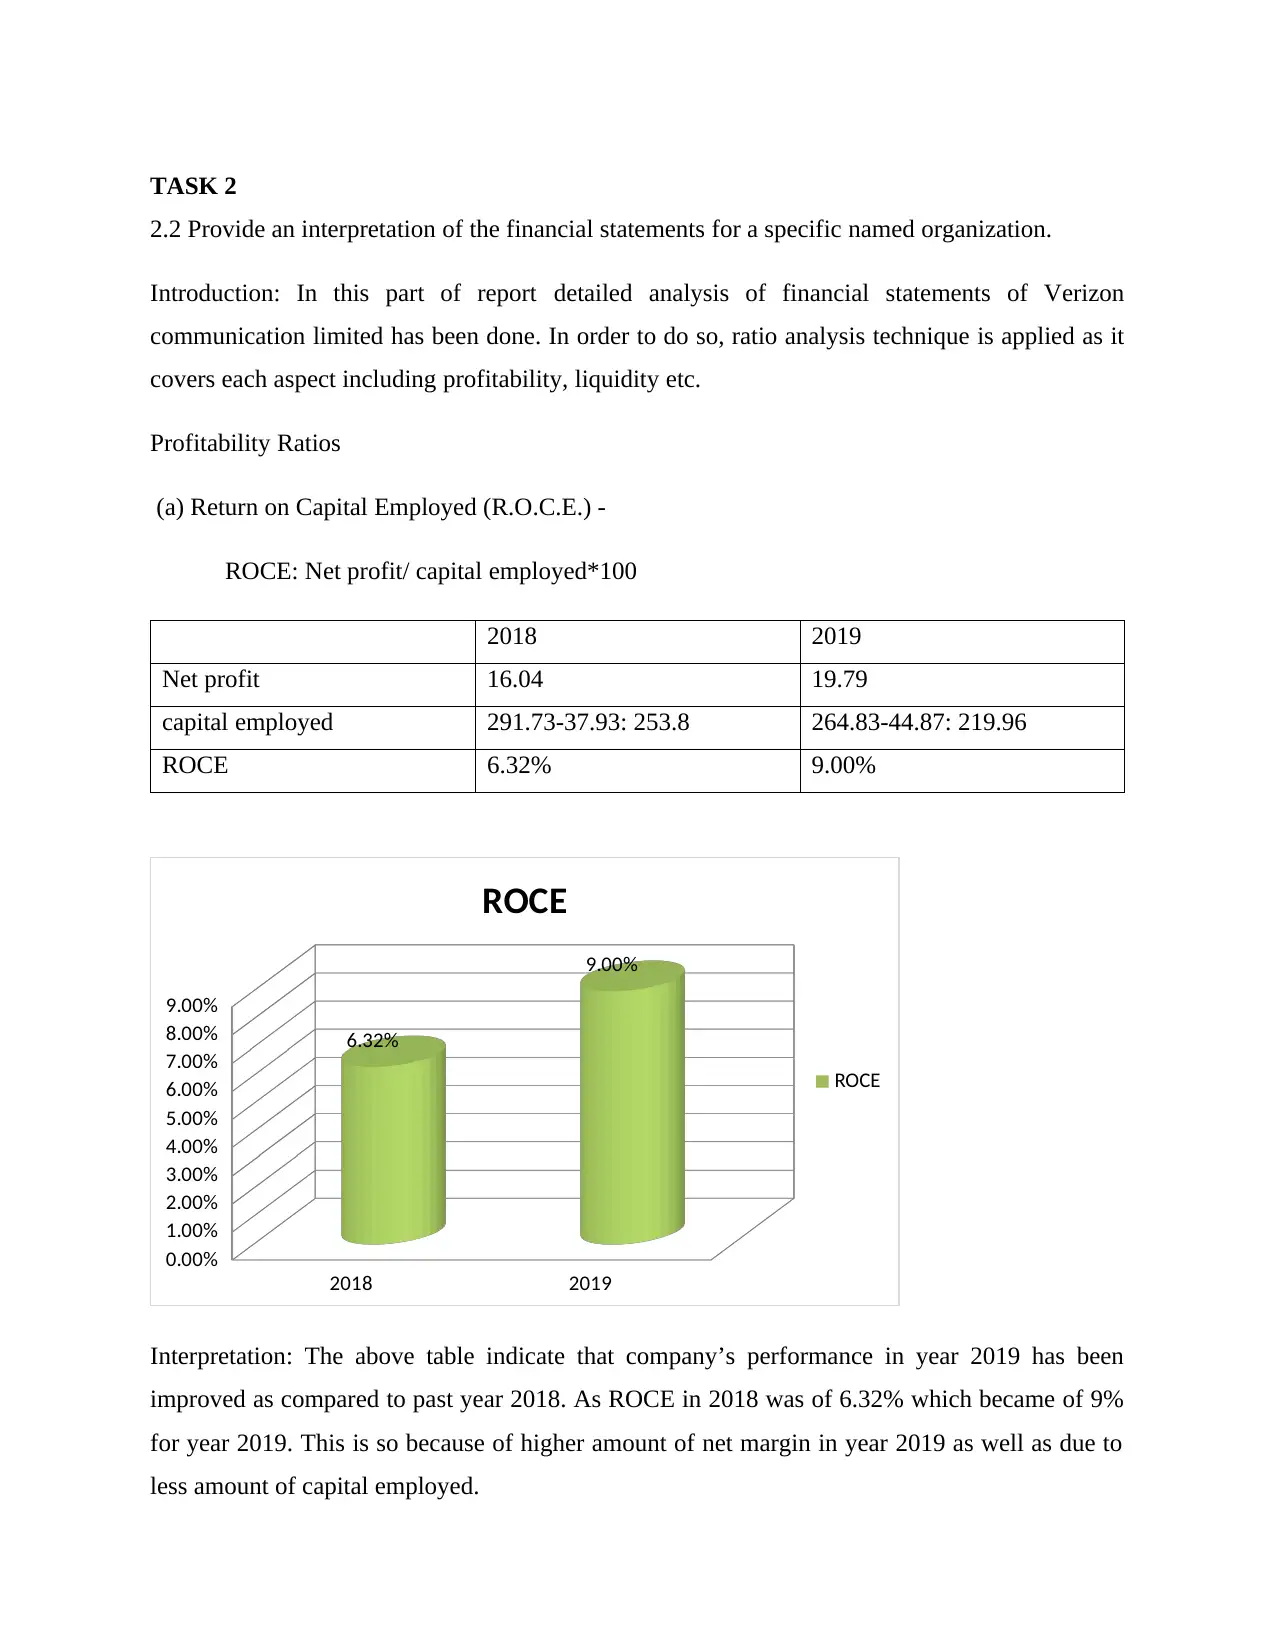
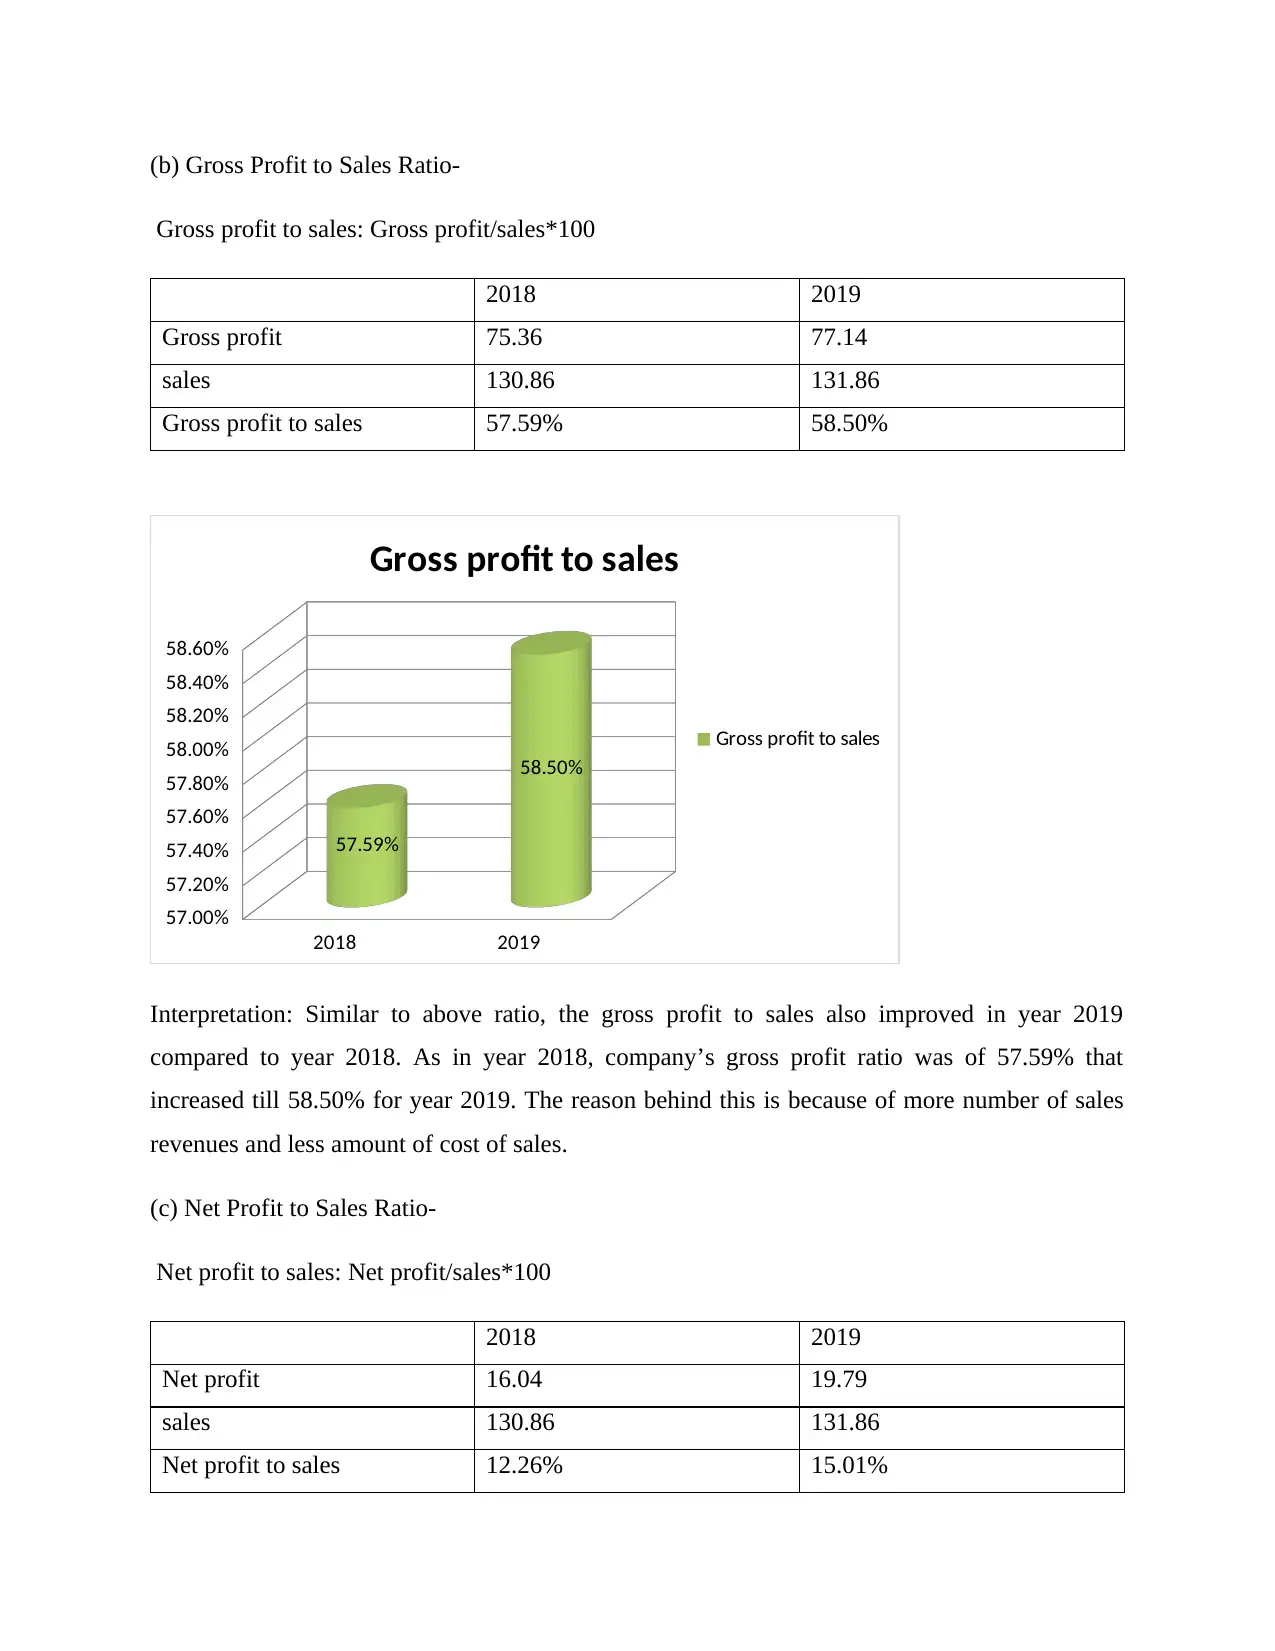
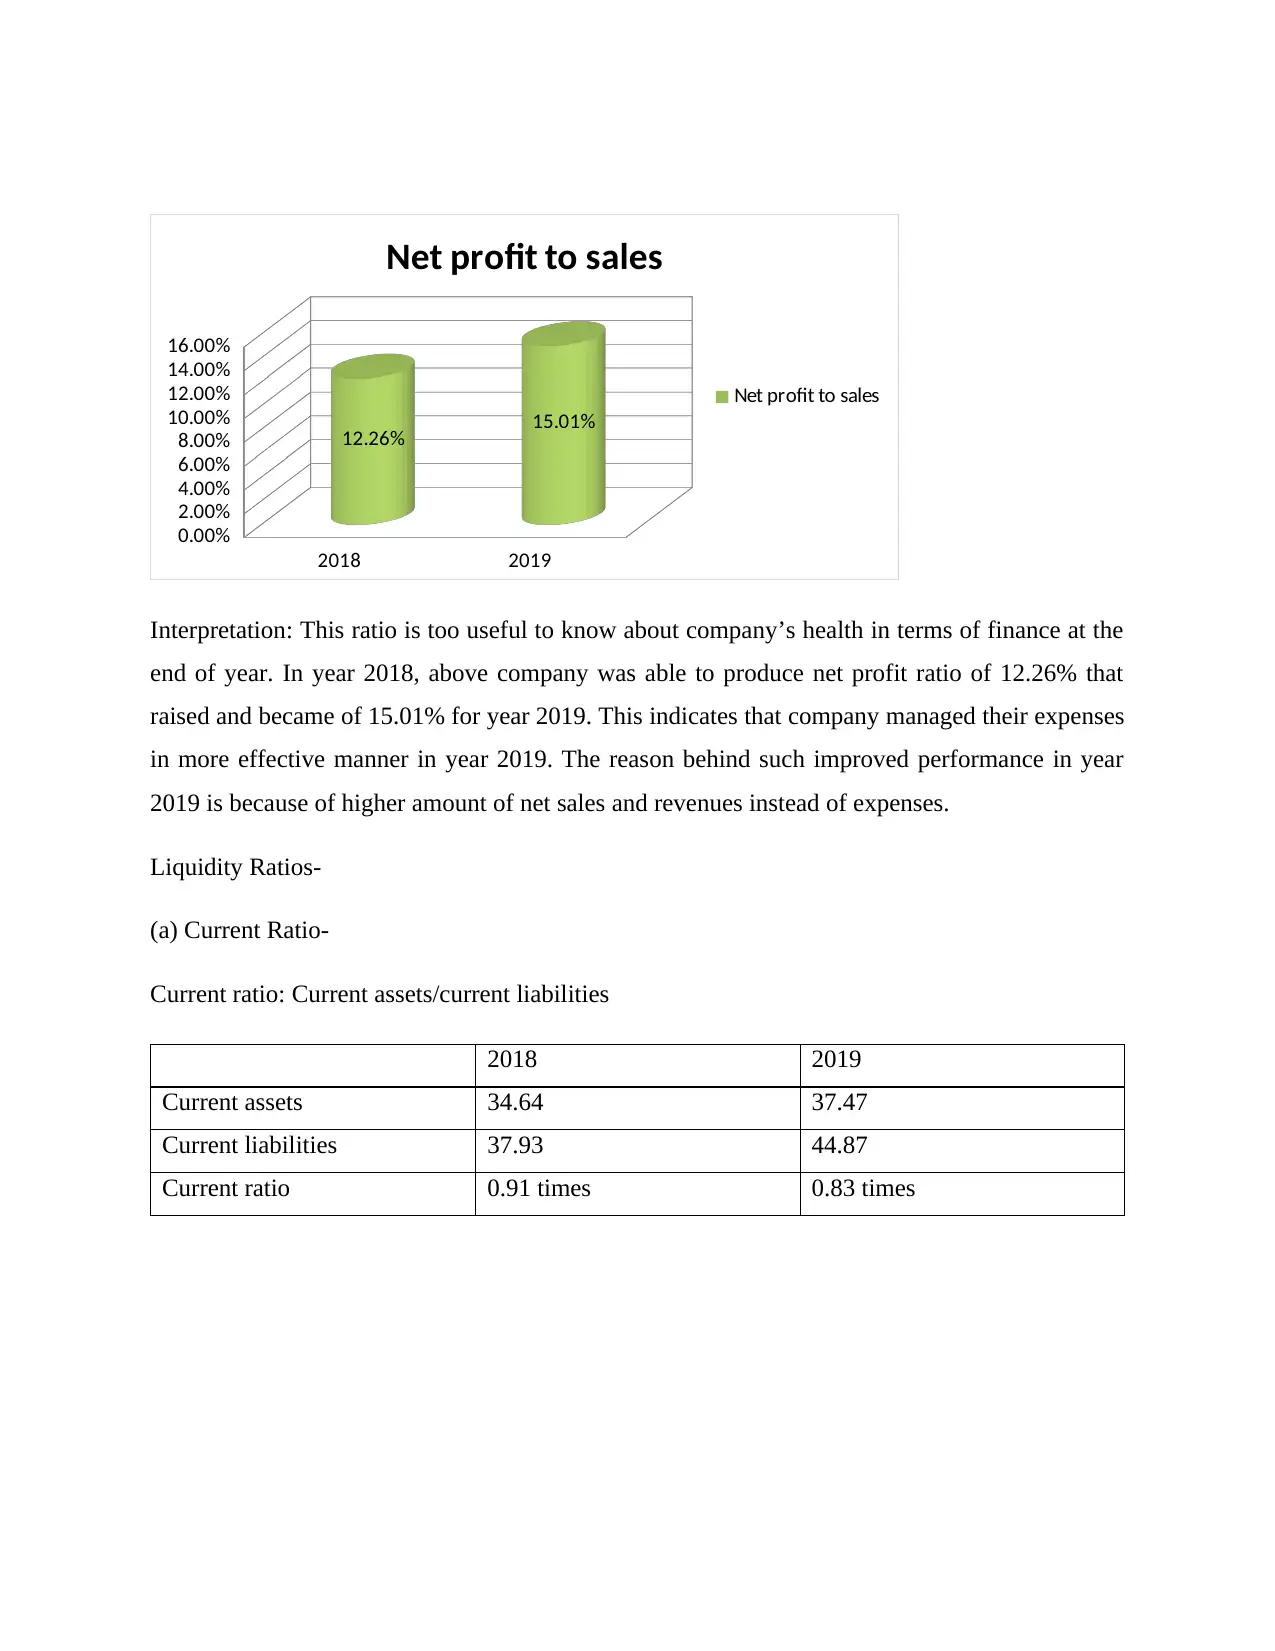
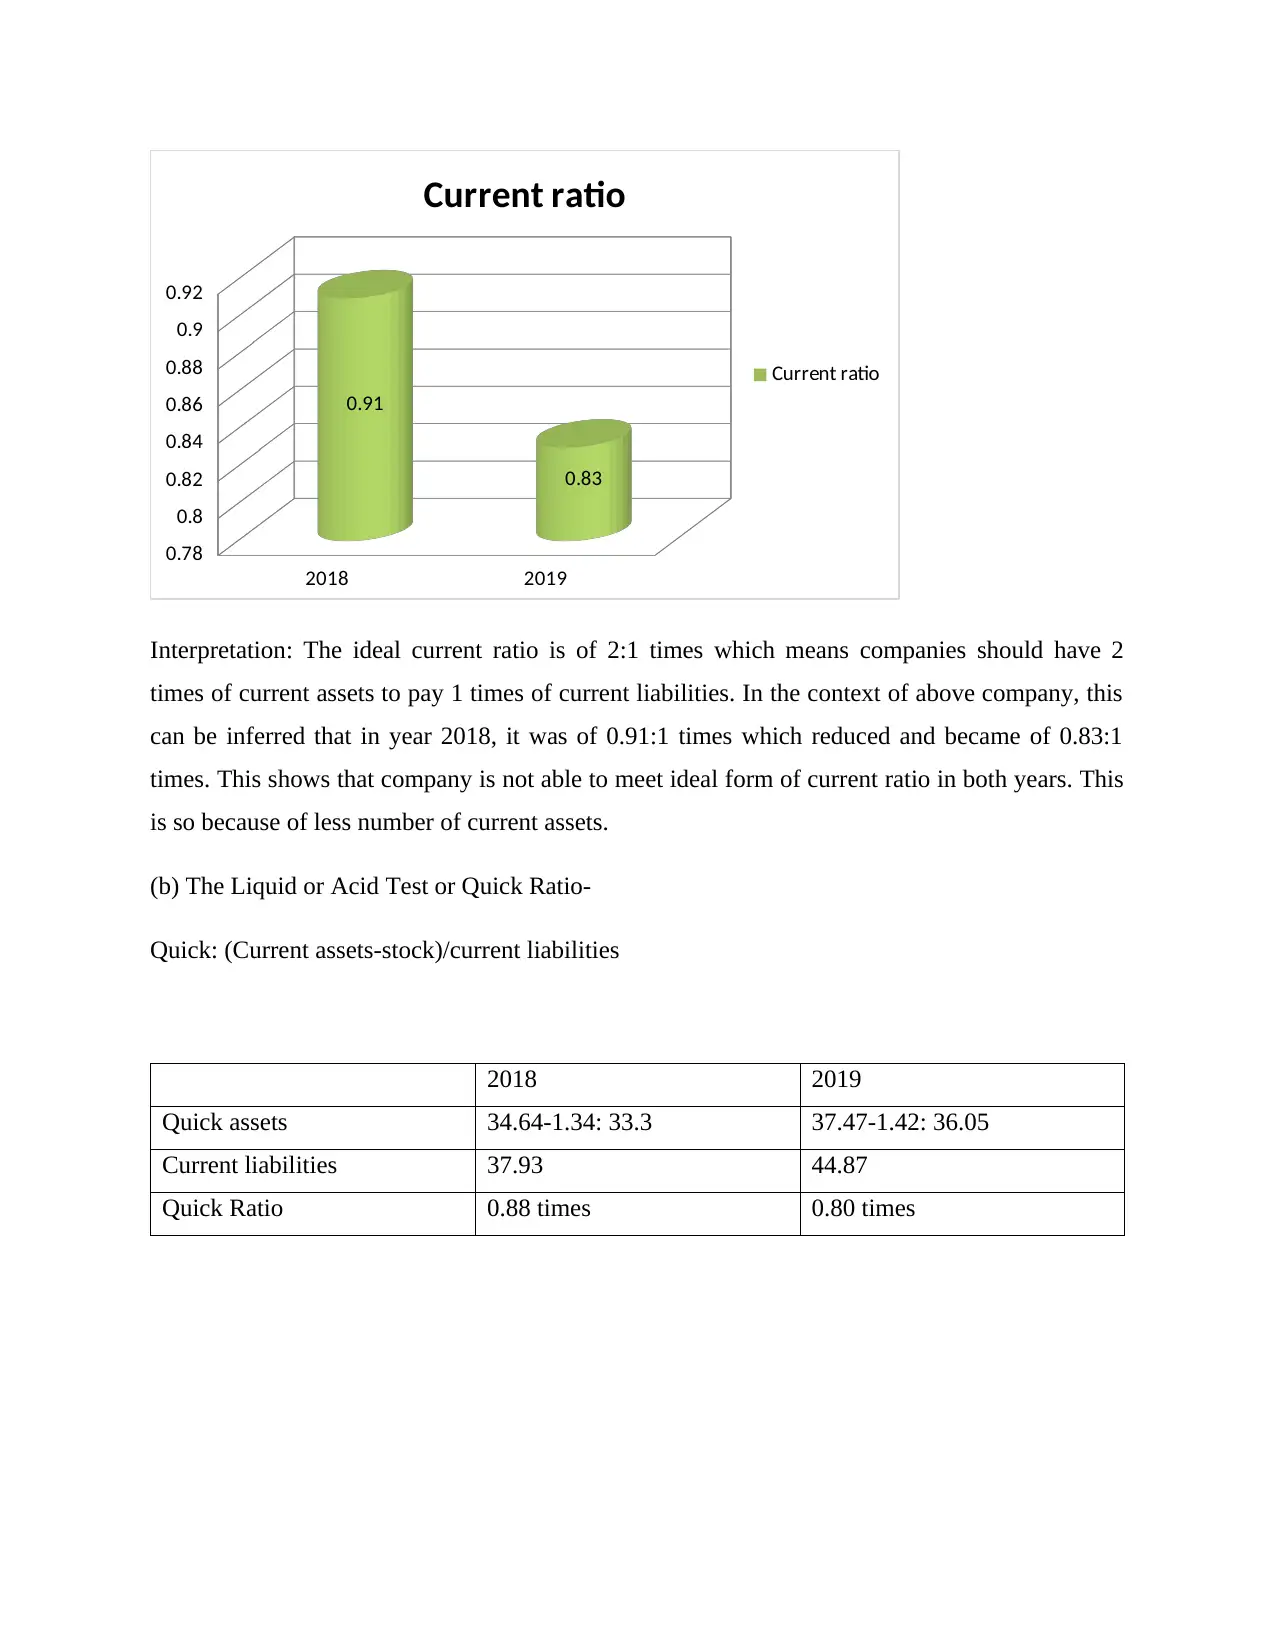
This report provides a detailed financial analysis of Verizon Communications for the years 2018 and 2019. It employs ratio analysis to evaluate the company's performance across various dimensions, including profitability, liquidity, efficiency, and capital gearing. Profitability ratios such as Return on Capital Employed (ROCE), gross profit to sales, and net profit to sales are analyzed to assess the company's earning capabilities. Liquidity ratios, including the current and quick ratios, are examined to determine Verizon's ability to meet short-term obligations. Efficiency ratios, such as the rate of stock turnover and accounts receivable/payable to sales, are used to assess the efficiency of asset management. Finally, capital gearing is analyzed to evaluate the company's financial leverage. The analysis reveals trends and provides interpretations of Verizon's financial health and performance over the specified period, highlighting improvements and areas of concern based on the calculated ratios and their comparisons.


1 out of 12
Related Documents


Your All-in-One AI-Powered Toolkit for Academic Success.
+13062052269
info@desklib.com
Available 24*7 on WhatsApp / Email
![[object Object]](/_next/static/media/star-bottom.7253800d.svg)
Copyright © 2020–2026 A2Z Services. All Rights Reserved. Developed and managed by ZUCOL.