Analyzing Capital Structure and Investment Appraisal Techniques
VerifiedAdded on 2023/03/30
|13
|2529
|111
AI Summary
This document provides an analysis of the capital structure used by JB Hi-Fi and the investment appraisal techniques applied by OnePack Limited. It includes an evaluation of financial ratios, sensitivity analysis, and investment appraisal techniques such as net present value, payback period, profitability index, and internal rate of return. The document also discusses the implications of the findings and the financial viability of the projects.
Contribute Materials
Your contribution can guide someone’s learning journey. Share your
documents today.

Running head: FINANCE FOR MANAGERS
Finance for Managers
Name of the Student:
Name of the University:
Authors Note:
Finance for Managers
Name of the Student:
Name of the University:
Authors Note:
Secure Best Marks with AI Grader
Need help grading? Try our AI Grader for instant feedback on your assignments.

FINANCE FOR MANAGERS
1
Table of Contents
Introduction:...............................................................................................................................2
Task 1:........................................................................................................................................2
1. Analysing the current and historical data of capital structure used by JB-Hi-Fi:..................2
2. Utilising the policy and drawing on the practical and theory applied by the company’s
current characteristics and situation:..........................................................................................4
Task 2: Scrutinizing the proposed project of OnePack’s CEO and indicating the justification
for the different levels of sensitivity analysis............................................................................5
Conclusion:................................................................................................................................9
References and Bibliography:..................................................................................................11
FINANCE FOR MANAGERS
2
Introduction:
The capital structure that is deployed by JB Hi-Fi is relatively evaluated in the
assessment by analyzing the financial performance of the organization for the past 3 years.
The analysis of the capital structure is directly is conducted by examining the different
financial ratios such as debt ratio, equity ratio, Debt equity ratio and dividend payout ratio.
for the analysis conducted on the investment appraisal technique that is deployed for the
project presented Onepack Limited. The financial performance of the project is analyzed by
utilizing different level of investment appraisal techniques and capital budget techniques.
Moreover, sensitivity analysis is also performed for scrutinizing the financial performance of
the project under different sales revenue.
Task 1:
1. Analysing the current and historical data of capital structure used by JB-Hi-Fi:
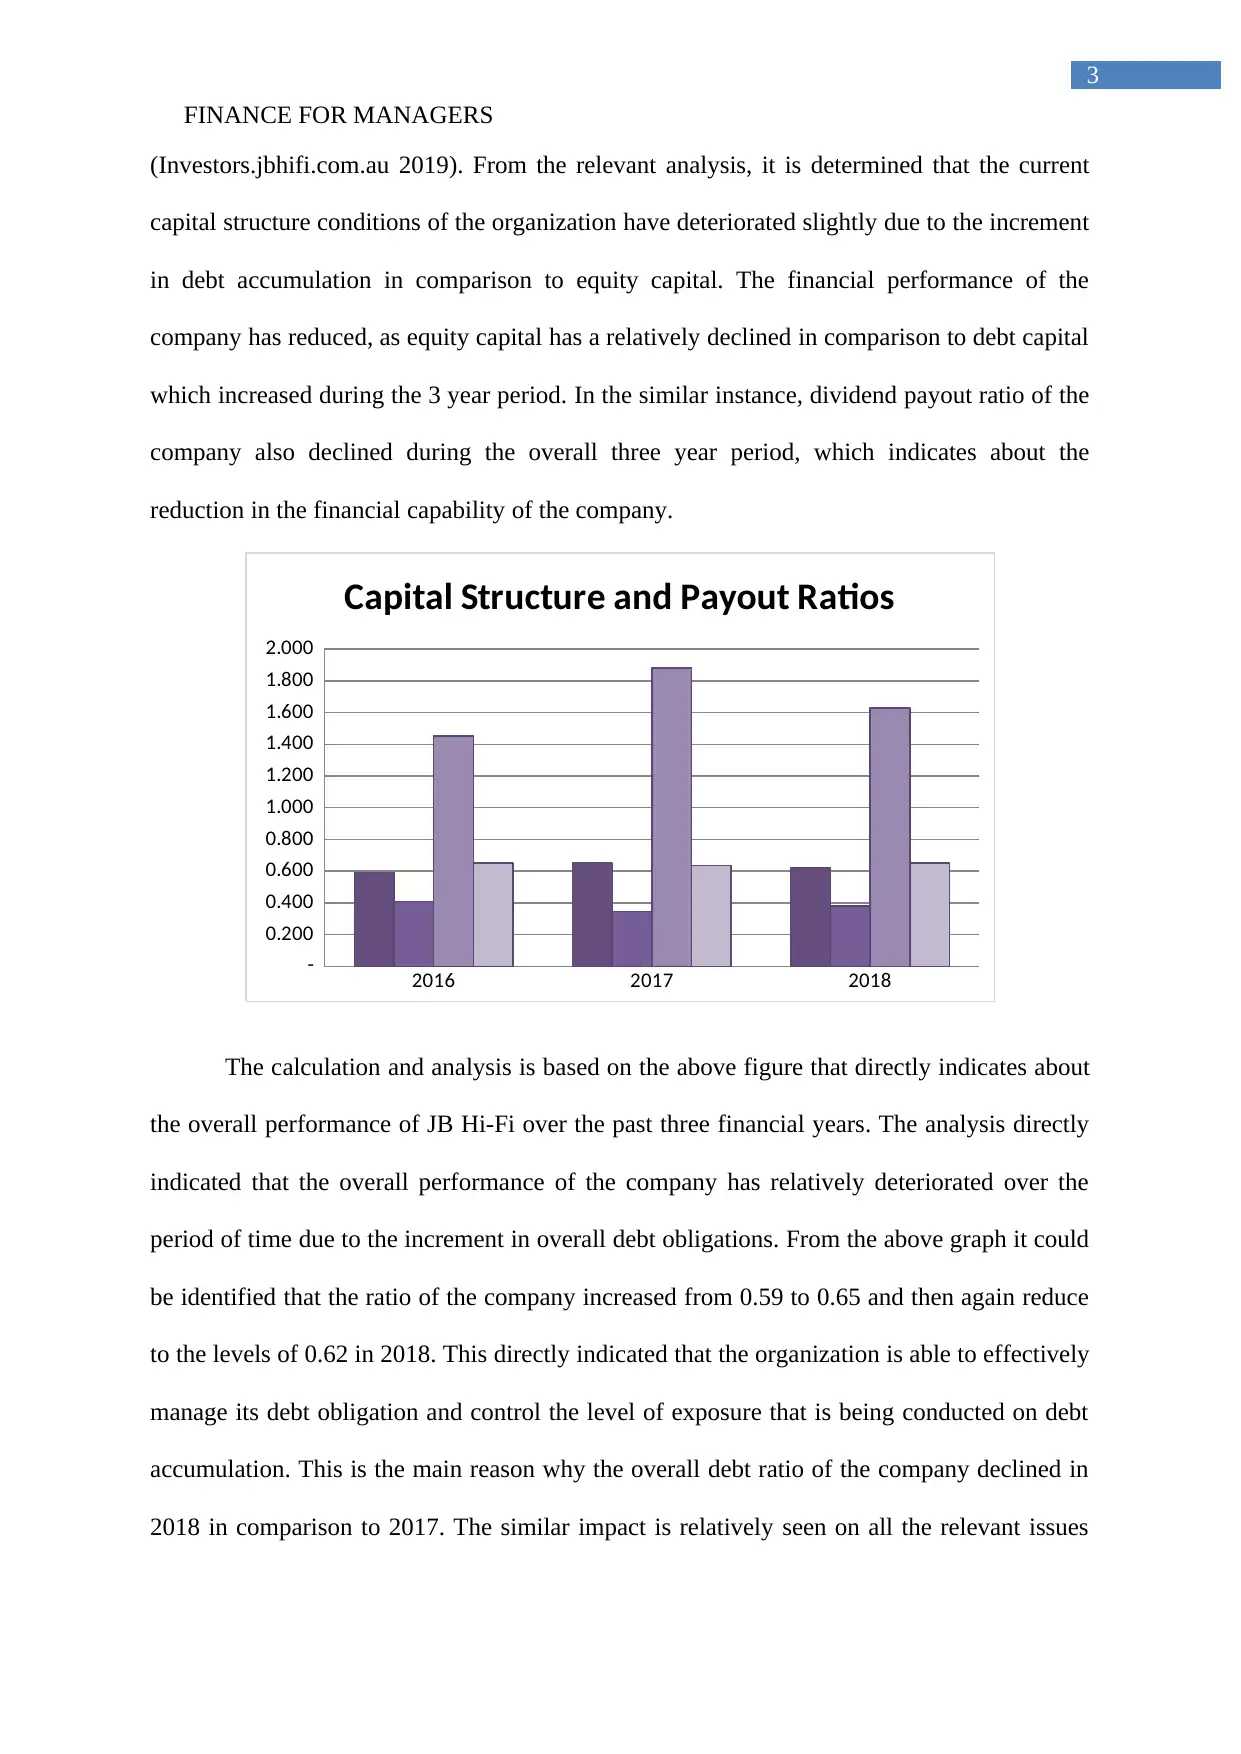
Capital Structure and Payout Ratios:-
Particulars 2016 2017 2018
Total assets $9,92,381.000 $24,59,800.000 $24,91,700.000
Total liabilities $5,87,679.000 $16,06,300.000 $15,44,100.000
Total equity $4,04,702.000 $8,53,600.000 $9,47,600.000
Dividend per share 1.000 1.180 1.320
Earnings per share 1.538 1.860 2.031
Debt ratio 0.592 0.653 0.620
Equity ratio 0.408 0.347 0.380
Debt to equity ratio 1.452 1.882 1.629
Dividend payout ratio 65.020% 63.441% 64.993%
The calculation in the above table presents the capital structure conditions of JB Hi-
Fi for the past financial years. This data has a relatively help in detecting the efficiency
conditions of the capital structure that is deployed by JB Hi-Fi over the period of time
2
Introduction:
The capital structure that is deployed by JB Hi-Fi is relatively evaluated in the
assessment by analyzing the financial performance of the organization for the past 3 years.
The analysis of the capital structure is directly is conducted by examining the different
financial ratios such as debt ratio, equity ratio, Debt equity ratio and dividend payout ratio.
for the analysis conducted on the investment appraisal technique that is deployed for the
project presented Onepack Limited. The financial performance of the project is analyzed by
utilizing different level of investment appraisal techniques and capital budget techniques.
Moreover, sensitivity analysis is also performed for scrutinizing the financial performance of
the project under different sales revenue.
Task 1:
1. Analysing the current and historical data of capital structure used by JB-Hi-Fi:
Capital Structure and Payout Ratios:-
Particulars 2016 2017 2018
Total assets $9,92,381.000 $24,59,800.000 $24,91,700.000
Total liabilities $5,87,679.000 $16,06,300.000 $15,44,100.000
Total equity $4,04,702.000 $8,53,600.000 $9,47,600.000
Dividend per share 1.000 1.180 1.320
Earnings per share 1.538 1.860 2.031
Debt ratio 0.592 0.653 0.620
Equity ratio 0.408 0.347 0.380
Debt to equity ratio 1.452 1.882 1.629
Dividend payout ratio 65.020% 63.441% 64.993%
The calculation in the above table presents the capital structure conditions of JB Hi-
Fi for the past financial years. This data has a relatively help in detecting the efficiency
conditions of the capital structure that is deployed by JB Hi-Fi over the period of time
FINANCE FOR MANAGERS
3
(Investors.jbhifi.com.au 2019). From the relevant analysis, it is determined that the current
capital structure conditions of the organization have deteriorated slightly due to the increment
in debt accumulation in comparison to equity capital. The financial performance of the
company has reduced, as equity capital has a relatively declined in comparison to debt capital
which increased during the 3 year period. In the similar instance, dividend payout ratio of the
company also declined during the overall three year period, which indicates about the
reduction in the financial capability of the company.
2016 2017 2018
-
0.200
0.400
0.600
0.800
1.000
1.200
1.400
1.600
1.800
2.000
Capital Structure and Payout Ratios
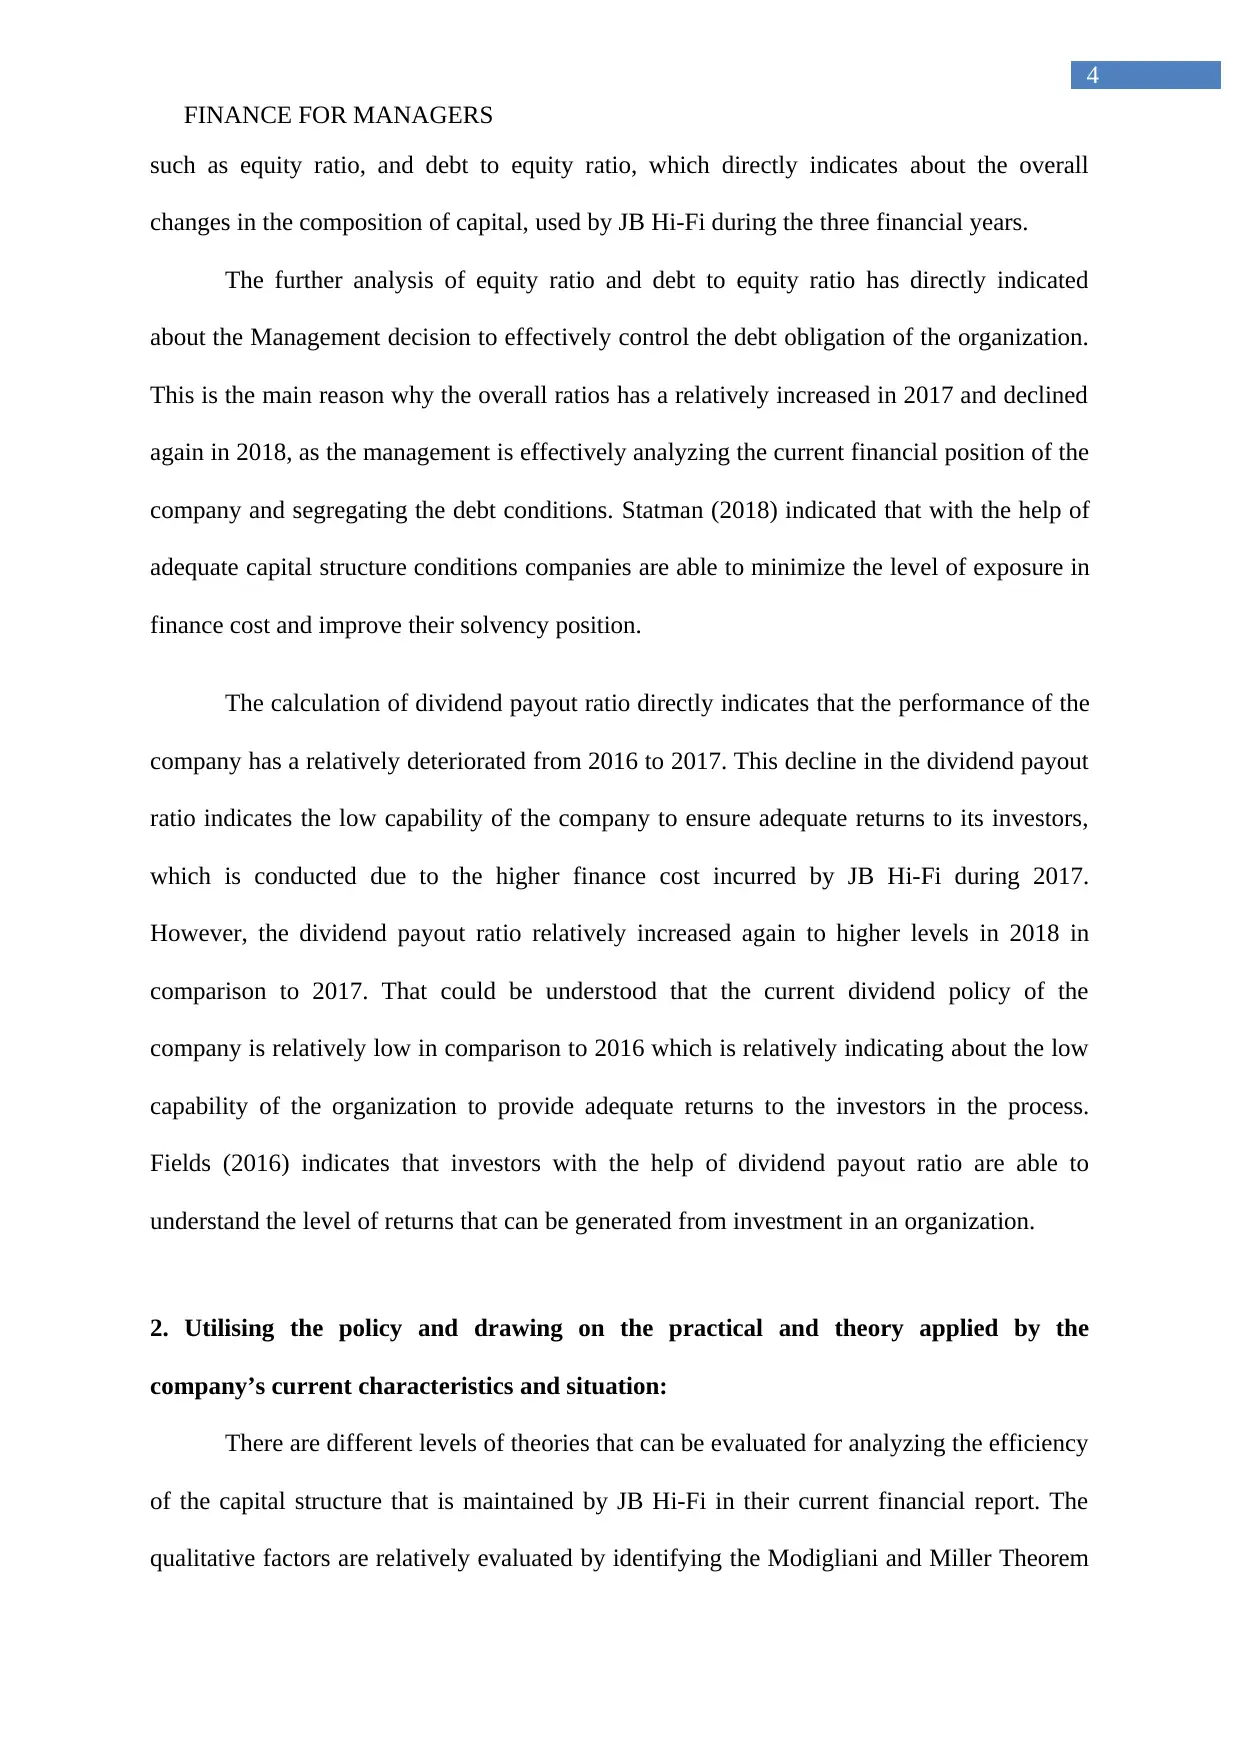
The calculation and analysis is based on the above figure that directly indicates about
the overall performance of JB Hi-Fi over the past three financial years. The analysis directly
indicated that the overall performance of the company has relatively deteriorated over the
period of time due to the increment in overall debt obligations. From the above graph it could
be identified that the ratio of the company increased from 0.59 to 0.65 and then again reduce
to the levels of 0.62 in 2018. This directly indicated that the organization is able to effectively
manage its debt obligation and control the level of exposure that is being conducted on debt
accumulation. This is the main reason why the overall debt ratio of the company declined in
2018 in comparison to 2017. The similar impact is relatively seen on all the relevant issues
3
(Investors.jbhifi.com.au 2019). From the relevant analysis, it is determined that the current
capital structure conditions of the organization have deteriorated slightly due to the increment
in debt accumulation in comparison to equity capital. The financial performance of the
company has reduced, as equity capital has a relatively declined in comparison to debt capital
which increased during the 3 year period. In the similar instance, dividend payout ratio of the
company also declined during the overall three year period, which indicates about the
reduction in the financial capability of the company.
2016 2017 2018
-
0.200
0.400
0.600
0.800
1.000
1.200
1.400
1.600
1.800
2.000
Capital Structure and Payout Ratios
The calculation and analysis is based on the above figure that directly indicates about
the overall performance of JB Hi-Fi over the past three financial years. The analysis directly
indicated that the overall performance of the company has relatively deteriorated over the
period of time due to the increment in overall debt obligations. From the above graph it could
be identified that the ratio of the company increased from 0.59 to 0.65 and then again reduce
to the levels of 0.62 in 2018. This directly indicated that the organization is able to effectively
manage its debt obligation and control the level of exposure that is being conducted on debt
accumulation. This is the main reason why the overall debt ratio of the company declined in
2018 in comparison to 2017. The similar impact is relatively seen on all the relevant issues
Secure Best Marks with AI Grader
Need help grading? Try our AI Grader for instant feedback on your assignments.
FINANCE FOR MANAGERS
4
such as equity ratio, and debt to equity ratio, which directly indicates about the overall
changes in the composition of capital, used by JB Hi-Fi during the three financial years.
The further analysis of equity ratio and debt to equity ratio has directly indicated
about the Management decision to effectively control the debt obligation of the organization.
This is the main reason why the overall ratios has a relatively increased in 2017 and declined
again in 2018, as the management is effectively analyzing the current financial position of the
company and segregating the debt conditions. Statman (2018) indicated that with the help of
adequate capital structure conditions companies are able to minimize the level of exposure in
finance cost and improve their solvency position.
The calculation of dividend payout ratio directly indicates that the performance of the
company has a relatively deteriorated from 2016 to 2017. This decline in the dividend payout
ratio indicates the low capability of the company to ensure adequate returns to its investors,
which is conducted due to the higher finance cost incurred by JB Hi-Fi during 2017.
However, the dividend payout ratio relatively increased again to higher levels in 2018 in
comparison to 2017. That could be understood that the current dividend policy of the
company is relatively low in comparison to 2016 which is relatively indicating about the low
capability of the organization to provide adequate returns to the investors in the process.
Fields (2016) indicates that investors with the help of dividend payout ratio are able to
understand the level of returns that can be generated from investment in an organization.
2. Utilising the policy and drawing on the practical and theory applied by the
company’s current characteristics and situation:
There are different levels of theories that can be evaluated for analyzing the efficiency
of the capital structure that is maintained by JB Hi-Fi in their current financial report. The
qualitative factors are relatively evaluated by identifying the Modigliani and Miller Theorem
FINANCE FOR MANAGERS
5
with relatively analyses the capital structure requirement of an organization. This directly
indicates that capital structure of an organization is relatively not influenced by the overall
composition of debt in the cost of capital. The theorem directly indicates that capital structure
does not require any kind of alterations in their valuation with the changes in debt and other
composition. The Modigliani and Miller theorem also indicates the capital structure of an
organization on the basis of assumption that needs to be conducted on a particular condition.
The theorem directly indicates that there will be no impact of any expense from trading.
Moreover, the financial structure does not impact the actual cash flow conditions of an
organization. These two assumptions are relatively not evaluated on the perspective of real
world application which relatively nullifies the assumptions that is made by Modigliani and
Miller in the theorem justifying the use of capital structure of an organization (France 2016).
After analyzing the capital structure theory, it could be identified that JB Hi-Fi is not
maintaining adequate levels of capital structure to support it operations this is the main reason
why the performance of the company is relatively iterating over the period of time. However,
the management is effectively improving the current financial obligations by restoring capital
structure to adequate levels where equity composition is higher and debt composition is
lower.
Task 2: Scrutinizing the proposed project of OnePack’s CEO and indicating the
justification for the different levels of sensitivity analysis
MEMORANDUM
To,
The CEO,
OnePack Limited
From: The Manager
Date: 10th June 2019
FINANCE FOR MANAGERS
6
Subject:
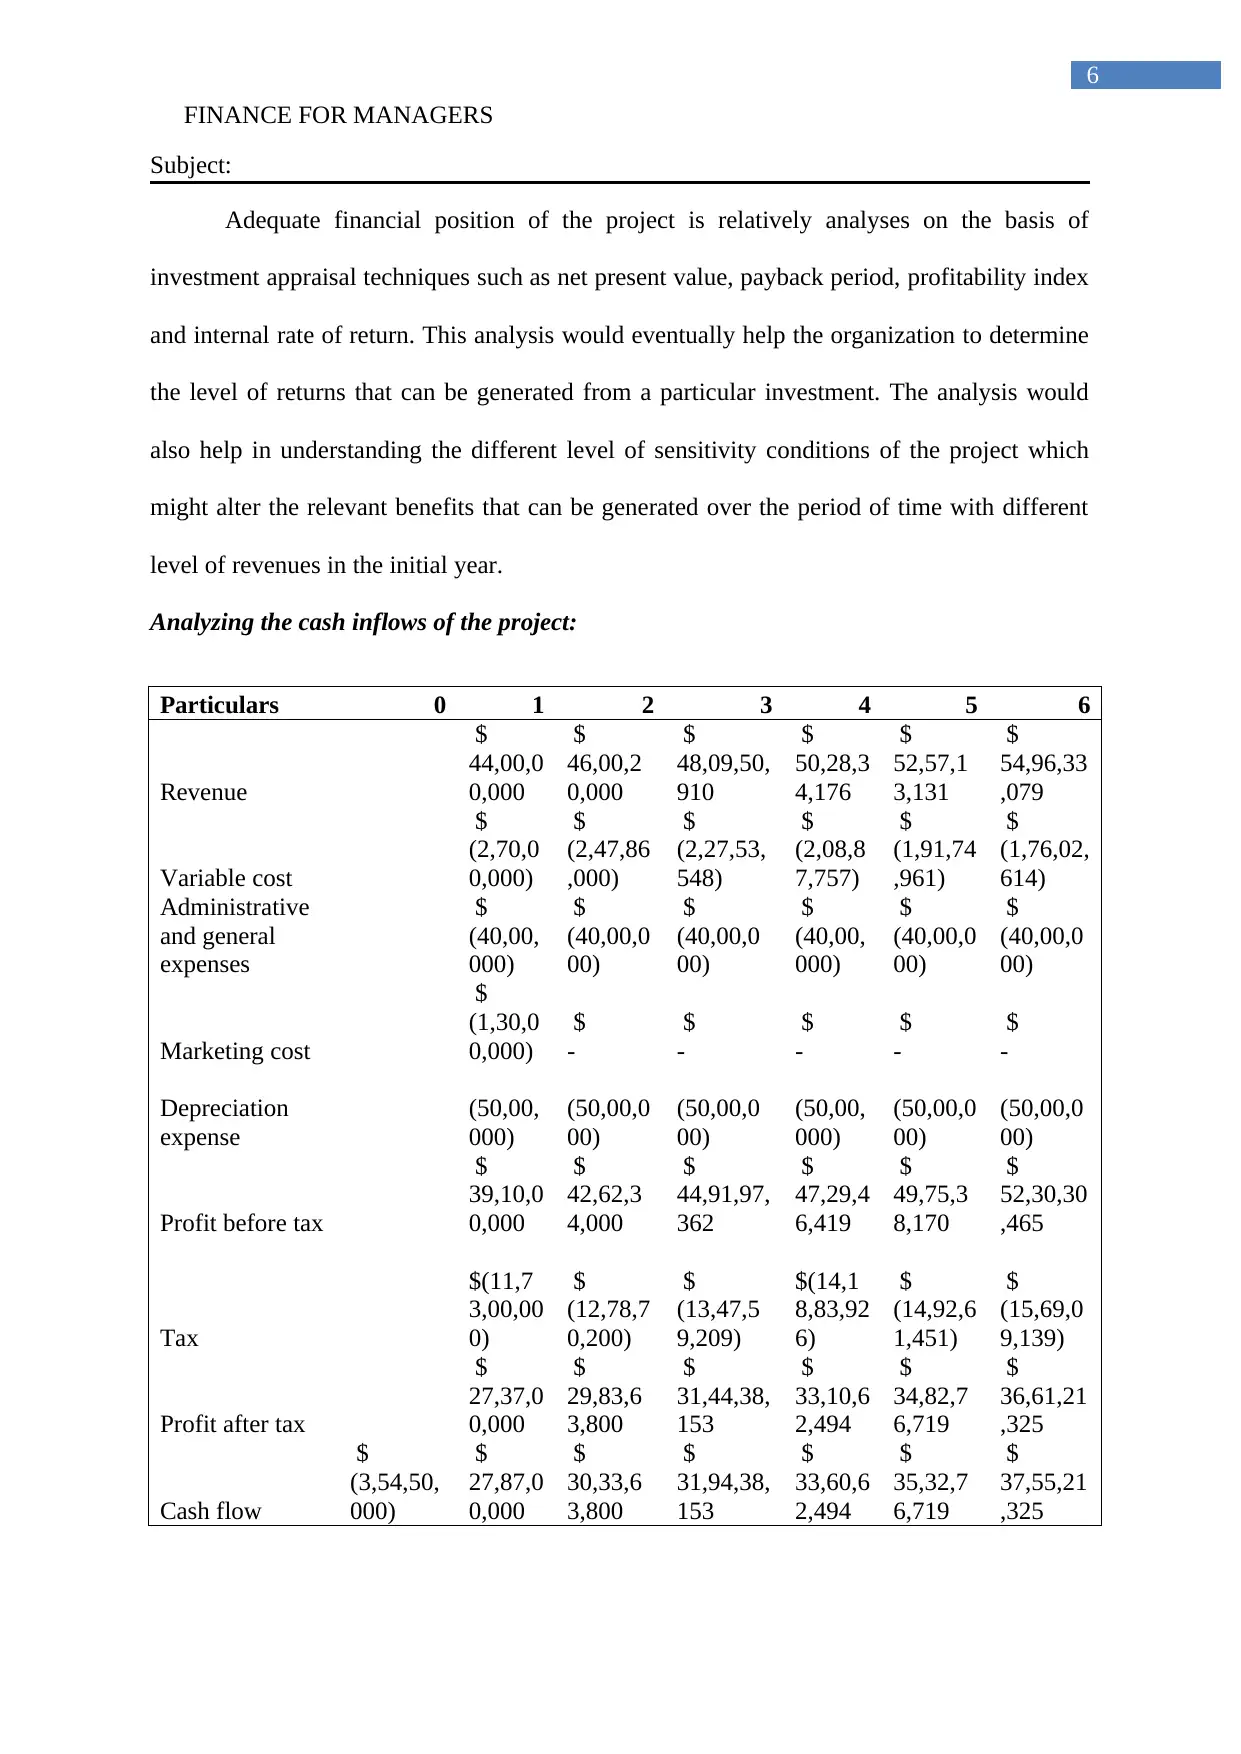
Adequate financial position of the project is relatively analyses on the basis of
investment appraisal techniques such as net present value, payback period, profitability index
and internal rate of return. This analysis would eventually help the organization to determine
the level of returns that can be generated from a particular investment. The analysis would
also help in understanding the different level of sensitivity conditions of the project which
might alter the relevant benefits that can be generated over the period of time with different
level of revenues in the initial year.
Analyzing the cash inflows of the project:
Particulars 0 1 2 3 4 5 6
Revenue
$
44,00,0
0,000
$
46,00,2
0,000
$
48,09,50,
910
$
50,28,3
4,176
$
52,57,1
3,131
$
54,96,33
,079
Variable cost
$
(2,70,0
0,000)
$
(2,47,86
,000)
$
(2,27,53,
548)
$
(2,08,8
7,757)
$
(1,91,74
,961)
$
(1,76,02,
614)
Administrative
and general
expenses
$
(40,00,
000)
$
(40,00,0
00)
$
(40,00,0
00)
$
(40,00,
000)
$
(40,00,0
00)
$
(40,00,0
00)
Marketing cost
$
(1,30,0
0,000)
$
-
$
-
$
-
$
-
$
-
Depreciation
expense
(50,00,
000)
(50,00,0
00)
(50,00,0
00)
(50,00,
000)
(50,00,0
00)
(50,00,0
00)
Profit before tax
$
39,10,0
0,000
$
42,62,3
4,000
$
44,91,97,
362
$
47,29,4
6,419
$
49,75,3
8,170
$
52,30,30
,465
Tax
$(11,7
3,00,00
0)
$
(12,78,7
0,200)
$
(13,47,5
9,209)
$(14,1
8,83,92
6)
$
(14,92,6
1,451)
$
(15,69,0
9,139)
Profit after tax
$
27,37,0
0,000
$
29,83,6
3,800
$
31,44,38,
153
$
33,10,6
2,494
$
34,82,7
6,719
$
36,61,21
,325
Cash flow
$
(3,54,50,
000)
$
27,87,0
0,000
$
30,33,6
3,800
$
31,94,38,
153
$
33,60,6
2,494
$
35,32,7
6,719
$
37,55,21
,325
6
Subject:
Adequate financial position of the project is relatively analyses on the basis of
investment appraisal techniques such as net present value, payback period, profitability index
and internal rate of return. This analysis would eventually help the organization to determine
the level of returns that can be generated from a particular investment. The analysis would
also help in understanding the different level of sensitivity conditions of the project which
might alter the relevant benefits that can be generated over the period of time with different
level of revenues in the initial year.
Analyzing the cash inflows of the project:
Particulars 0 1 2 3 4 5 6
Revenue
$
44,00,0
0,000
$
46,00,2
0,000
$
48,09,50,
910
$
50,28,3
4,176
$
52,57,1
3,131
$
54,96,33
,079
Variable cost
$
(2,70,0
0,000)
$
(2,47,86
,000)
$
(2,27,53,
548)
$
(2,08,8
7,757)
$
(1,91,74
,961)
$
(1,76,02,
614)
Administrative
and general
expenses
$
(40,00,
000)
$
(40,00,0
00)
$
(40,00,0
00)
$
(40,00,
000)
$
(40,00,0
00)
$
(40,00,0
00)
Marketing cost
$
(1,30,0
0,000)
$
-
$
-
$
-
$
-
$
-
Depreciation
expense
(50,00,
000)
(50,00,0
00)
(50,00,0
00)
(50,00,
000)
(50,00,0
00)
(50,00,0
00)
Profit before tax
$
39,10,0
0,000
$
42,62,3
4,000
$
44,91,97,
362
$
47,29,4
6,419
$
49,75,3
8,170
$
52,30,30
,465
Tax
$(11,7
3,00,00
0)
$
(12,78,7
0,200)
$
(13,47,5
9,209)
$(14,1
8,83,92
6)
$
(14,92,6
1,451)
$
(15,69,0
9,139)
Profit after tax
$
27,37,0
0,000
$
29,83,6
3,800
$
31,44,38,
153
$
33,10,6
2,494
$
34,82,7
6,719
$
36,61,21
,325
Cash flow
$
(3,54,50,
000)
$
27,87,0
0,000
$
30,33,6
3,800
$
31,94,38,
153
$
33,60,6
2,494
$
35,32,7
6,719
$
37,55,21
,325
Paraphrase This Document
Need a fresh take? Get an instant paraphrase of this document with our AI Paraphraser
FINANCE FOR MANAGERS
7
The above table provides information about the overall calculation that has been
conducted on the particular Project where all the relevant incomes and expenses are relatively
evaluated to determine the free cash flow of the company over the period of 6 years. This
analysis directly evaluated different level of revenues, variable cost, administrative expenses,
general expenses, marketing cost, depreciation, taxes, and the initial investment that has been
conducted for the particular project. The overall free cash flow can be utilized with the help
of investment appraisal techniques which can provide information about the current financial
capability of the project (Lin 2016). Free cash flow directly provides information about the
future incomes and expenses that will be incurred by the project over the period of time
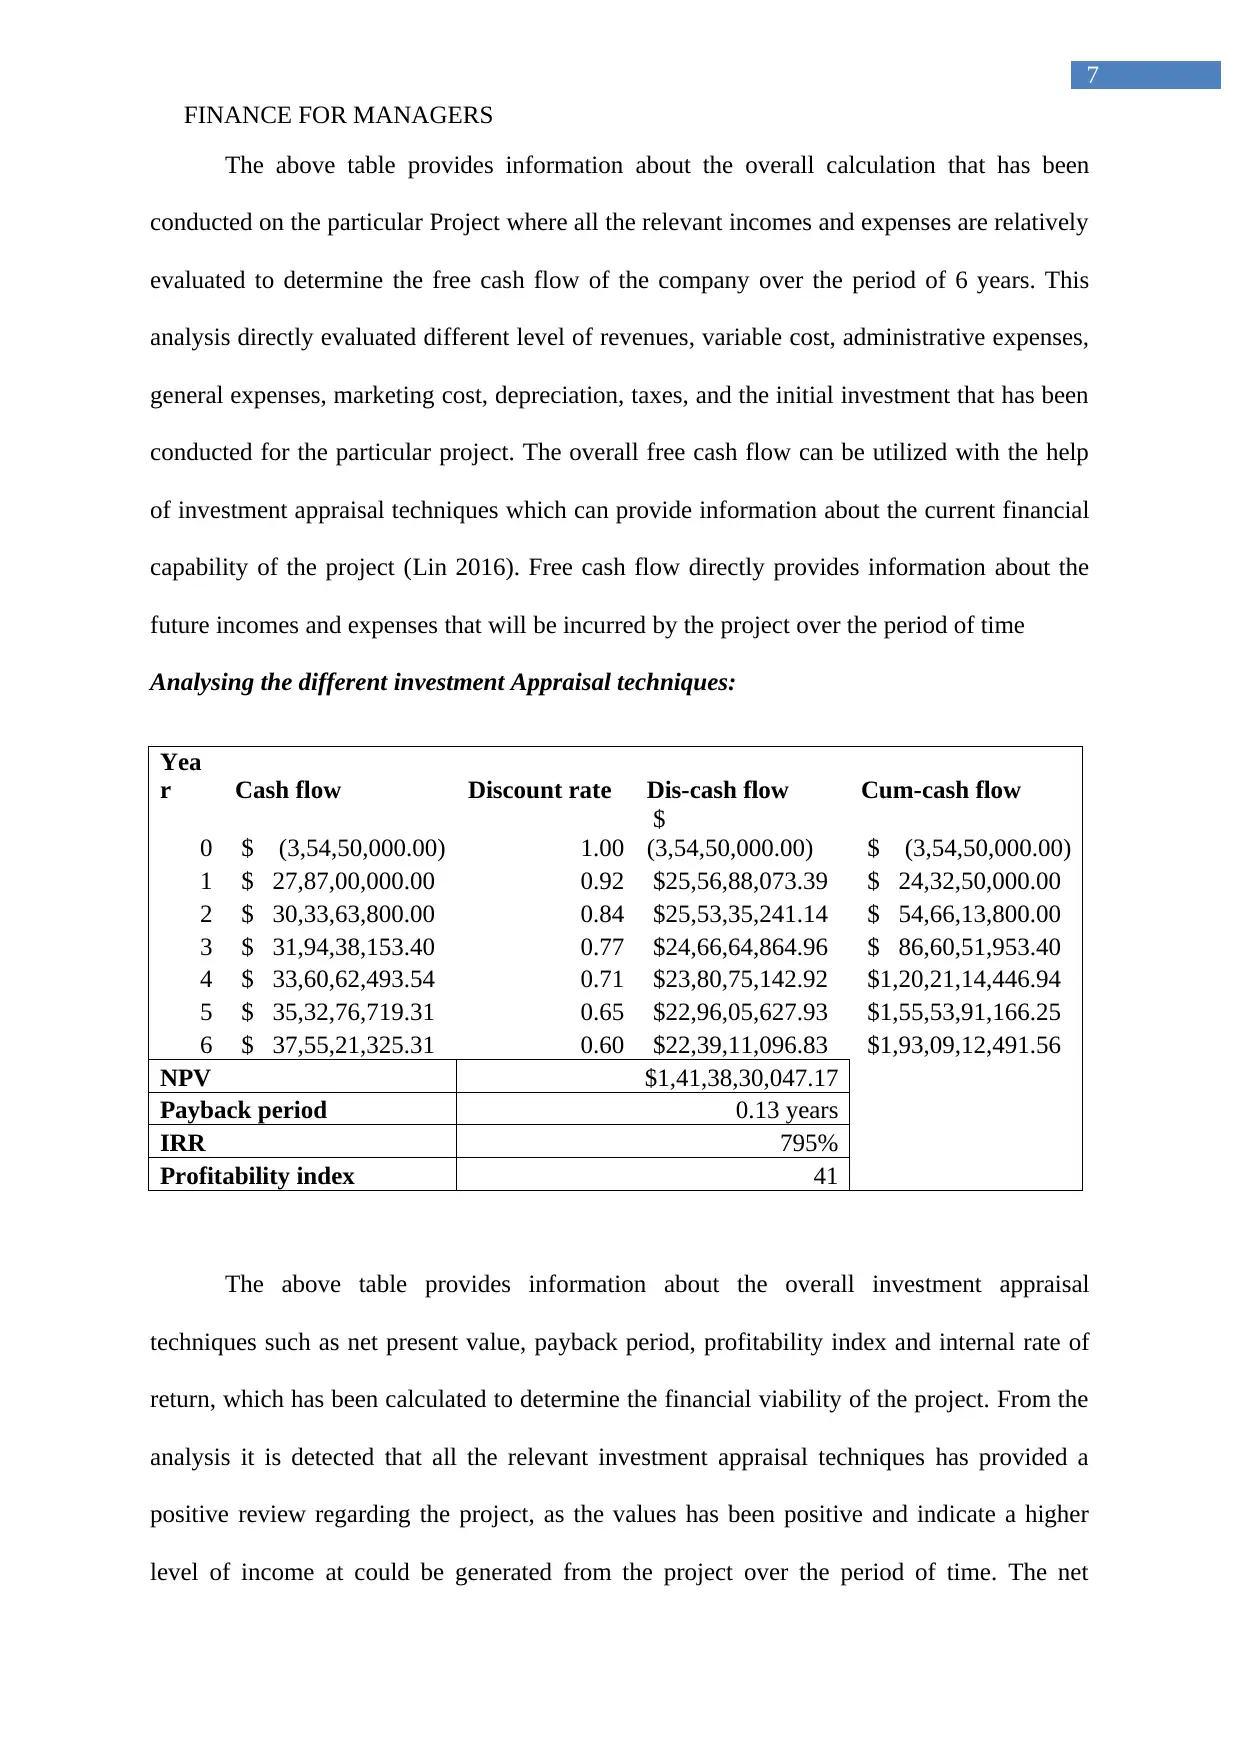
Analysing the different investment Appraisal techniques:
Yea
r Cash flow Discount rate Dis-cash flow Cum-cash flow
0 $ (3,54,50,000.00) 1.00
$
(3,54,50,000.00) $ (3,54,50,000.00)
1 $ 27,87,00,000.00 0.92 $25,56,88,073.39 $ 24,32,50,000.00
2 $ 30,33,63,800.00 0.84 $25,53,35,241.14 $ 54,66,13,800.00
3 $ 31,94,38,153.40 0.77 $24,66,64,864.96 $ 86,60,51,953.40
4 $ 33,60,62,493.54 0.71 $23,80,75,142.92 $1,20,21,14,446.94
5 $ 35,32,76,719.31 0.65 $22,96,05,627.93 $1,55,53,91,166.25
6 $ 37,55,21,325.31 0.60 $22,39,11,096.83 $1,93,09,12,491.56
NPV $1,41,38,30,047.17
Payback period 0.13 years
IRR 795%
Profitability index 41
The above table provides information about the overall investment appraisal
techniques such as net present value, payback period, profitability index and internal rate of
return, which has been calculated to determine the financial viability of the project. From the
analysis it is detected that all the relevant investment appraisal techniques has provided a
positive review regarding the project, as the values has been positive and indicate a higher
level of income at could be generated from the project over the period of time. The net
7
The above table provides information about the overall calculation that has been
conducted on the particular Project where all the relevant incomes and expenses are relatively
evaluated to determine the free cash flow of the company over the period of 6 years. This
analysis directly evaluated different level of revenues, variable cost, administrative expenses,
general expenses, marketing cost, depreciation, taxes, and the initial investment that has been
conducted for the particular project. The overall free cash flow can be utilized with the help
of investment appraisal techniques which can provide information about the current financial
capability of the project (Lin 2016). Free cash flow directly provides information about the
future incomes and expenses that will be incurred by the project over the period of time
Analysing the different investment Appraisal techniques:
Yea
r Cash flow Discount rate Dis-cash flow Cum-cash flow
0 $ (3,54,50,000.00) 1.00
$
(3,54,50,000.00) $ (3,54,50,000.00)
1 $ 27,87,00,000.00 0.92 $25,56,88,073.39 $ 24,32,50,000.00
2 $ 30,33,63,800.00 0.84 $25,53,35,241.14 $ 54,66,13,800.00
3 $ 31,94,38,153.40 0.77 $24,66,64,864.96 $ 86,60,51,953.40
4 $ 33,60,62,493.54 0.71 $23,80,75,142.92 $1,20,21,14,446.94
5 $ 35,32,76,719.31 0.65 $22,96,05,627.93 $1,55,53,91,166.25
6 $ 37,55,21,325.31 0.60 $22,39,11,096.83 $1,93,09,12,491.56
NPV $1,41,38,30,047.17
Payback period 0.13 years
IRR 795%
Profitability index 41
The above table provides information about the overall investment appraisal
techniques such as net present value, payback period, profitability index and internal rate of
return, which has been calculated to determine the financial viability of the project. From the
analysis it is detected that all the relevant investment appraisal techniques has provided a
positive review regarding the project, as the values has been positive and indicate a higher
level of income at could be generated from the project over the period of time. The net
FINANCE FOR MANAGERS
8
present value directly indicated a positive attribute, while the payback period has shown that
within one year the overall investment will be recovered by the project (Edelman, Jiang and
Thomas 2018). In the same instance, both internal rate of return and profitability index as
shown of high values, which state about the profitability that would be generated by the
project over the period of time.
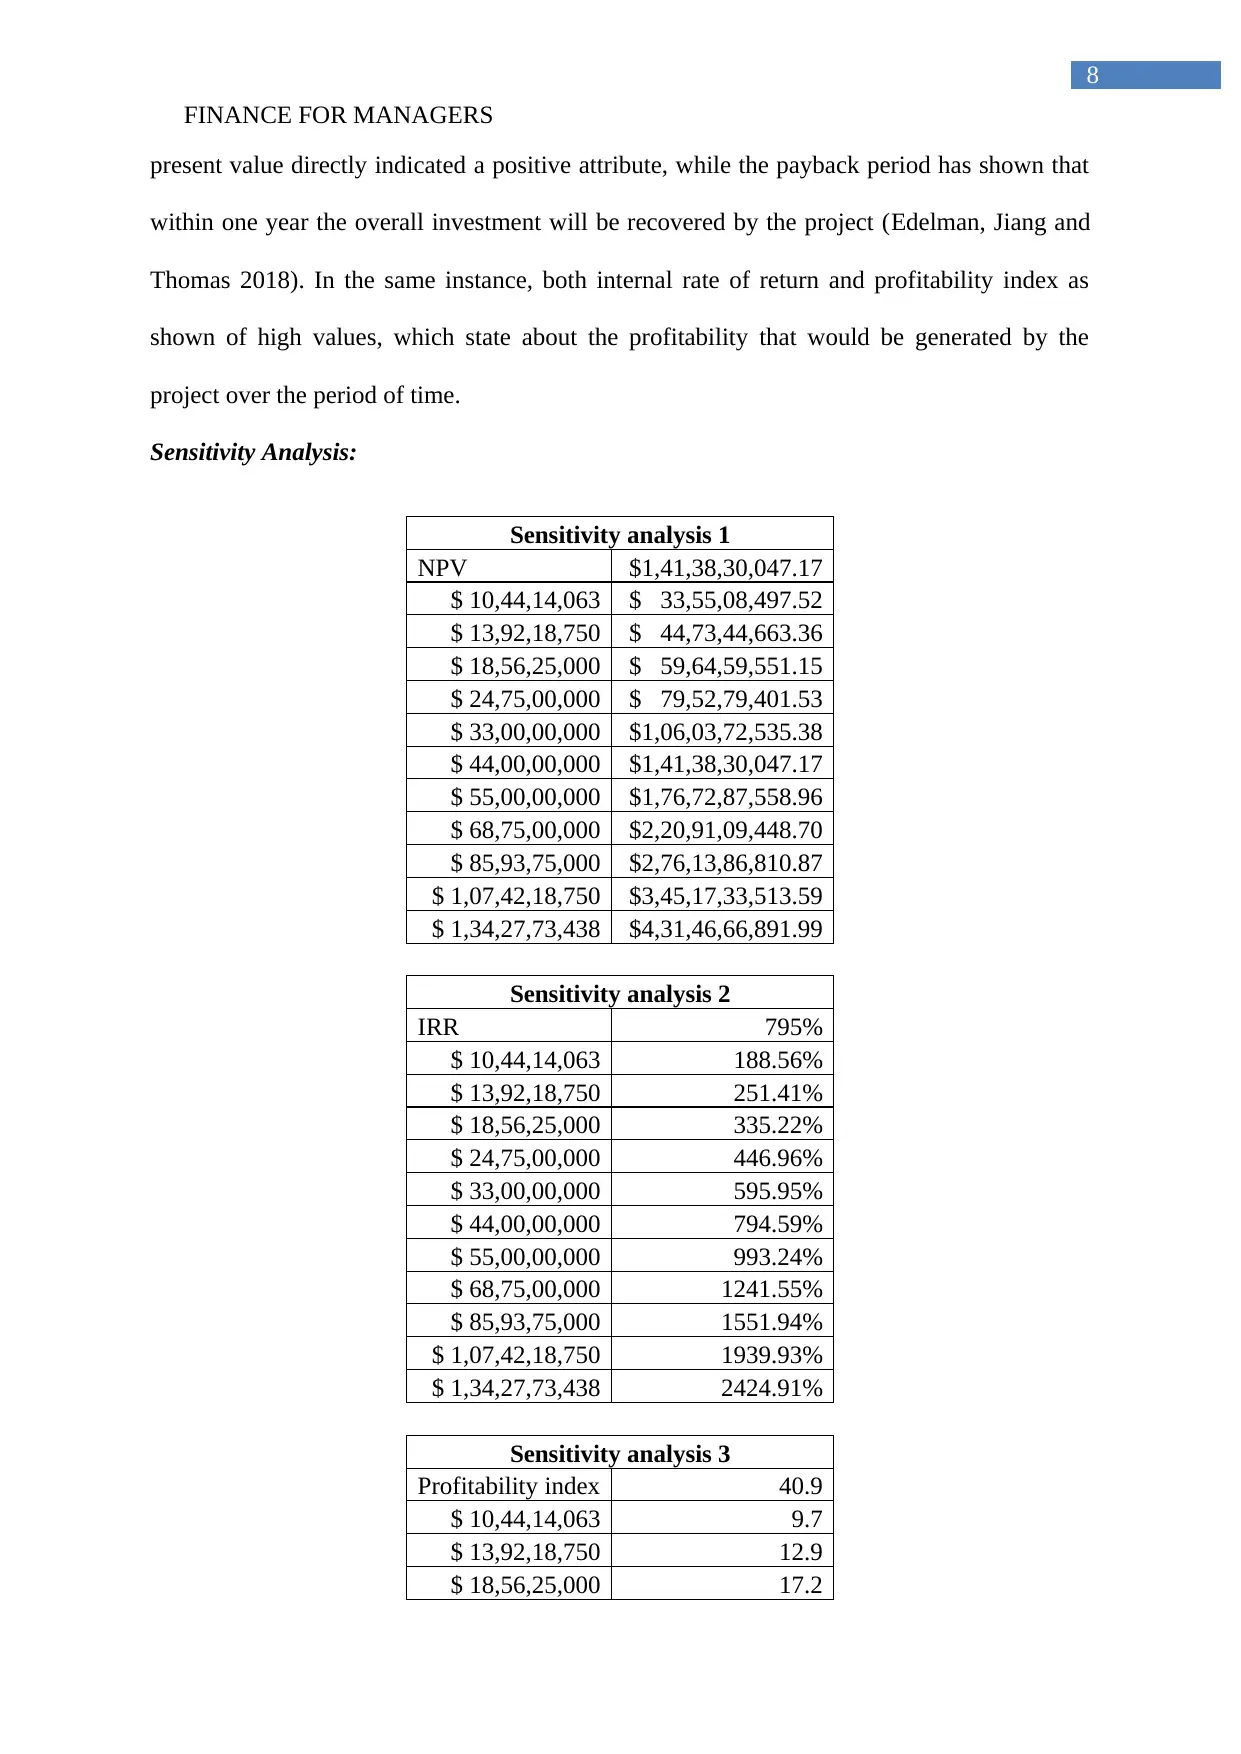
Sensitivity Analysis:
Sensitivity analysis 1
NPV $1,41,38,30,047.17
$ 10,44,14,063 $ 33,55,08,497.52
$ 13,92,18,750 $ 44,73,44,663.36
$ 18,56,25,000 $ 59,64,59,551.15
$ 24,75,00,000 $ 79,52,79,401.53
$ 33,00,00,000 $1,06,03,72,535.38
$ 44,00,00,000 $1,41,38,30,047.17
$ 55,00,00,000 $1,76,72,87,558.96
$ 68,75,00,000 $2,20,91,09,448.70
$ 85,93,75,000 $2,76,13,86,810.87
$ 1,07,42,18,750 $3,45,17,33,513.59
$ 1,34,27,73,438 $4,31,46,66,891.99
Sensitivity analysis 2
IRR 795%
$ 10,44,14,063 188.56%
$ 13,92,18,750 251.41%
$ 18,56,25,000 335.22%
$ 24,75,00,000 446.96%
$ 33,00,00,000 595.95%
$ 44,00,00,000 794.59%
$ 55,00,00,000 993.24%
$ 68,75,00,000 1241.55%
$ 85,93,75,000 1551.94%
$ 1,07,42,18,750 1939.93%
$ 1,34,27,73,438 2424.91%
Sensitivity analysis 3
Profitability index 40.9
$ 10,44,14,063 9.7
$ 13,92,18,750 12.9
$ 18,56,25,000 17.2
8
present value directly indicated a positive attribute, while the payback period has shown that
within one year the overall investment will be recovered by the project (Edelman, Jiang and
Thomas 2018). In the same instance, both internal rate of return and profitability index as
shown of high values, which state about the profitability that would be generated by the
project over the period of time.
Sensitivity Analysis:
Sensitivity analysis 1
NPV $1,41,38,30,047.17
$ 10,44,14,063 $ 33,55,08,497.52
$ 13,92,18,750 $ 44,73,44,663.36
$ 18,56,25,000 $ 59,64,59,551.15
$ 24,75,00,000 $ 79,52,79,401.53
$ 33,00,00,000 $1,06,03,72,535.38
$ 44,00,00,000 $1,41,38,30,047.17
$ 55,00,00,000 $1,76,72,87,558.96
$ 68,75,00,000 $2,20,91,09,448.70
$ 85,93,75,000 $2,76,13,86,810.87
$ 1,07,42,18,750 $3,45,17,33,513.59
$ 1,34,27,73,438 $4,31,46,66,891.99
Sensitivity analysis 2
IRR 795%
$ 10,44,14,063 188.56%
$ 13,92,18,750 251.41%
$ 18,56,25,000 335.22%
$ 24,75,00,000 446.96%
$ 33,00,00,000 595.95%
$ 44,00,00,000 794.59%
$ 55,00,00,000 993.24%
$ 68,75,00,000 1241.55%
$ 85,93,75,000 1551.94%
$ 1,07,42,18,750 1939.93%
$ 1,34,27,73,438 2424.91%
Sensitivity analysis 3
Profitability index 40.9
$ 10,44,14,063 9.7
$ 13,92,18,750 12.9
$ 18,56,25,000 17.2
FINANCE FOR MANAGERS
9
$ 24,75,00,000 23.0
$ 33,00,00,000 30.7
$ 44,00,00,000 40.9
$ 55,00,00,000 51.1
$ 68,75,00,000 63.9
$ 85,93,75,000 79.8
$ 1,07,42,18,750 99.8
$ 1,34,27,73,438 124.8
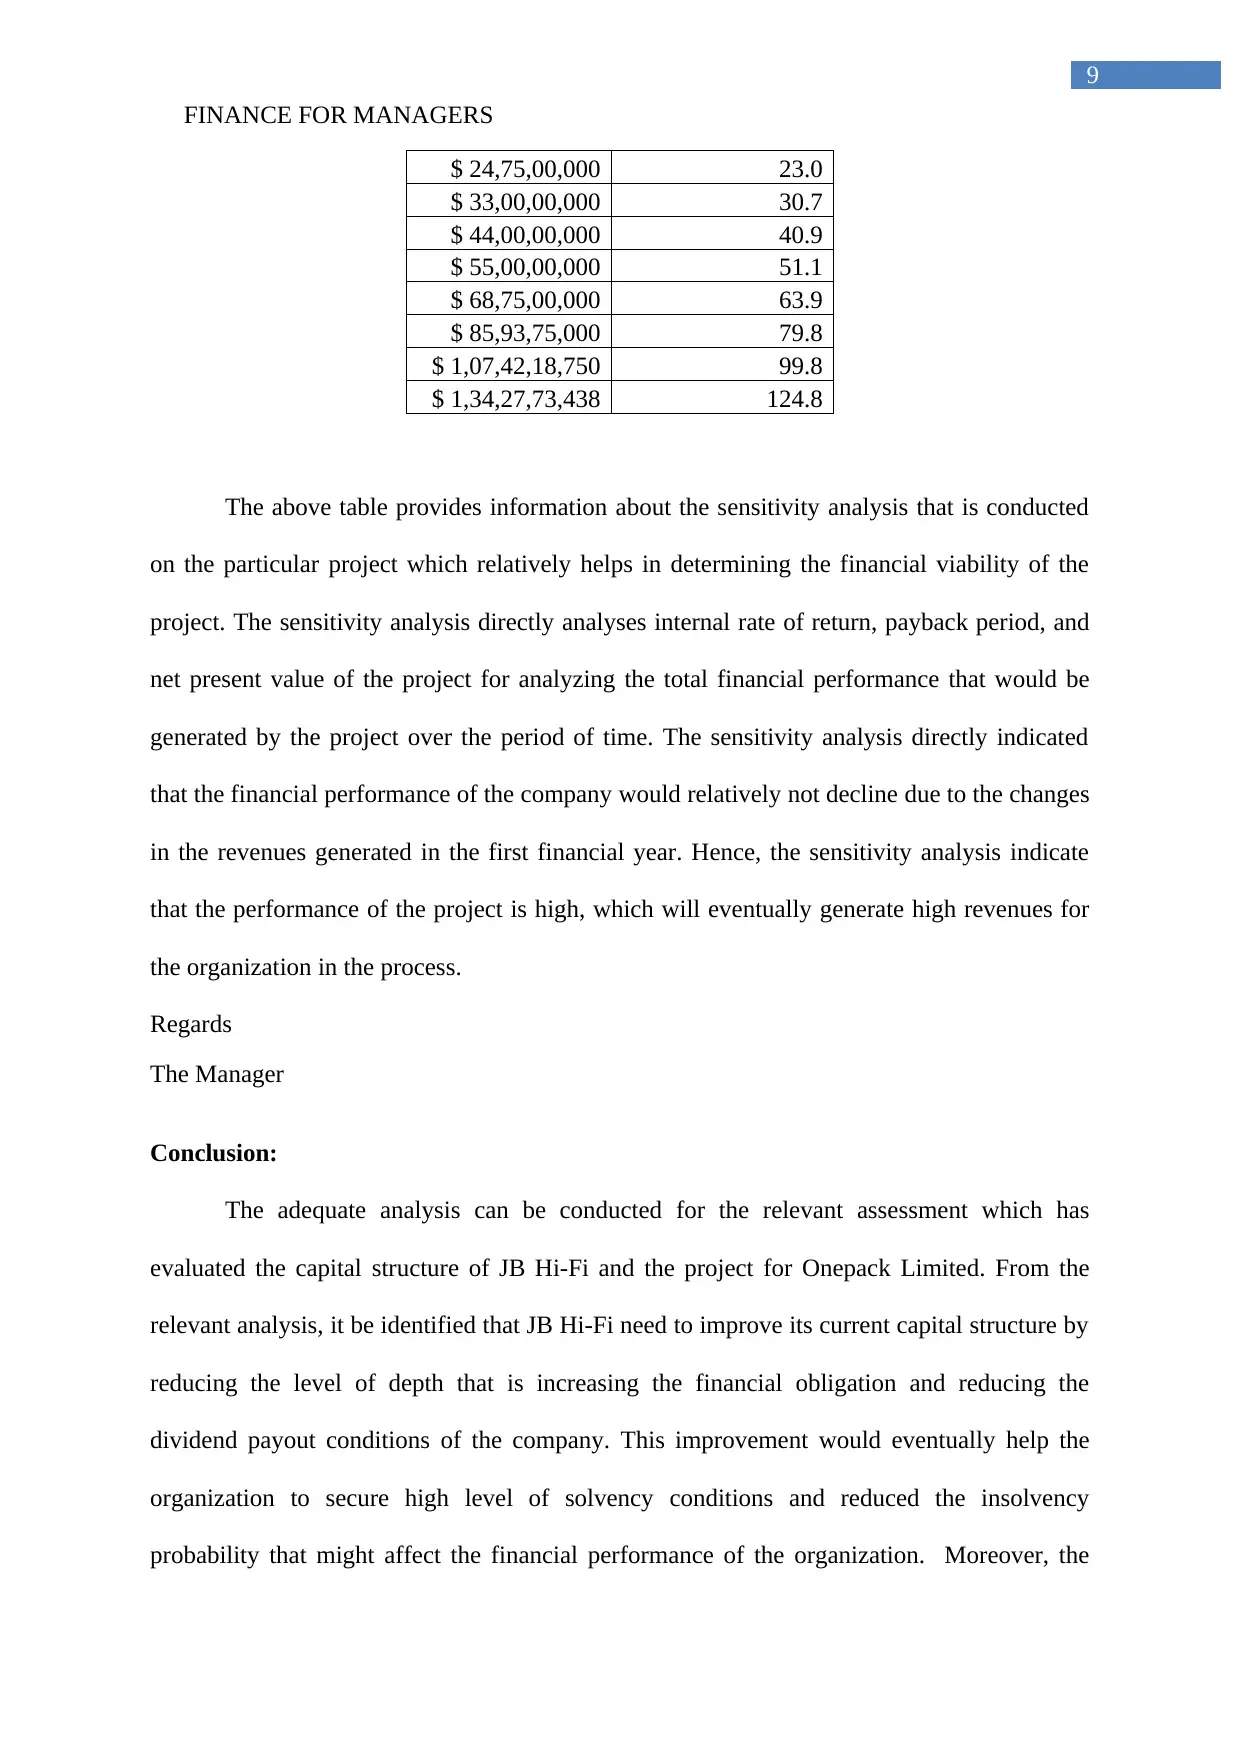
The above table provides information about the sensitivity analysis that is conducted
on the particular project which relatively helps in determining the financial viability of the
project. The sensitivity analysis directly analyses internal rate of return, payback period, and
net present value of the project for analyzing the total financial performance that would be
generated by the project over the period of time. The sensitivity analysis directly indicated
that the financial performance of the company would relatively not decline due to the changes
in the revenues generated in the first financial year. Hence, the sensitivity analysis indicate
that the performance of the project is high, which will eventually generate high revenues for
the organization in the process.
Regards
The Manager
Conclusion:
The adequate analysis can be conducted for the relevant assessment which has
evaluated the capital structure of JB Hi-Fi and the project for Onepack Limited. From the
relevant analysis, it be identified that JB Hi-Fi need to improve its current capital structure by
reducing the level of depth that is increasing the financial obligation and reducing the
dividend payout conditions of the company. This improvement would eventually help the
organization to secure high level of solvency conditions and reduced the insolvency
probability that might affect the financial performance of the organization. Moreover, the
9
$ 24,75,00,000 23.0
$ 33,00,00,000 30.7
$ 44,00,00,000 40.9
$ 55,00,00,000 51.1
$ 68,75,00,000 63.9
$ 85,93,75,000 79.8
$ 1,07,42,18,750 99.8
$ 1,34,27,73,438 124.8
The above table provides information about the sensitivity analysis that is conducted
on the particular project which relatively helps in determining the financial viability of the
project. The sensitivity analysis directly analyses internal rate of return, payback period, and
net present value of the project for analyzing the total financial performance that would be
generated by the project over the period of time. The sensitivity analysis directly indicated
that the financial performance of the company would relatively not decline due to the changes
in the revenues generated in the first financial year. Hence, the sensitivity analysis indicate
that the performance of the project is high, which will eventually generate high revenues for
the organization in the process.
Regards
The Manager
Conclusion:
The adequate analysis can be conducted for the relevant assessment which has
evaluated the capital structure of JB Hi-Fi and the project for Onepack Limited. From the
relevant analysis, it be identified that JB Hi-Fi need to improve its current capital structure by
reducing the level of depth that is increasing the financial obligation and reducing the
dividend payout conditions of the company. This improvement would eventually help the
organization to secure high level of solvency conditions and reduced the insolvency
probability that might affect the financial performance of the organization. Moreover, the
Secure Best Marks with AI Grader
Need help grading? Try our AI Grader for instant feedback on your assignments.

FINANCE FOR MANAGERS
10
project that has been analyzed for one pack Limited is relatively providing higher level of
revenues and incomes when analyzed with the investment appraisal technique. This directly
indicates that the management of the organization needs to commence with the project and
initiate it quickly to generate high level of Returns in the long run.

FINANCE FOR MANAGERS
11
References and Bibliography:
Arjaliès, D.L., Grant, P., Hardie, I., MacKenzie, D. and Svetlova, E., 2017. Chains of
finance: How investment management is shaped. Oxford University Press.
Baker, H.K. and Jabbouri, I., 2016. How Moroccan managers view dividend
policy. Managerial Finance, 42(3), pp.270-288.
Christofi, A.C., Harris, P., Kallianotis, I.N., Malindretos, J. and Scoullis, M., 2016. Stock
Picking Techniques: The Practice Of Applied Money Managers. Journal of Business &
Economics Research (Online), 14(1), p.1.
Edelman, P.H., Jiang, W. and Thomas, R.S., 2018. Will Tenure Voting Give Corporate
Managers Lifetime Tenure?. Vanderbilt Law Research Paper, (18-04).
Feldman, M.A., 2017. The Essentials of Finance and Accounting for Nonfinancial
Managers. Quality Progress, 50(1), p.60.
Fields, E., 2016. The essentials of finance and accounting for nonfinancial managers.
Amacom.
France, R., 2016. Finance for Purchasing Managers: Understanding the Financial Impact of
Buying Decisions. Routledge.
Gait, A.H. and Worthington, A.C., 2018. Attitudes of Libyan Banks towards Islamic Methods
of Finance. Current Politics and Economics of Africa, 11(2/3), pp.185-202.
Investors.jbhifi.com.au. 2019. Annual Reports | JB Hi-Fi Solutions. [online] Available at:
https://investors.jbhifi.com.au/annual-reports/ [Accessed 10 Jun. 2019].
FINANCE FOR MANAGERS
12
Larocque, S., Lawrence, A. and Veenstra, K., 2018. Managers’ cost of equity capital
estimates: empirical evidence. Journal of Accounting, Auditing & Finance, 33(3), pp.382-
401.
Laxton, D.M., 2017. Does Reframing Organisations Theory Make a Contribution to Project
Managers in the IT\Finance Industry?. Journal of Research in Business, Economics and
Management, 8(6), pp.1588-1595.
Lin, K.H., 2016. The rise of finance and firm employment dynamics. Organization
Science, 27(4), pp.972-988.
Salas, O.A. and Campos, M.J.S., 2016. Finance and Accounting for Managers (Vol. 28).
Profit Editorial.
Scase, R. and Goffee, R., 2017. Reluctant Managers (Routledge Revivals): Their Work and
Lifestyles. Routledge.
Statman, M., 2018. Behavioral Finance Lessons for Asset Managers. The Journal of Portfolio
Management, 44(7), pp.135-147.
Visser, T. and van Scheers, L., 2018. Can family business managers manage family business
risks?. Management: journal of contemporary management issues, 23(1), pp.123-137.
1 out of 13
Related Documents


Your All-in-One AI-Powered Toolkit for Academic Success.
+13062052269
info@desklib.com
Available 24*7 on WhatsApp / Email
![[object Object]](/_next/static/media/star-bottom.7253800d.svg)
Unlock your academic potential
© 2024 | Zucol Services PVT LTD | All rights reserved.