finance
11 Pages3055 Words23 Views
Added on 2023-01-05
About This Document
need in 4 hours
finance
Added on 2023-01-05
ShareRelated Documents
Q1: (2.5 points): An upward sloping yield curve presents clear arbitrage
opportunities and mispricing of the bonds; one can exploit it by investing in high yield
long-term bonds, while borrowing at the lower short term interest rate.
a) True
b) False
Explain your answer:
True: Usually, yield curve tends upward; as period to maturity rises, so
does corresponding interest rate. Reasoning for this is since borrowing over longer
term usually bears a higher risk due to the higher probability of inflations or default
over longer term. As a result, borrowers (debt holders) normally expect a greater rate
of yield (higher rate interest) for long-term debt.
Q2: (2.5 points): The average annual inflation-adjusted return on gold is historically
only 1.1%, while being 7.4% for equities. The volatility of gold is also 50% higher
than that of stocks. Gold is dominated in both risk and return by stocks, and
therefore, should never be a part of an optimal portfolio.
a) True
b) False
Explain your answer:
False: For sense, this is relevant to note that 'optimal' corresponds to one best
alternative cantered on a variety of previous predictions. First, the probability is
measured utilizing backward-looking results. Second, covariance matrix or
investment ann-movements usually use backward-looking records as a reference
point. Third, projections of potential returns, which reflect a base case in portfolio
optimization process, are highly uncertain. Thus, here gold is more volatile and
having more risk but return is higher than Stock so gold should be part of optimum
portfolio.
Question 3:
In late December 2020, Steven Wiese, the founder and CEO of Steven’s Bicycle
Corporation (SBC), had to make an important decision about how to manage the
international operations of his high-end bicycle business. Should he try to boost
international sales by signing an endorsement contract with cyclist Anna van der
Breggen?
Overseas sales were conducted through local distributors, with SBC receiving
licensing royalties from them. These international royalties incurred negligible SG&A
beyond what was required for UK operations.
With no change in operations (i.e. no signing of Anna van der Breggen), in its
baseline scenario SBC expected that domestic sales and international royalties
would grow at 5% per year until the end of 2026, after which they would grow at a
rate of 3% per year. In this baseline scenario, capital expenditures were expected to
grow at a steady rate of 3%. Depreciation on all capital expenditures (current and
past) was taken over five years on a straight-line basis, starting in the year after the
capital expenditure.
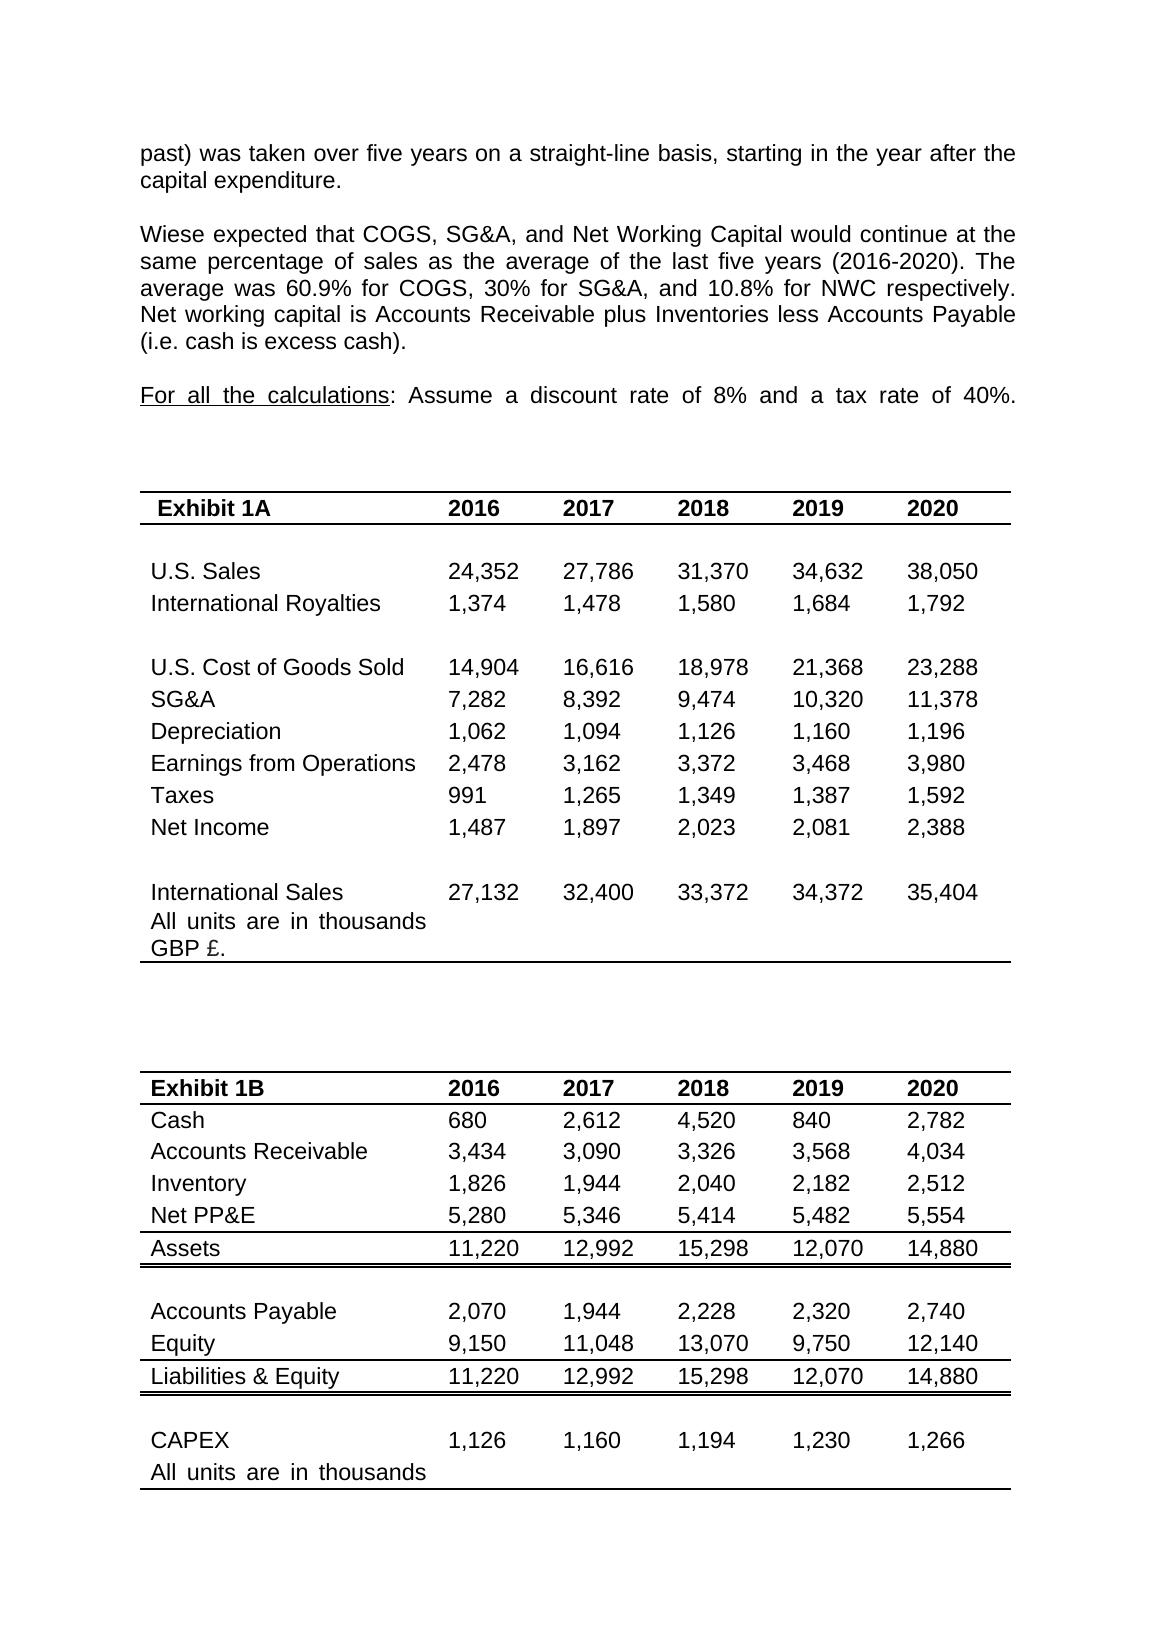
Wiese expected that COGS, SG&A, and Net Working Capital would continue at the
same percentage of sales as the average of the last five years (2016-2020). The
average was 60.9% for COGS, 30% for SG&A, and 10.8% for NWC respectively.
Net working capital is Accounts Receivable plus Inventories less Accounts Payable
(i.e. cash is excess cash).
For all the calculations: Assume a discount rate of 8% and a tax rate of 40%.
Exhibit 1A 2016 2017 2018 2019 2020
U.S. Sales 24,352 27,786 31,370 34,632 38,050
International Royalties 1,374 1,478 1,580 1,684 1,792
U.S. Cost of Goods Sold 14,904 16,616 18,978 21,368 23,288
SG&A 7,282 8,392 9,474 10,320 11,378
Depreciation 1,062 1,094 1,126 1,160 1,196
Earnings from Operations 2,478 3,162 3,372 3,468 3,980
Taxes 991 1,265 1,349 1,387 1,592
Net Income 1,487 1,897 2,023 2,081 2,388
International Sales 27,132 32,400 33,372 34,372 35,404
All units are in thousands
GBP £.
Exhibit 1B 2016 2017 2018 2019 2020
Cash 680 2,612 4,520 840 2,782
Accounts Receivable 3,434 3,090 3,326 3,568 4,034
Inventory 1,826 1,944 2,040 2,182 2,512
Net PP&E 5,280 5,346 5,414 5,482 5,554
Assets 11,220 12,992 15,298 12,070 14,880
Accounts Payable 2,070 1,944 2,228 2,320 2,740
Equity 9,150 11,048 13,070 9,750 12,140
Liabilities & Equity 11,220 12,992 15,298 12,070 14,880
CAPEX 1,126 1,160 1,194 1,230 1,266
All units are in thousands
capital expenditure.
Wiese expected that COGS, SG&A, and Net Working Capital would continue at the
same percentage of sales as the average of the last five years (2016-2020). The
average was 60.9% for COGS, 30% for SG&A, and 10.8% for NWC respectively.
Net working capital is Accounts Receivable plus Inventories less Accounts Payable
(i.e. cash is excess cash).
For all the calculations: Assume a discount rate of 8% and a tax rate of 40%.
Exhibit 1A 2016 2017 2018 2019 2020
U.S. Sales 24,352 27,786 31,370 34,632 38,050
International Royalties 1,374 1,478 1,580 1,684 1,792
U.S. Cost of Goods Sold 14,904 16,616 18,978 21,368 23,288
SG&A 7,282 8,392 9,474 10,320 11,378
Depreciation 1,062 1,094 1,126 1,160 1,196
Earnings from Operations 2,478 3,162 3,372 3,468 3,980
Taxes 991 1,265 1,349 1,387 1,592
Net Income 1,487 1,897 2,023 2,081 2,388
International Sales 27,132 32,400 33,372 34,372 35,404
All units are in thousands
GBP £.
Exhibit 1B 2016 2017 2018 2019 2020
Cash 680 2,612 4,520 840 2,782
Accounts Receivable 3,434 3,090 3,326 3,568 4,034
Inventory 1,826 1,944 2,040 2,182 2,512
Net PP&E 5,280 5,346 5,414 5,482 5,554
Assets 11,220 12,992 15,298 12,070 14,880
Accounts Payable 2,070 1,944 2,228 2,320 2,740
Equity 9,150 11,048 13,070 9,750 12,140
Liabilities & Equity 11,220 12,992 15,298 12,070 14,880
CAPEX 1,126 1,160 1,194 1,230 1,266
All units are in thousands
GBP £.
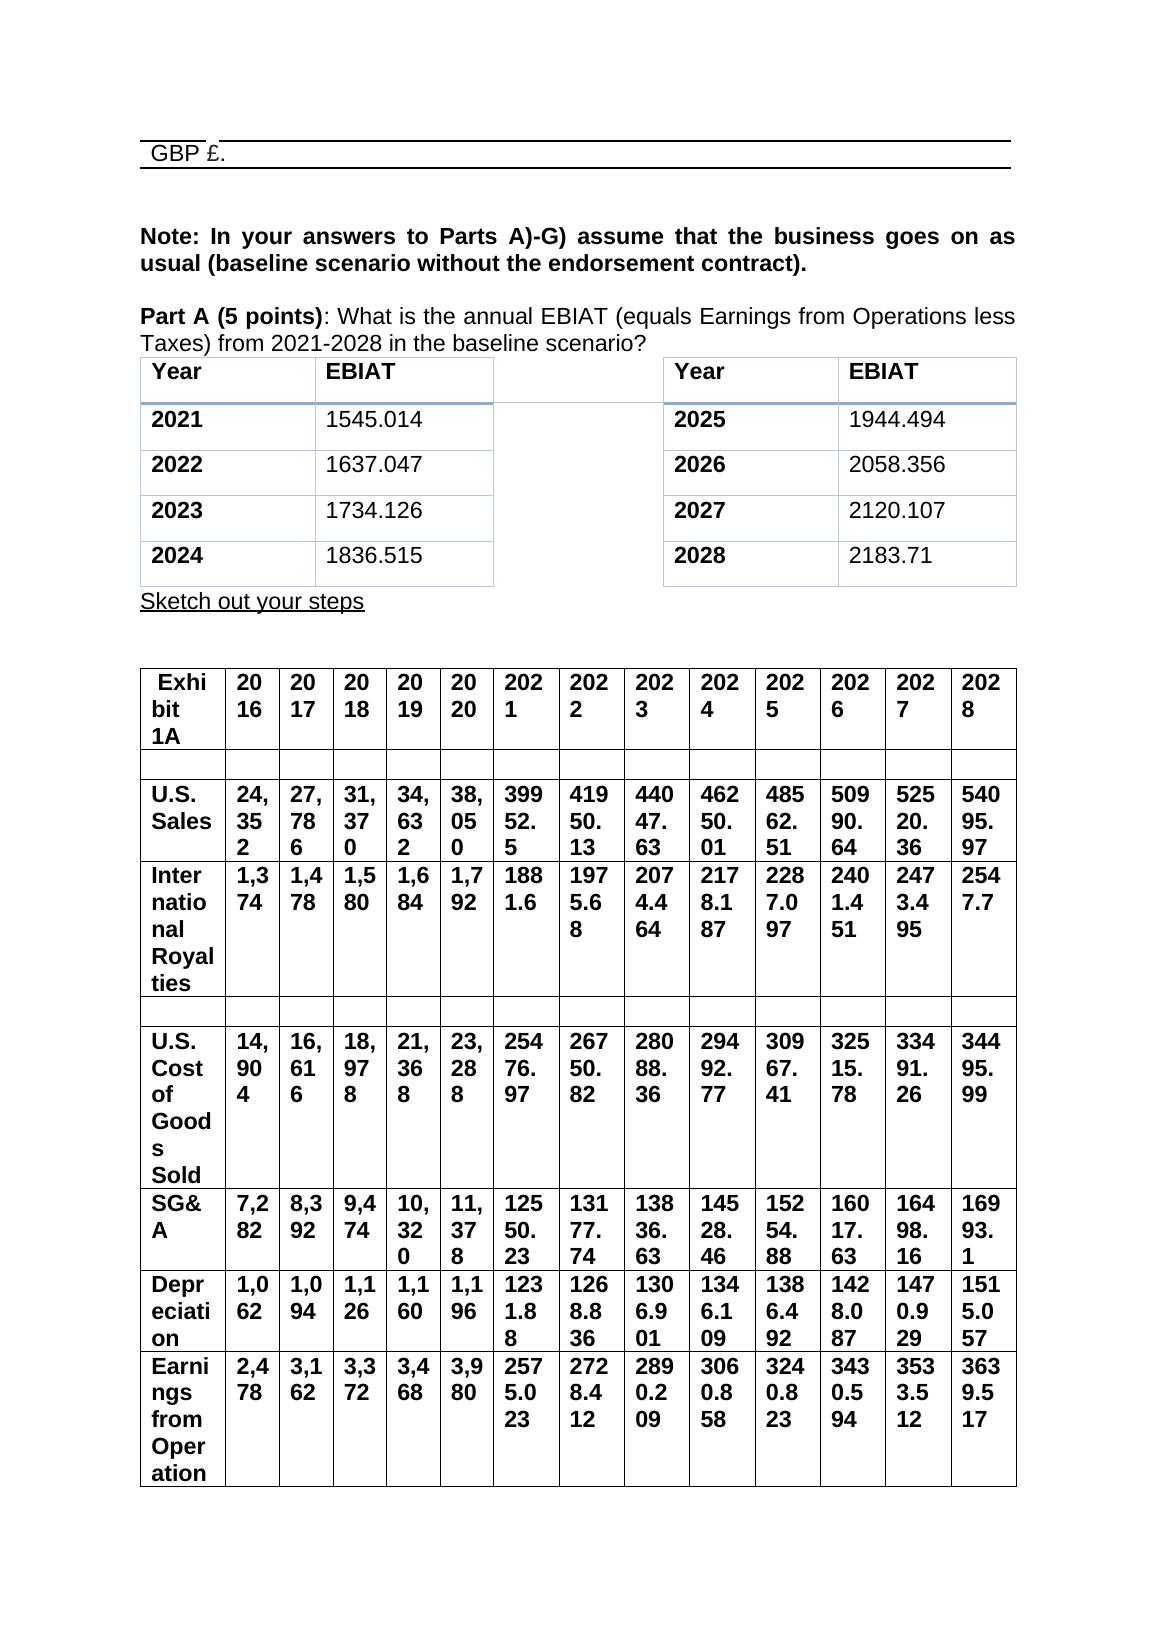
Note: In your answers to Parts A)-G) assume that the business goes on as
usual (baseline scenario without the endorsement contract).
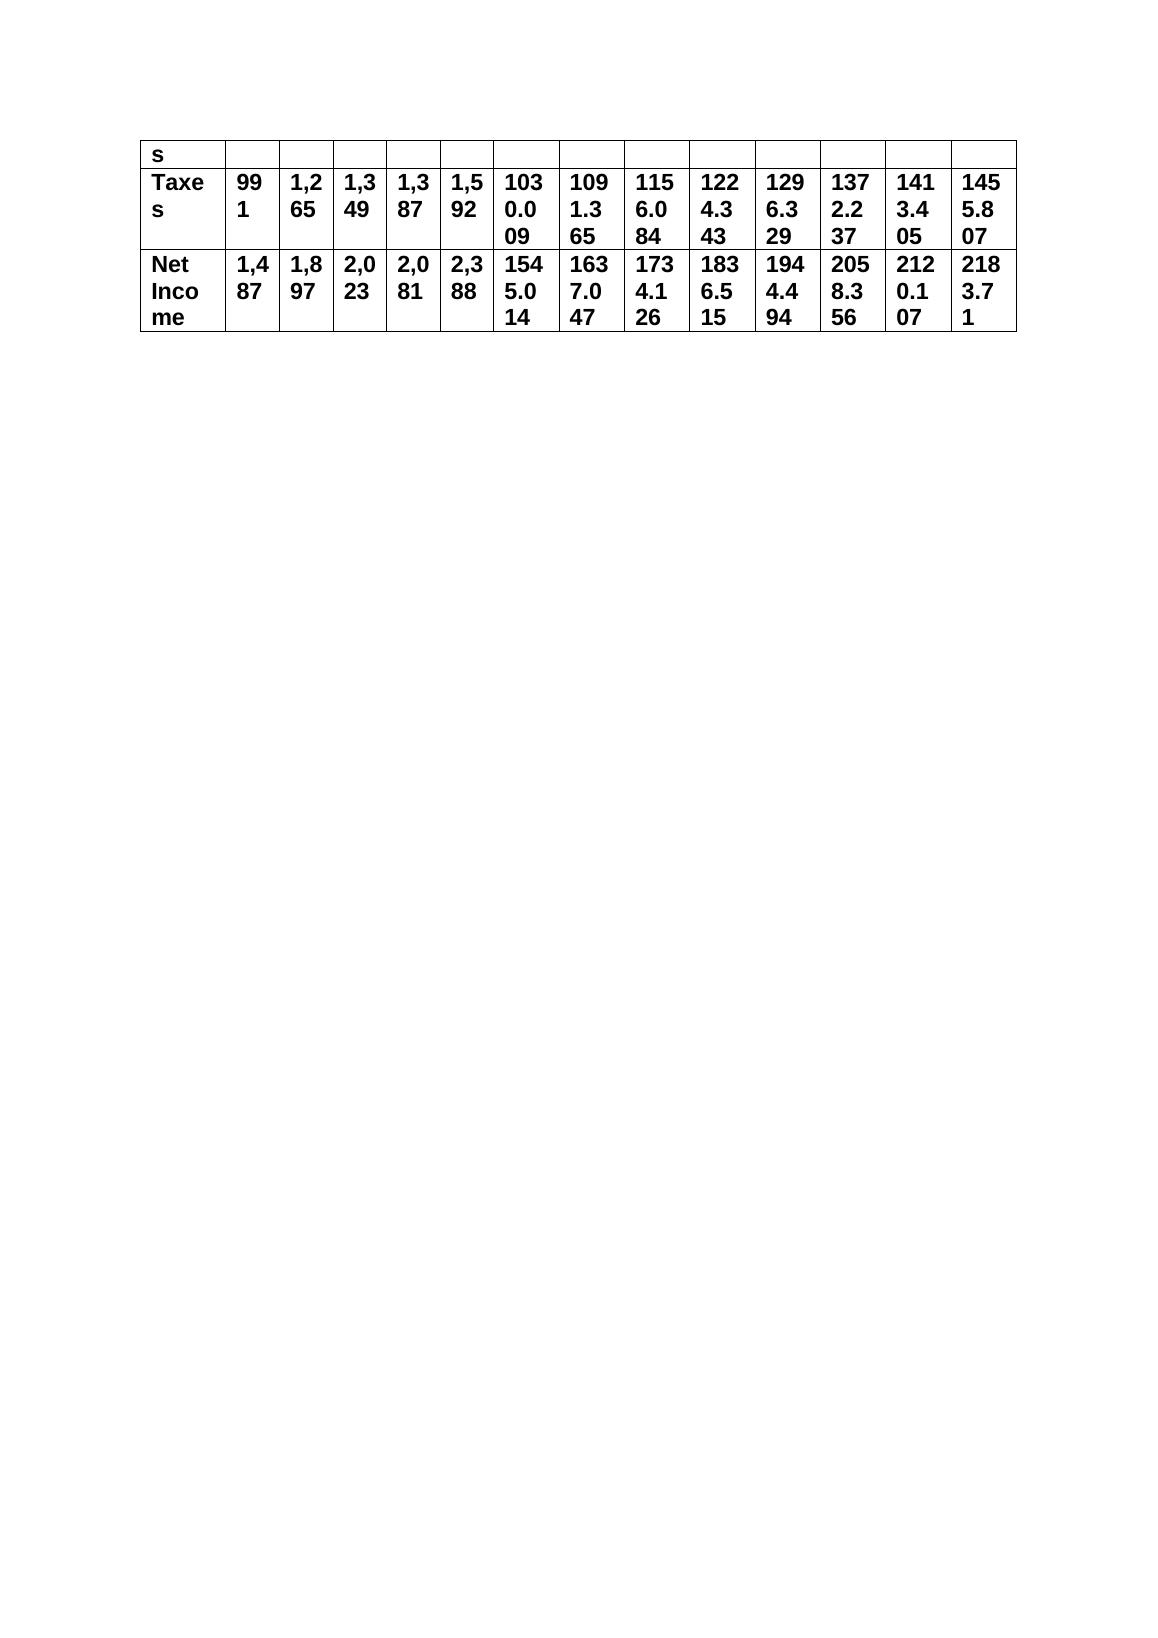
Part A (5 points): What is the annual EBIAT (equals Earnings from Operations less
Taxes) from 2021-2028 in the baseline scenario?
Year EBIAT Year EBIAT
2021 1545.014 2025 1944.494
2022 1637.047 2026 2058.356
2023 1734.126 2027 2120.107
2024 1836.515 2028 2183.71
Sketch out your steps
Exhi
bit
1A
20
16
20
17
20
18
20
19
20
20
202
1
202
2
202
3
202
4
202
5
202
6
202
7
202
8
U.S.
Sales
24,
35
2
27,
78
6
31,
37
0
34,
63
2
38,
05
0
399
52.
5
419
50.
13
440
47.
63
462
50.
01
485
62.
51
509
90.
64
525
20.
36
540
95.
97
Inter
natio
nal
Royal
ties
1,3
74
1,4
78
1,5
80
1,6
84
1,7
92
188
1.6
197
5.6
8
207
4.4
64
217
8.1
87
228
7.0
97
240
1.4
51
247
3.4
95
254
7.7
U.S.
Cost
of
Good
s
Sold
14,
90
4
16,
61
6
18,
97
8
21,
36
8
23,
28
8
254
76.
97
267
50.
82
280
88.
36
294
92.
77
309
67.
41
325
15.
78
334
91.
26
344
95.
99
SG&
A
7,2
82
8,3
92
9,4
74
10,
32
0
11,
37
8
125
50.
23
131
77.
74
138
36.
63
145
28.
46
152
54.
88
160
17.
63
164
98.
16
169
93.
1
Depr
eciati
on
1,0
62
1,0
94
1,1
26
1,1
60
1,1
96
123
1.8
8
126
8.8
36
130
6.9
01
134
6.1
09
138
6.4
92
142
8.0
87
147
0.9
29
151
5.0
57
Earni
ngs
from
Oper
ation
2,4
78
3,1
62
3,3
72
3,4
68
3,9
80
257
5.0
23
272
8.4
12
289
0.2
09
306
0.8
58
324
0.8
23
343
0.5
94
353
3.5
12
363
9.5
17
Note: In your answers to Parts A)-G) assume that the business goes on as
usual (baseline scenario without the endorsement contract).
Part A (5 points): What is the annual EBIAT (equals Earnings from Operations less
Taxes) from 2021-2028 in the baseline scenario?
Year EBIAT Year EBIAT
2021 1545.014 2025 1944.494
2022 1637.047 2026 2058.356
2023 1734.126 2027 2120.107
2024 1836.515 2028 2183.71
Sketch out your steps
Exhi
bit
1A
20
16
20
17
20
18
20
19
20
20
202
1
202
2
202
3
202
4
202
5
202
6
202
7
202
8
U.S.
Sales
24,
35
2
27,
78
6
31,
37
0
34,
63
2
38,
05
0
399
52.
5
419
50.
13
440
47.
63
462
50.
01
485
62.
51
509
90.
64
525
20.
36
540
95.
97
Inter
natio
nal
Royal
ties
1,3
74
1,4
78
1,5
80
1,6
84
1,7
92
188
1.6
197
5.6
8
207
4.4
64
217
8.1
87
228
7.0
97
240
1.4
51
247
3.4
95
254
7.7
U.S.
Cost
of
Good
s
Sold
14,
90
4
16,
61
6
18,
97
8
21,
36
8
23,
28
8
254
76.
97
267
50.
82
280
88.
36
294
92.
77
309
67.
41
325
15.
78
334
91.
26
344
95.
99
SG&
A
7,2
82
8,3
92
9,4
74
10,
32
0
11,
37
8
125
50.
23
131
77.
74
138
36.
63
145
28.
46
152
54.
88
160
17.
63
164
98.
16
169
93.
1
Depr
eciati
on
1,0
62
1,0
94
1,1
26
1,1
60
1,1
96
123
1.8
8
126
8.8
36
130
6.9
01
134
6.1
09
138
6.4
92
142
8.0
87
147
0.9
29
151
5.0
57
Earni
ngs
from
Oper
ation
2,4
78
3,1
62
3,3
72
3,4
68
3,9
80
257
5.0
23
272
8.4
12
289
0.2
09
306
0.8
58
324
0.8
23
343
0.5
94
353
3.5
12
363
9.5
17
s
Taxe
s
99
1
1,2
65
1,3
49
1,3
87
1,5
92
103
0.0
09
109
1.3
65
115
6.0
84
122
4.3
43
129
6.3
29
137
2.2
37
141
3.4
05
145
5.8
07
Net
Inco
me
1,4
87
1,8
97
2,0
23
2,0
81
2,3
88
154
5.0
14
163
7.0
47
173
4.1
26
183
6.5
15
194
4.4
94
205
8.3
56
212
0.1
07
218
3.7
1
Taxe
s
99
1
1,2
65
1,3
49
1,3
87
1,5
92
103
0.0
09
109
1.3
65
115
6.0
84
122
4.3
43
129
6.3
29
137
2.2
37
141
3.4
05
145
5.8
07
Net
Inco
me
1,4
87
1,8
97
2,0
23
2,0
81
2,3
88
154
5.0
14
163
7.0
47
173
4.1
26
183
6.5
15
194
4.4
94
205
8.3
56
212
0.1
07
218
3.7
1
End of preview
Want to access all the pages? Upload your documents or become a member.