Financial Analysis of BAE Systems and Airbus SE
Added on 2023-01-18
15 Pages2377 Words89 Views
Finance

Table of Contents
TASK...............................................................................................................................................3
Financial Analysis:......................................................................................................................3
Company valuation:....................................................................................................................6
Capital structure:.......................................................................................................................10
CONCLUSION..............................................................................................................................12
REFERENCES..............................................................................................................................13
INTRODUCTION
The term finance is a key aspect for business entities in order to complete different kinds
of activities. In order to analyse need of finance, there are different types of methods and
techniques. Companies produce various number of financial statements to assess their financial
needs (McLean and Zhao, 2014). This study provides financial analysis of corporation BAE
Systems (UK's Aerospace company) along with comparison of performance with competitor
named Airbus SE. Both companies are operating in same industry, BAE is UK's company while
Airbus SE is European international aerospace and defence corporation.
Study also contains practical sum of valuation of respective company and some
numerical task related to capital structure. Moreover, study provides explanation about key
limitation of usage of ratio analysis.
TASK
Financial Analysis:
Financial analysis mainly relates to effective application of financial and numerical
information for assessing corporation's performance in all aspects and provide meaningful
recommendations in relation to ways by which company can improvise existing performance.
Ratio analysis is one of the most useful tool for financial analysis which is purely formula based
(De Mooij, 2012.). This help to make comparison of financial and operating performance of
company with industry standards and competitors. Following is ratio analysis of Company BAE
Systems along with its competitor Airbus SE, as follows:
Profitability Criteria: Ratio analysis exhibits corporation's performance in terms of capacity
and efficiency of company to generate profits. It mainly includes net profit ratio and gross profit
ratio, which are analysed below in respect of respective company and its competitor:
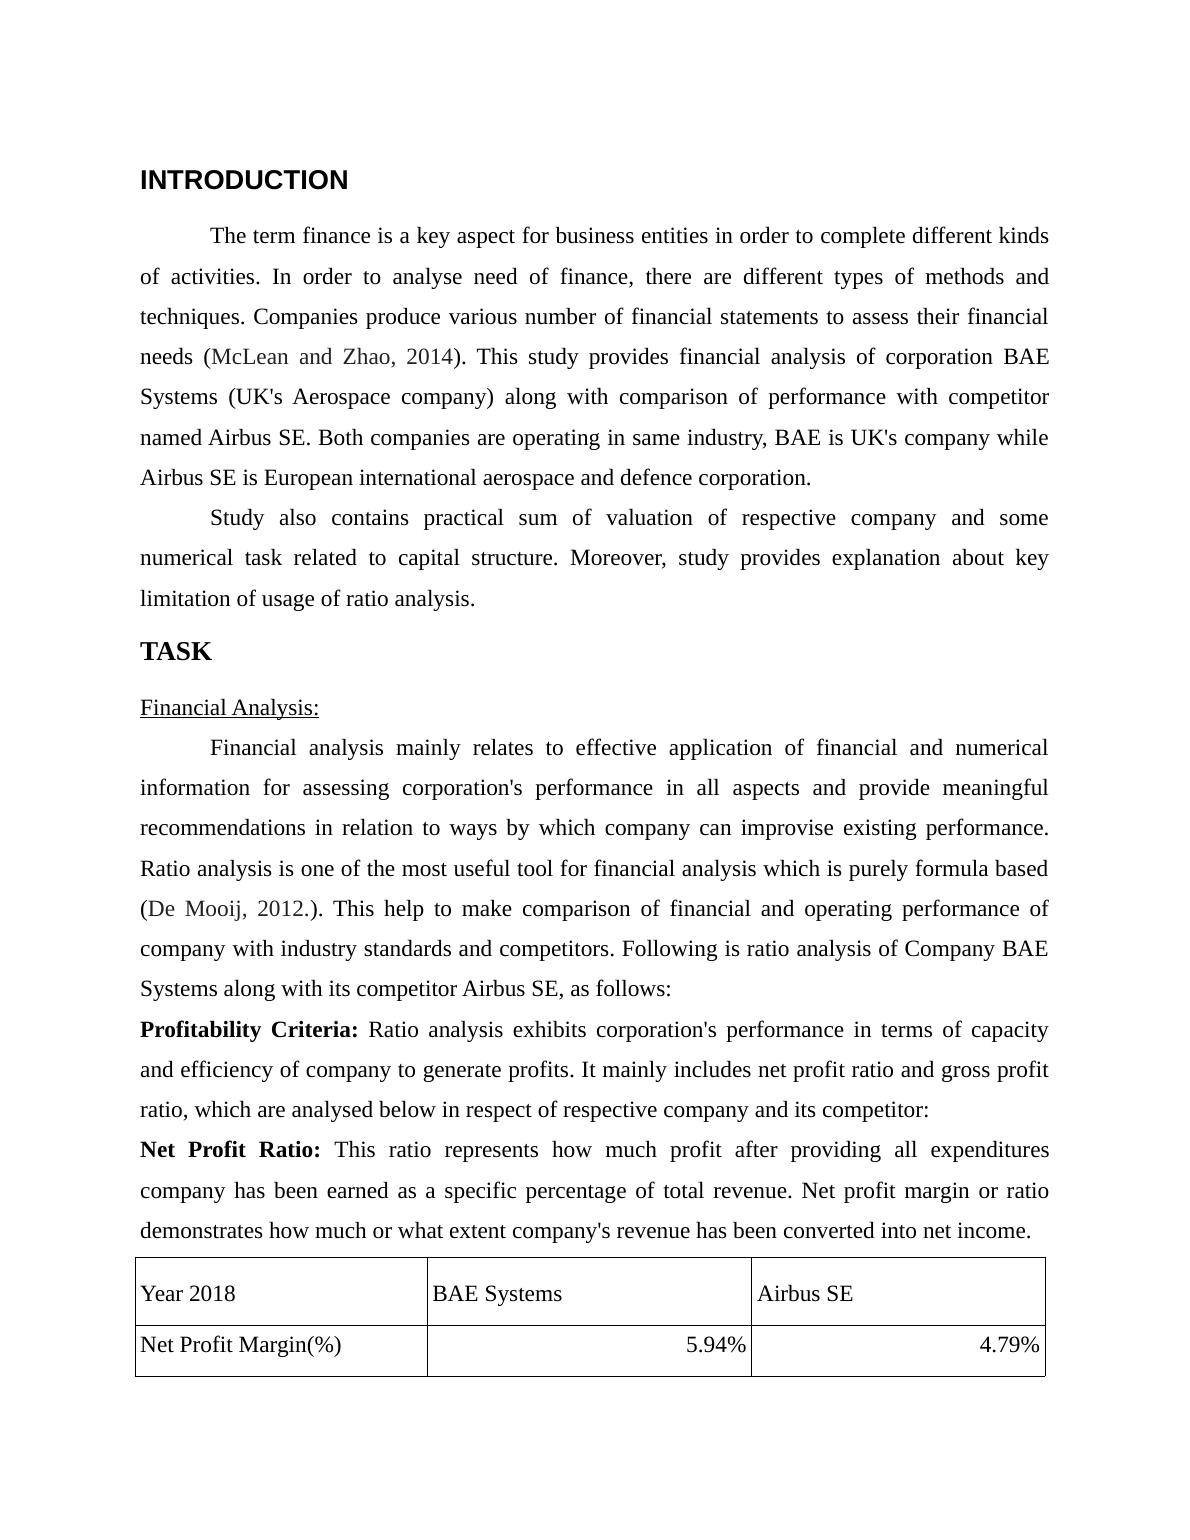
Net Profit Ratio: This ratio represents how much profit after providing all expenditures
company has been earned as a specific percentage of total revenue. Net profit margin or ratio
demonstrates how much or what extent company's revenue has been converted into net income.
Year 2018 BAE Systems Airbus SE
Net Profit Margin(%) 5.94% 4.79%
The term finance is a key aspect for business entities in order to complete different kinds
of activities. In order to analyse need of finance, there are different types of methods and
techniques. Companies produce various number of financial statements to assess their financial
needs (McLean and Zhao, 2014). This study provides financial analysis of corporation BAE
Systems (UK's Aerospace company) along with comparison of performance with competitor
named Airbus SE. Both companies are operating in same industry, BAE is UK's company while
Airbus SE is European international aerospace and defence corporation.
Study also contains practical sum of valuation of respective company and some
numerical task related to capital structure. Moreover, study provides explanation about key
limitation of usage of ratio analysis.
TASK
Financial Analysis:
Financial analysis mainly relates to effective application of financial and numerical
information for assessing corporation's performance in all aspects and provide meaningful
recommendations in relation to ways by which company can improvise existing performance.
Ratio analysis is one of the most useful tool for financial analysis which is purely formula based
(De Mooij, 2012.). This help to make comparison of financial and operating performance of
company with industry standards and competitors. Following is ratio analysis of Company BAE
Systems along with its competitor Airbus SE, as follows:
Profitability Criteria: Ratio analysis exhibits corporation's performance in terms of capacity
and efficiency of company to generate profits. It mainly includes net profit ratio and gross profit
ratio, which are analysed below in respect of respective company and its competitor:
Net Profit Ratio: This ratio represents how much profit after providing all expenditures
company has been earned as a specific percentage of total revenue. Net profit margin or ratio
demonstrates how much or what extent company's revenue has been converted into net income.
Year 2018 BAE Systems Airbus SE
Net Profit Margin(%) 5.94% 4.79%
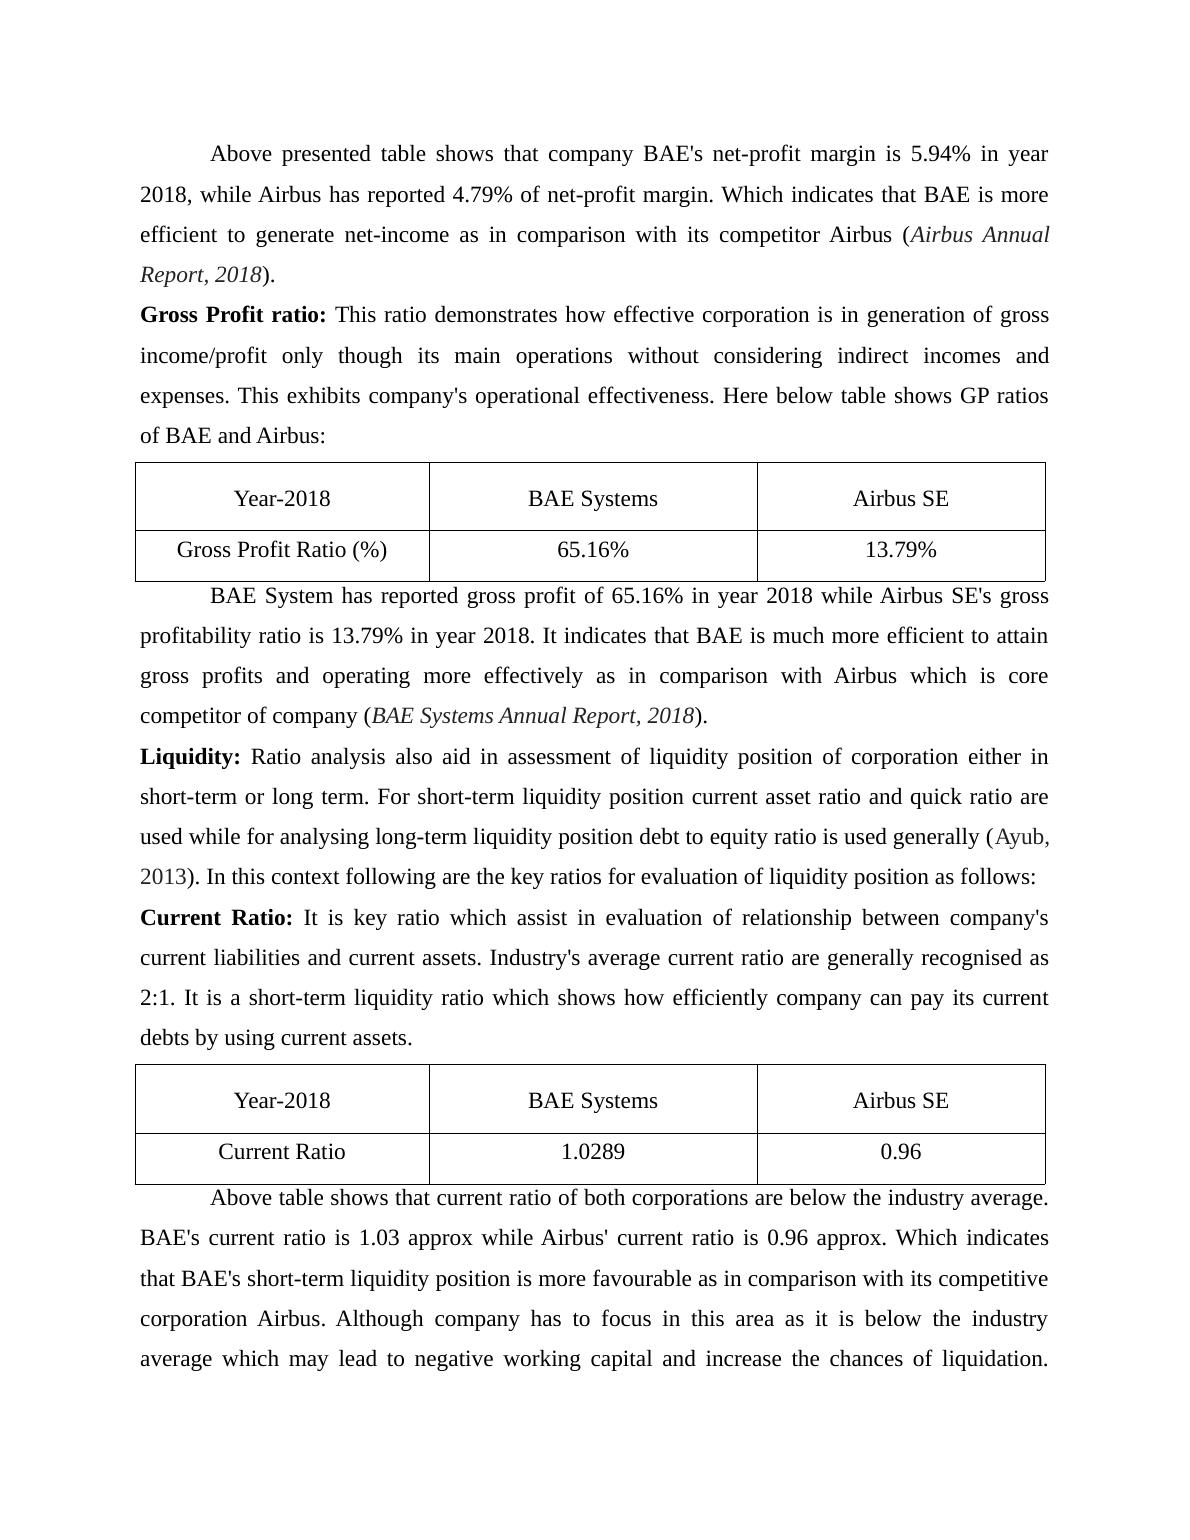
Above presented table shows that company BAE's net-profit margin is 5.94% in year
2018, while Airbus has reported 4.79% of net-profit margin. Which indicates that BAE is more
efficient to generate net-income as in comparison with its competitor Airbus (Airbus Annual
Report, 2018).
Gross Profit ratio: This ratio demonstrates how effective corporation is in generation of gross
income/profit only though its main operations without considering indirect incomes and
expenses. This exhibits company's operational effectiveness. Here below table shows GP ratios
of BAE and Airbus:
Year-2018 BAE Systems Airbus SE
Gross Profit Ratio (%) 65.16% 13.79%
BAE System has reported gross profit of 65.16% in year 2018 while Airbus SE's gross
profitability ratio is 13.79% in year 2018. It indicates that BAE is much more efficient to attain
gross profits and operating more effectively as in comparison with Airbus which is core
competitor of company (BAE Systems Annual Report, 2018).
Liquidity: Ratio analysis also aid in assessment of liquidity position of corporation either in
short-term or long term. For short-term liquidity position current asset ratio and quick ratio are
used while for analysing long-term liquidity position debt to equity ratio is used generally (Ayub,
2013). In this context following are the key ratios for evaluation of liquidity position as follows:
Current Ratio: It is key ratio which assist in evaluation of relationship between company's
current liabilities and current assets. Industry's average current ratio are generally recognised as
2:1. It is a short-term liquidity ratio which shows how efficiently company can pay its current
debts by using current assets.
Year-2018 BAE Systems Airbus SE
Current Ratio 1.0289 0.96
Above table shows that current ratio of both corporations are below the industry average.
BAE's current ratio is 1.03 approx while Airbus' current ratio is 0.96 approx. Which indicates
that BAE's short-term liquidity position is more favourable as in comparison with its competitive
corporation Airbus. Although company has to focus in this area as it is below the industry
average which may lead to negative working capital and increase the chances of liquidation.
End of preview
Want to access all the pages? Upload your documents or become a member.
Related Documents
Financial Analysis, Valuation, and Capital Structure of BAE Systems Plclg...
|14
|2550
|22
Financial Analysis, Company Valuation, Capital Structurelg...
|14
|2430
|52
Report on Financial Analysis and Compariison with Competitorlg...
|22
|3288
|46
Financial Analysis and Company Valuation of BAE Systemslg...
|13
|3119
|57
Financial Management: Valuation and Capital Structurelg...
|11
|2354
|55
Financial Decision Making Assessment 2022lg...
|16
|1980
|13