Report on Financial Performance, Investment Appraisal, and Acquisition
VerifiedAdded on 2023/01/11
|15
|4015
|30
Report
AI Summary
This report analyzes the financial performance of Burberry Group Plc from 2015 to 2019, evaluating its profitability and liquidity through ratio analysis. It examines future investment opportunities using Net Present Value (NPV) and Internal Rate of Return (IRR) techniques, providing investment appraisal results. The report also explores the potential acquisition of a Leather Goods factory, considering its rationale, synergistic gains, financing, risks, and implications. The analysis reveals Burberry's strong financial position and growth, supporting its investment plans and acquisition strategy, while also highlighting the limitations of ratio analysis and the importance of efficient resource management.

Finance of decision making
Paraphrase This Document
Need a fresh take? Get an instant paraphrase of this document with our AI Paraphraser
TABLE OF CONTENTS
TABLE OF CONTENTS................................................................................................................2
1. INTRODUCTION.......................................................................................................................1
1.1 Rationale................................................................................................................................1
1.2 Background of the company..................................................................................................1
1.3 Main Findings........................................................................................................................1
1.4 Structure of the report............................................................................................................1
2. Evaluation of the current financial performance of the company. (2015 -2019)........................1
2.1 Profitability............................................................................................................................2
2.2 Liquidity................................................................................................................................4
2.3 Evaluation of ratio analysis...................................................................................................6
2.4 Limitation of the ratio analysis..............................................................................................6
3 Future investment appraisals........................................................................................................7
3.1 Evaluation of NPV techniques...............................................................................................7
3.2 Evaluation of IRR techniques................................................................................................7
3.3 Investment appraisal results...................................................................................................8
3.4 Potential implication of investment.....................................................................................10
4. Potential acquisition of Leather Goods factory.........................................................................10
4.1 Rationale for choosing the target company.........................................................................10
4.2 Synergistic gain on acquisition............................................................................................11
4.3 Evaluation of the financing of acquisition...........................................................................12
4.4 Risks and uncertainties........................................................................................................12
4.5 Potential implication over the performance of the firm.......................................................12
CONCLUSION..............................................................................................................................12
REFERENCES..............................................................................................................................13
1. INTRODUCTION
1.1 Rationale
Burberry group plc is big luxury brand fashion company that is headquartered in
England, London. Company is doing well in the market from last many years. The company is
planning to expand its business by the investments or acquisition. This will help the company to
increase its growth by the acquisition. Report has summarised the current financial position and
performance of the company for the last five year’s data.
1.2 Background of the company
Burberry Group Plc is the fashion house which focusses on distributing ready to wear
clothes and outer wear. It also provides fashion accessories, beauty care products and sunglasses.
The company has been using varied technology for providing ever lasting customer experience.
Currently, it is suing AR tool which allows customers to experience company’s product in tehri
surrounding. Its total revenue in 2019 was £2,720m, along with net cash of £837m. in the year
2017, it has set a strategy to establish as the luxury fashion firm and delivering long-term
sustainable value to its shareholders.
1.3 Main Findings
Burberry Plc is doing the good and is growth at high rate over the last 5 years. By looking at its
revenue, it can eb said that the company is having enough amount for carrying out its further
investment plan and also acquiring another company while maintaining the performance of the
business.
1.4 Structure of the report
Section 2 analysis the financial performance of Burberry Plc.
Section 3 covers the evaluation of the NPV and IRR techniques of investment in relation to
investment.
Section 4 provides a description about the potential acquisition of Leather Goods factory.
Section 5 covers the overall conclusion of the report.
2. Evaluation of the current financial performance of the company. (2015 -
2019)
2019 2018 2017 2016 2015
1
⊘ This is a preview!⊘
Do you want full access?
Subscribe today to unlock all pages.
Trusted by 1+ million students worldwide
Employed
Capital
(Total Assets -
Current
Liabilities) 1692100 1670100 1848300 1775300 n/a
Net profit 339300 293500 286800 309500 n/a
Return on
capital
employed
Net operating
profit/Employed
Capital 20.05% 17.57% 15.52% 17.43% n/a
n/a
Net Income 339300 293500 286800 309500 n/a
Shareholder's
Equity 1455000 1420500 1692500 1565000 n/a
Return on
Equity
Net Income /
Shareholder's
Equity 23.32% 20.66% 16.95% 19.78% n/a
2019 2018 2017 2016 2015
Cost of Sales 859400 835400 832900 752000 757700
Sales 2720200 2732800 2766000 2514700 2523200
Gross Margin 68.41% 69.43% 69.89% 70.10% 69.97%
Net profit 339300 293500 286800 309500 336300
Sales 2720200 2732800 2766000 2514700 2523200
Net profit
ratio 12.47% 10.74% 10.37% 12.31% 13.33%
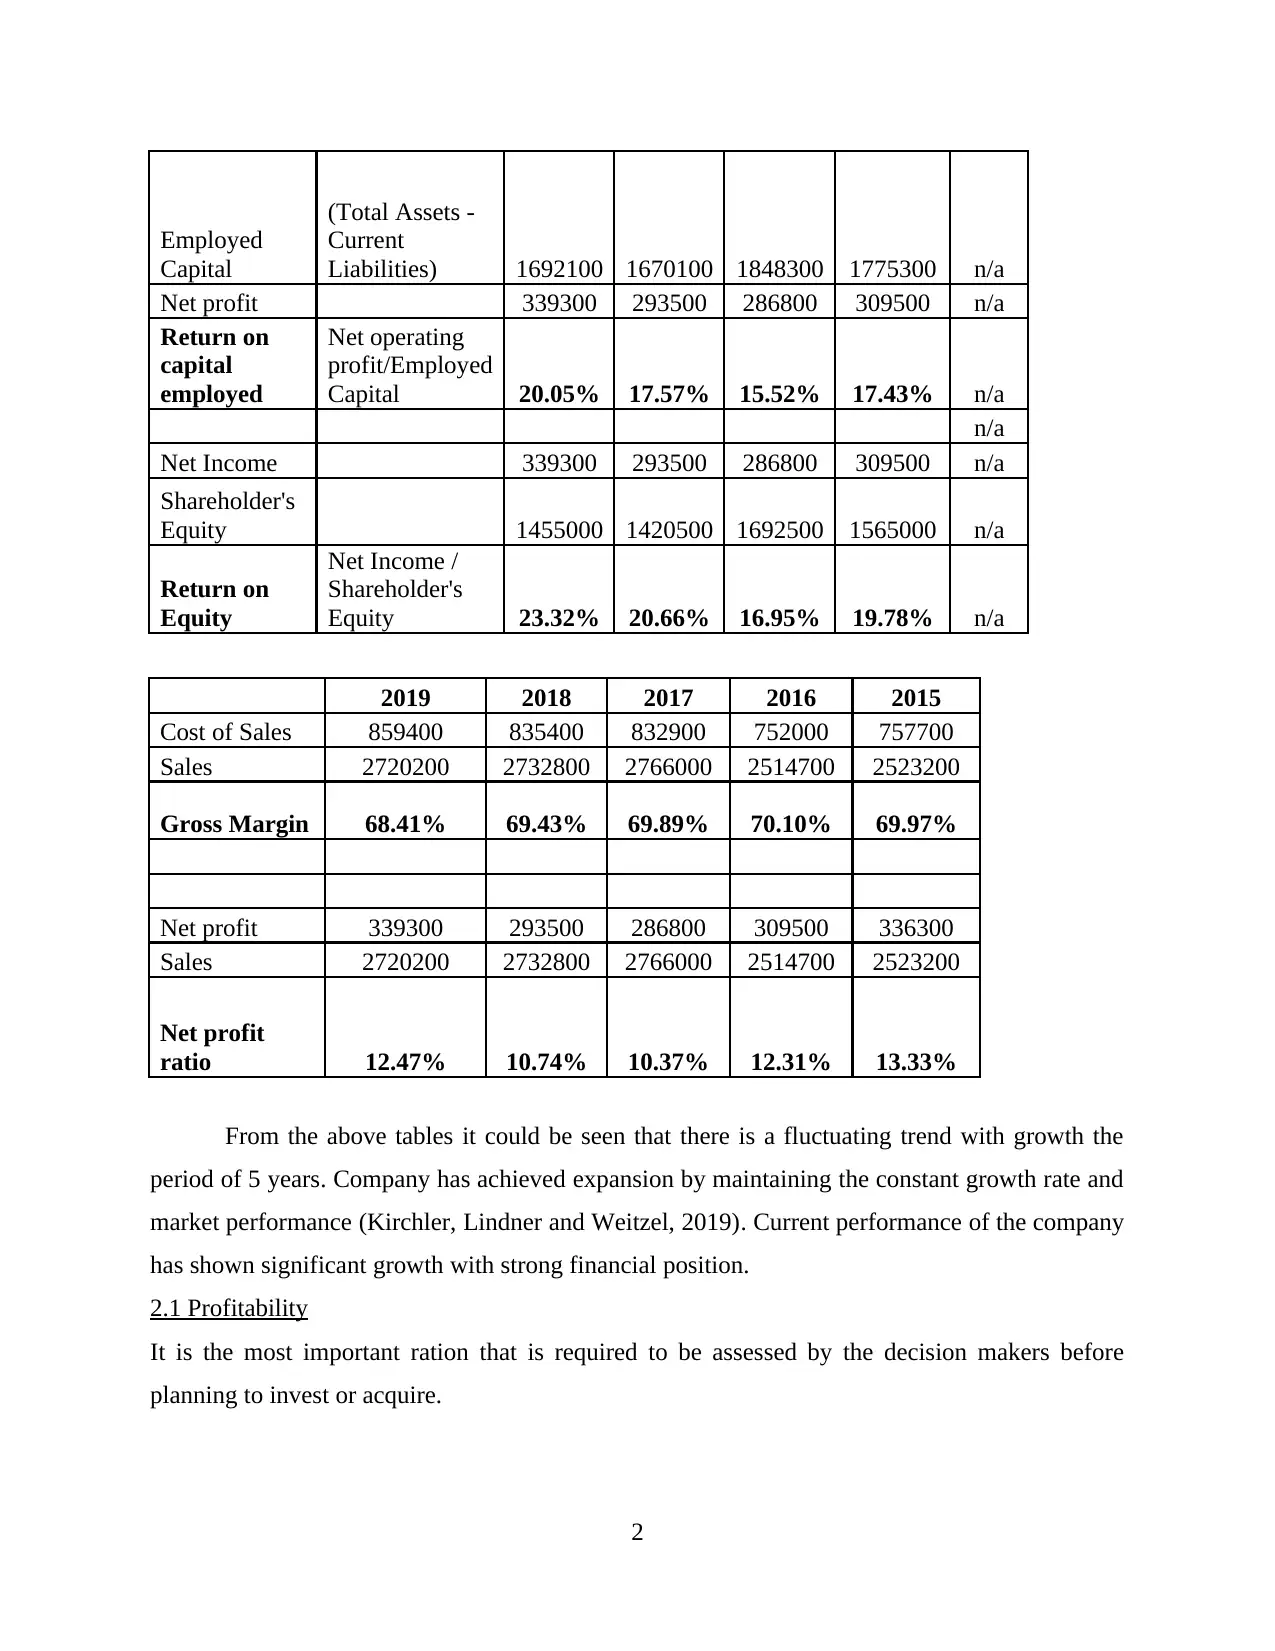
From the above tables it could be seen that there is a fluctuating trend with growth the
period of 5 years. Company has achieved expansion by maintaining the constant growth rate and
market performance (Kirchler, Lindner and Weitzel, 2019). Current performance of the company
has shown significant growth with strong financial position.
2.1 Profitability
It is the most important ration that is required to be assessed by the decision makers before
planning to invest or acquire.
2
Capital
(Total Assets -
Current
Liabilities) 1692100 1670100 1848300 1775300 n/a
Net profit 339300 293500 286800 309500 n/a
Return on
capital
employed
Net operating
profit/Employed
Capital 20.05% 17.57% 15.52% 17.43% n/a
n/a
Net Income 339300 293500 286800 309500 n/a
Shareholder's
Equity 1455000 1420500 1692500 1565000 n/a
Return on
Equity
Net Income /
Shareholder's
Equity 23.32% 20.66% 16.95% 19.78% n/a
2019 2018 2017 2016 2015
Cost of Sales 859400 835400 832900 752000 757700
Sales 2720200 2732800 2766000 2514700 2523200
Gross Margin 68.41% 69.43% 69.89% 70.10% 69.97%
Net profit 339300 293500 286800 309500 336300
Sales 2720200 2732800 2766000 2514700 2523200
Net profit
ratio 12.47% 10.74% 10.37% 12.31% 13.33%
From the above tables it could be seen that there is a fluctuating trend with growth the
period of 5 years. Company has achieved expansion by maintaining the constant growth rate and
market performance (Kirchler, Lindner and Weitzel, 2019). Current performance of the company
has shown significant growth with strong financial position.
2.1 Profitability
It is the most important ration that is required to be assessed by the decision makers before
planning to invest or acquire.
2
Paraphrase This Document
Need a fresh take? Get an instant paraphrase of this document with our AI Paraphraser
2019 2018 2017 2016
0.00%
5.00%
10.00%
15.00%
20.00%
25.00%
20.05%
17.57%
15.52%
17.43%
Return on capital employed
Return on capital
employed
The above table represents the performance of the company from year 2016. The return
over capital employed of company was 17.43% in 2016. There has been slight decrease in the
profitability ratio from the return in 2017 this was due to the small investments made by the
company and purchase of new plant and equipments by the company. However it could be seen
over the current year it has increased significantly to 20%. This shows it is efficiently utilising its
resources for generating revenues and profits.
2019 2018 2017 2016
0.00%
5.00%
10.00%
15.00%
20.00%
25.00% 23.32%
20.66%
16.95%
19.78%
Return on Equity
Return on Equity
Gross profit margin of company shows that it is giving adequate returns to its investors
over their equity investments. Company generated return of 23.32%in 2019 on equity which was
16.95% in 2017. This year was of critical for the company where decline were in seen in
3
0.00%
5.00%
10.00%
15.00%
20.00%
25.00%
20.05%
17.57%
15.52%
17.43%
Return on capital employed
Return on capital
employed
The above table represents the performance of the company from year 2016. The return
over capital employed of company was 17.43% in 2016. There has been slight decrease in the
profitability ratio from the return in 2017 this was due to the small investments made by the
company and purchase of new plant and equipments by the company. However it could be seen
over the current year it has increased significantly to 20%. This shows it is efficiently utilising its
resources for generating revenues and profits.
2019 2018 2017 2016
0.00%
5.00%
10.00%
15.00%
20.00%
25.00% 23.32%
20.66%
16.95%
19.78%
Return on Equity
Return on Equity
Gross profit margin of company shows that it is giving adequate returns to its investors
over their equity investments. Company generated return of 23.32%in 2019 on equity which was
16.95% in 2017. This year was of critical for the company where decline were in seen in
3
profitability levels and the returns earned over the company. Investors of any company are
interested in the return over their investment (Fashion United UK, 2019). The efficient
performance of the company is providing adequate returns to the investors. Company along with
providing returns also required maximising the shareholder value by increasing the market
capitalisation of the resources.
2019 2018 2017 2016 2015
0.00%
2.00%
4.00%
6.00%
8.00%
10.00%
12.00%
14.00%
12.47%
10.74% 10.37%
12.31%
13.33%
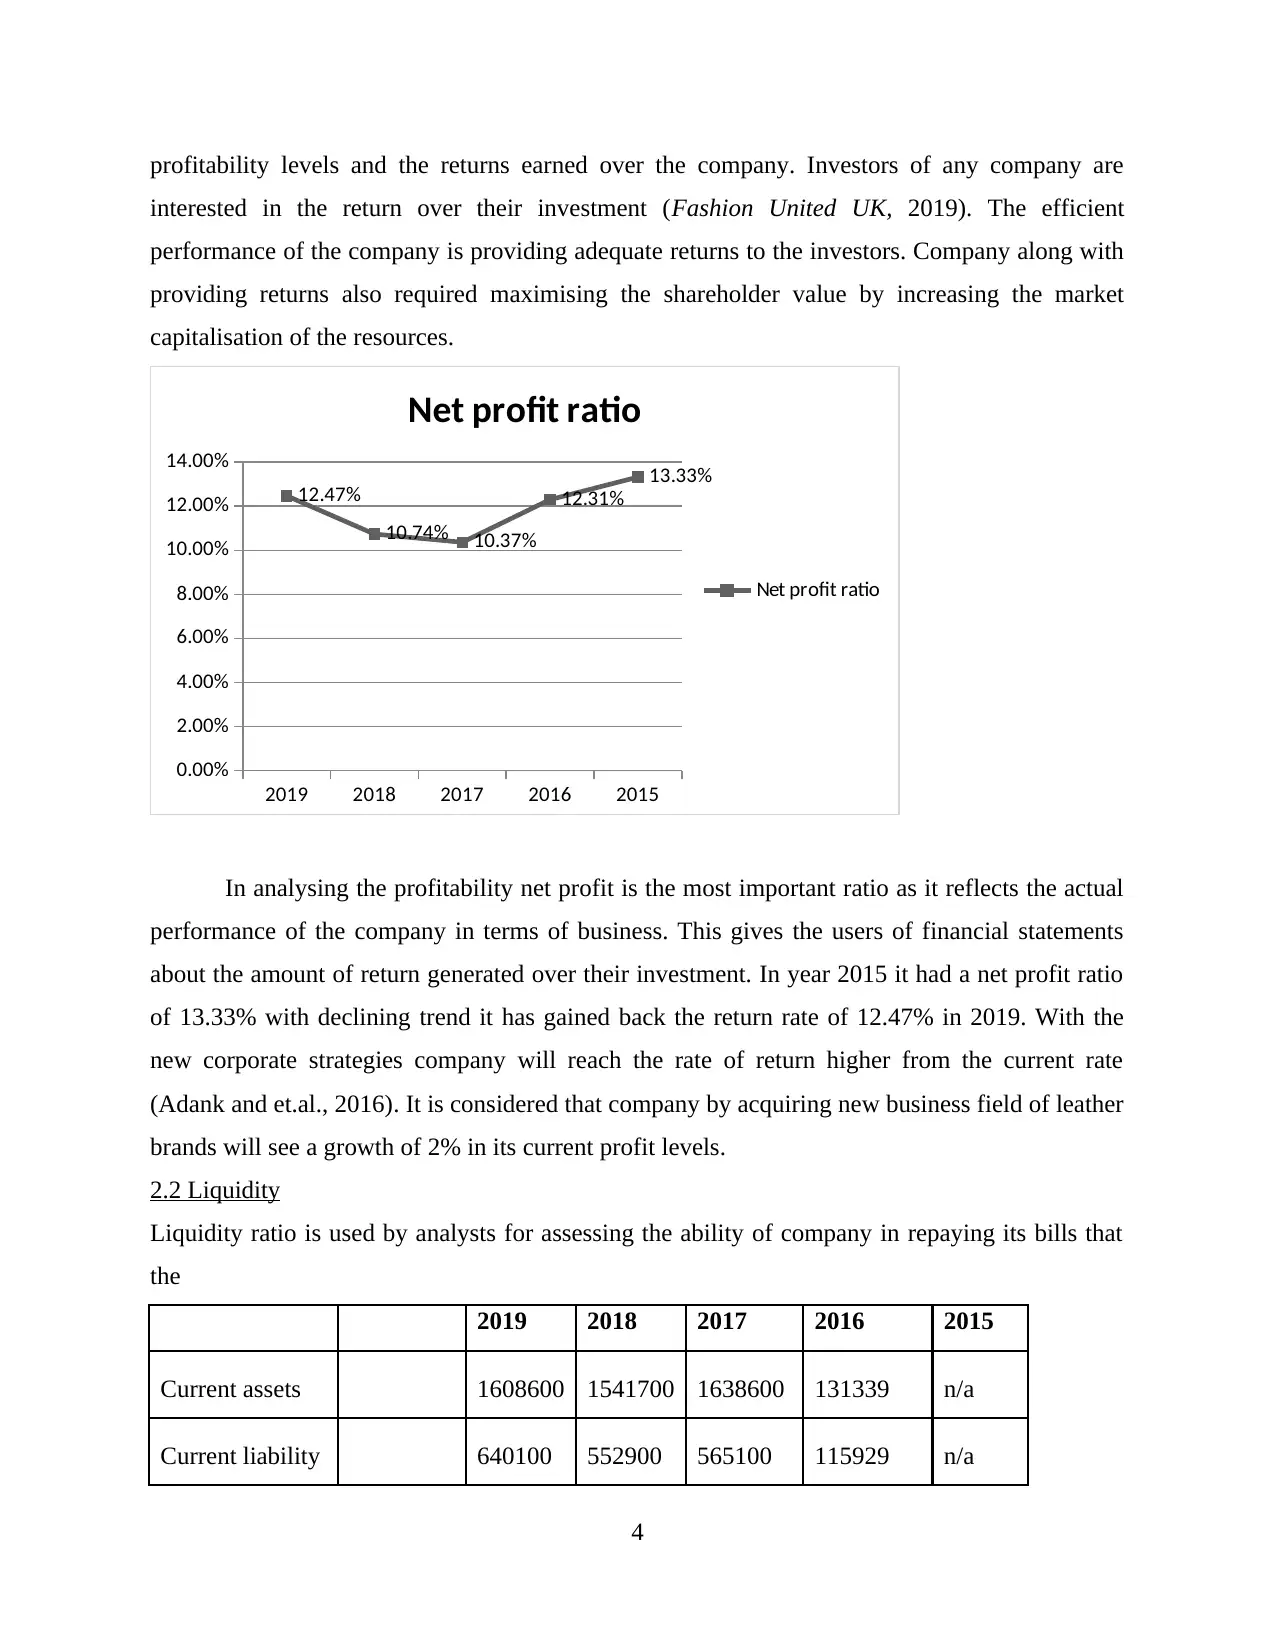
Net profit ratio
Net profit ratio
In analysing the profitability net profit is the most important ratio as it reflects the actual
performance of the company in terms of business. This gives the users of financial statements
about the amount of return generated over their investment. In year 2015 it had a net profit ratio
of 13.33% with declining trend it has gained back the return rate of 12.47% in 2019. With the
new corporate strategies company will reach the rate of return higher from the current rate
(Adank and et.al., 2016). It is considered that company by acquiring new business field of leather
brands will see a growth of 2% in its current profit levels.
2.2 Liquidity
Liquidity ratio is used by analysts for assessing the ability of company in repaying its bills that
the
2019 2018 2017 2016 2015
Current assets 1608600 1541700 1638600 131339 n/a
Current liability 640100 552900 565100 115929 n/a
4
interested in the return over their investment (Fashion United UK, 2019). The efficient
performance of the company is providing adequate returns to the investors. Company along with
providing returns also required maximising the shareholder value by increasing the market
capitalisation of the resources.
2019 2018 2017 2016 2015
0.00%
2.00%
4.00%
6.00%
8.00%
10.00%
12.00%
14.00%
12.47%
10.74% 10.37%
12.31%
13.33%
Net profit ratio
Net profit ratio
In analysing the profitability net profit is the most important ratio as it reflects the actual
performance of the company in terms of business. This gives the users of financial statements
about the amount of return generated over their investment. In year 2015 it had a net profit ratio
of 13.33% with declining trend it has gained back the return rate of 12.47% in 2019. With the
new corporate strategies company will reach the rate of return higher from the current rate
(Adank and et.al., 2016). It is considered that company by acquiring new business field of leather
brands will see a growth of 2% in its current profit levels.
2.2 Liquidity
Liquidity ratio is used by analysts for assessing the ability of company in repaying its bills that
the
2019 2018 2017 2016 2015
Current assets 1608600 1541700 1638600 131339 n/a
Current liability 640100 552900 565100 115929 n/a
4
⊘ This is a preview!⊘
Do you want full access?
Subscribe today to unlock all pages.
Trusted by 1+ million students worldwide
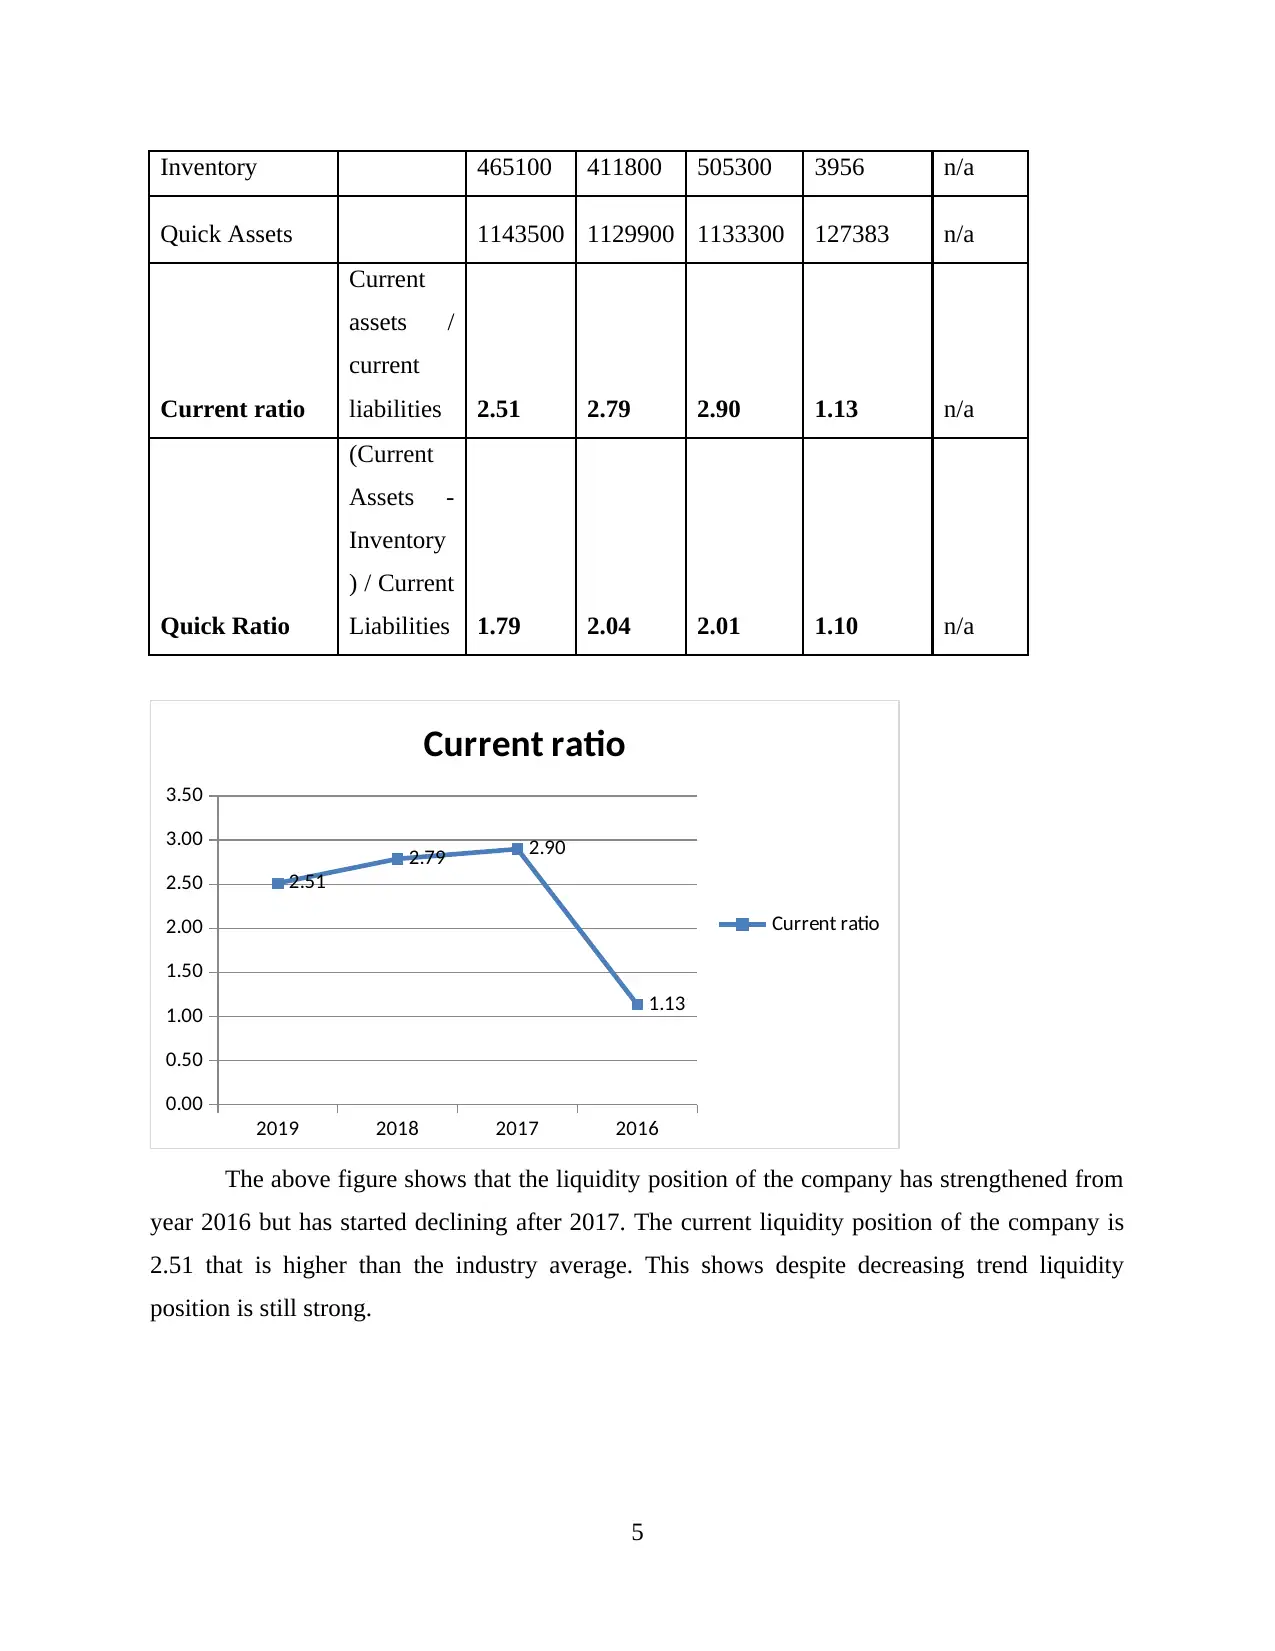
Inventory 465100 411800 505300 3956 n/a
Quick Assets 1143500 1129900 1133300 127383 n/a
Current ratio
Current
assets /
current
liabilities 2.51 2.79 2.90 1.13 n/a
Quick Ratio
(Current
Assets -
Inventory
) / Current
Liabilities 1.79 2.04 2.01 1.10 n/a
2019 2018 2017 2016
0.00
0.50
1.00
1.50
2.00
2.50
3.00
3.50
2.51
2.79 2.90
1.13
Current ratio
Current ratio
The above figure shows that the liquidity position of the company has strengthened from
year 2016 but has started declining after 2017. The current liquidity position of the company is
2.51 that is higher than the industry average. This shows despite decreasing trend liquidity
position is still strong.
5
Paraphrase This Document
Need a fresh take? Get an instant paraphrase of this document with our AI Paraphraser
2019 2018 2017 2016
0.00
0.50
1.00
1.50
2.00
2.50
1.79
2.04 2.01
1.10
Quick Ratio
Quick Ratio
Measuring the liquidity position without considering is 1.79 in 2019. This could be
considered that the liquidity is strong as company is able to meet its obligation even after
excluding inventory however it has to further strengthen its position. Company has to pay
attention over moving the trend upwards by strengthening its liquidity.
2.3 Evaluation of ratio analysis
The overall analysis shows that the ROCE & ROE of the company has increased from the
last five years. The corporate strategies adopted by the company year 2017 have proved to be
successful and has helped the company to achieve constant growth. However with the constant
increase in profit levels the cash requirements have also increased during the years leading to
downward movement of the liquidity position of the company. it has to make the operating cash
cycle effective for meeting the working capital requirements. Efficient management of the
current resources will enable to company to strengthen its liquidity that is very essential where it
is planning to invest in new business.
2.4 Limitation of the ratio analysis
Ratio analysis is an effective tool used by the organisation to assess the financial
performance and position of the company. Limitations of the ratio analysis is that it is based on
the historical data and do not enable the company to make forecasts (Inani and Gupta, 2017).
Ratio analysis also ignores concept of time value and money in its calculation of performance of
the company over the years.
6
3 Future investment appraisals
There are three most important tools that are used for evaluating the capital investment
proposals of the business, which are, payback period (PBP), net present value (NPV) and internal
rate of return (IRR).
3.1 Evaluation of NPV techniques
The net present value is basically the difference between the present value of cash inflow
and cash outflow. It is widely used method in capital budgeting and planning which helps in
analysing the profitability of the projected investment. The positive net present value means that
the projected earnings form the project is exceeding the anticipated expenses or cost (Hopkinson,
2017). It is the rule to accept the proposal only when the NPV is positive. On the other hand,
negative NPV indicates that the project is running loss and it is not feasible to continue with it.
The NPV considers time value of money while evaluating the projects and also it assists the
management in making decisions between multiple projects of same size by comparing tehri
profitability (Leyman and Vanhoucke, 2016). It takes into account capital cost as the discounting
rate for evaluating the projects which is the minimum rate shareholders needs to invest in the
company. In contrast to its benefits, it has certain drawbacks as well. It considers only the cash
flows of the project which means it does not consider other cost that can have an impact over it.
Also, it assumes the same discount rate over the life of the investment.
3.2 Evaluation of IRR techniques
It is the discounted rate at which NPV is zero. IRR is used to measure and compare the
growth of multiple projects and investment plans. This investment appraisal technique is the
common measure used by the management to decide which project is yielding higher return. IRR
gives accurate rate of return for every project which is very useful for the investors (Magni,
2020). IRR takes into account time value of money that helps in evaluating the accurate rate.
This technique helps in maximizing the profitability and shareholder’s wealth. On the other
hand, it has certain disadvantages as well. It is based on trial and error approach and ignores
economies of scale. It requires cost of capital for taking decisions. Also, it is based on the
assumption that all the cash flows will be reinvested in the market at the IRR. Another drawback
is that a project may have varying IRR values over the life of the project.
There are situations when the there is low IRR and NPV but the company can still
continue with the project may be because of diversification of risk, the investment can eb
7
⊘ This is a preview!⊘
Do you want full access?
Subscribe today to unlock all pages.
Trusted by 1+ million students worldwide
profitable in later stage etc.
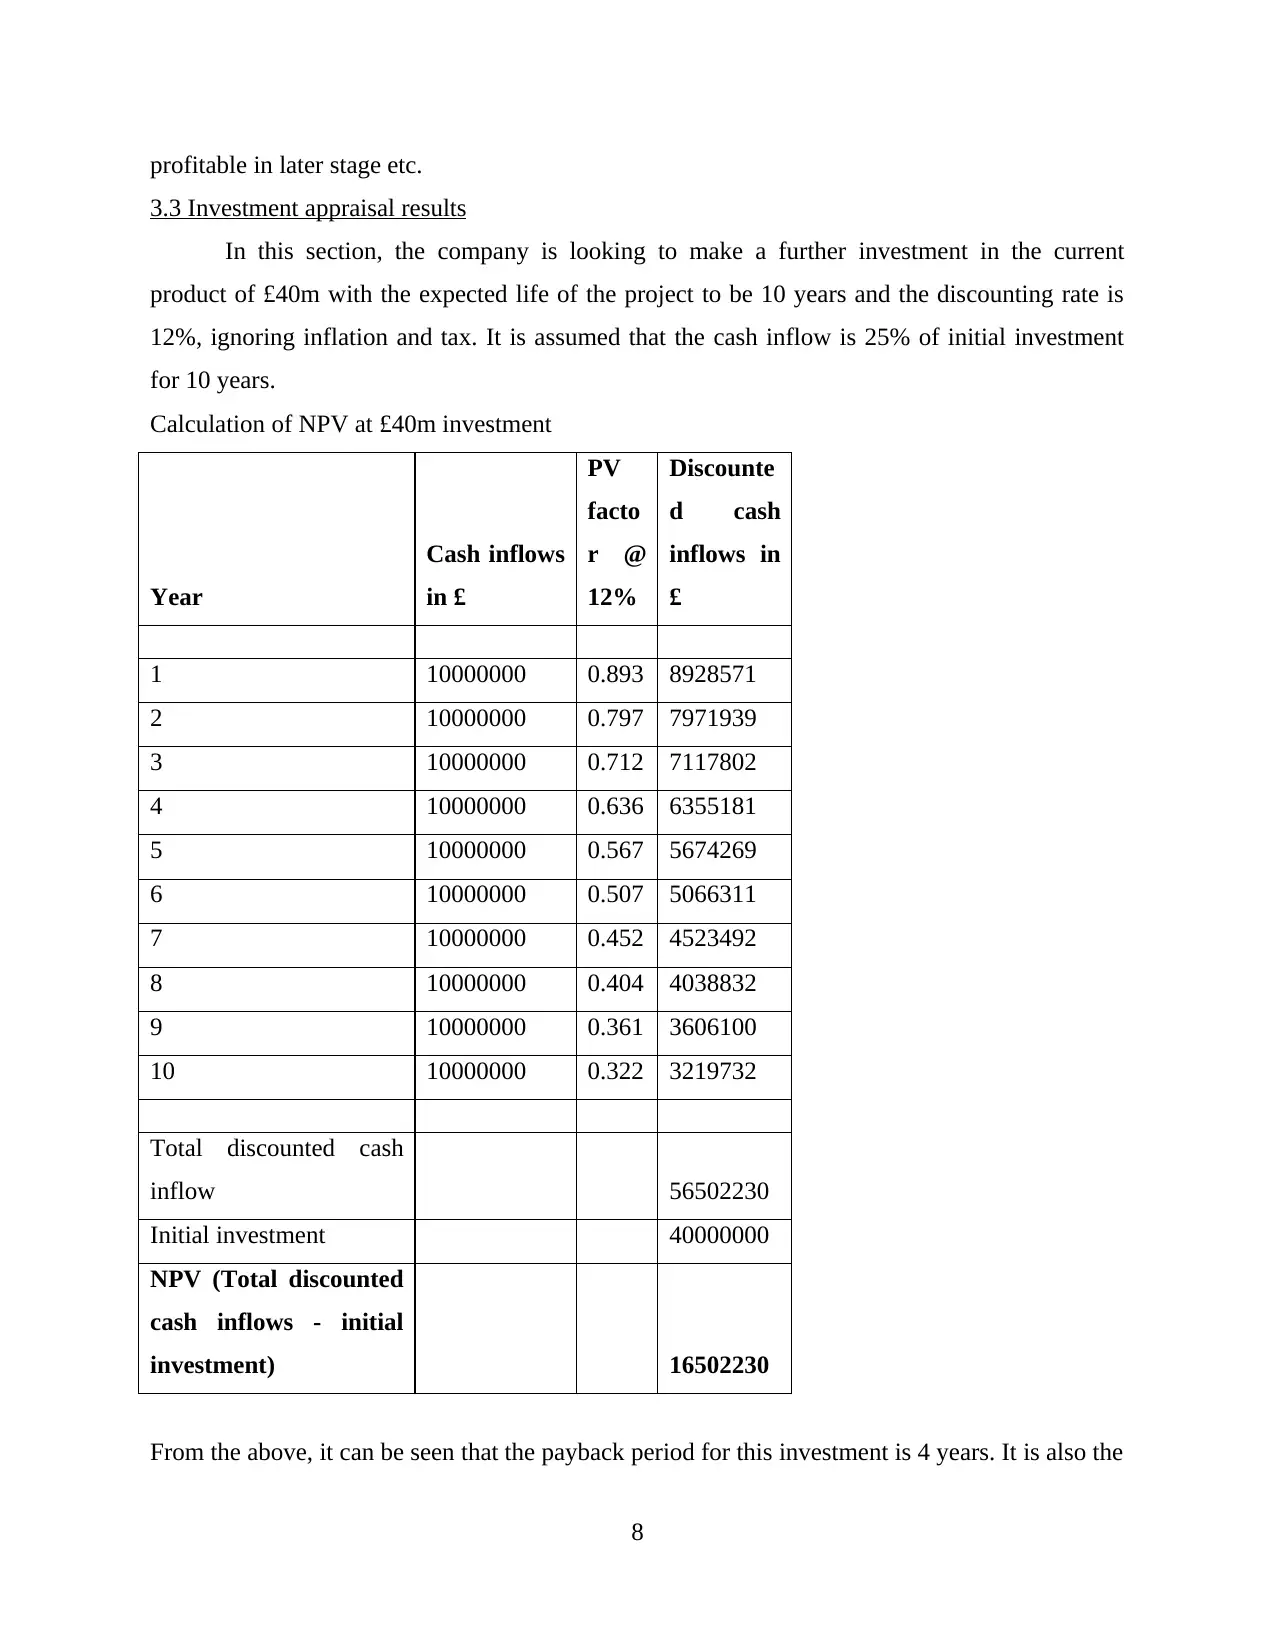
3.3 Investment appraisal results
In this section, the company is looking to make a further investment in the current
product of £40m with the expected life of the project to be 10 years and the discounting rate is
12%, ignoring inflation and tax. It is assumed that the cash inflow is 25% of initial investment
for 10 years.
Calculation of NPV at £40m investment
Year
Cash inflows
in £
PV
facto
r @
12%
Discounte
d cash
inflows in
£
1 10000000 0.893 8928571
2 10000000 0.797 7971939
3 10000000 0.712 7117802
4 10000000 0.636 6355181
5 10000000 0.567 5674269
6 10000000 0.507 5066311
7 10000000 0.452 4523492
8 10000000 0.404 4038832
9 10000000 0.361 3606100
10 10000000 0.322 3219732
Total discounted cash
inflow 56502230
Initial investment 40000000
NPV (Total discounted
cash inflows - initial
investment) 16502230
From the above, it can be seen that the payback period for this investment is 4 years. It is also the
8
Paraphrase This Document
Need a fresh take? Get an instant paraphrase of this document with our AI Paraphraser
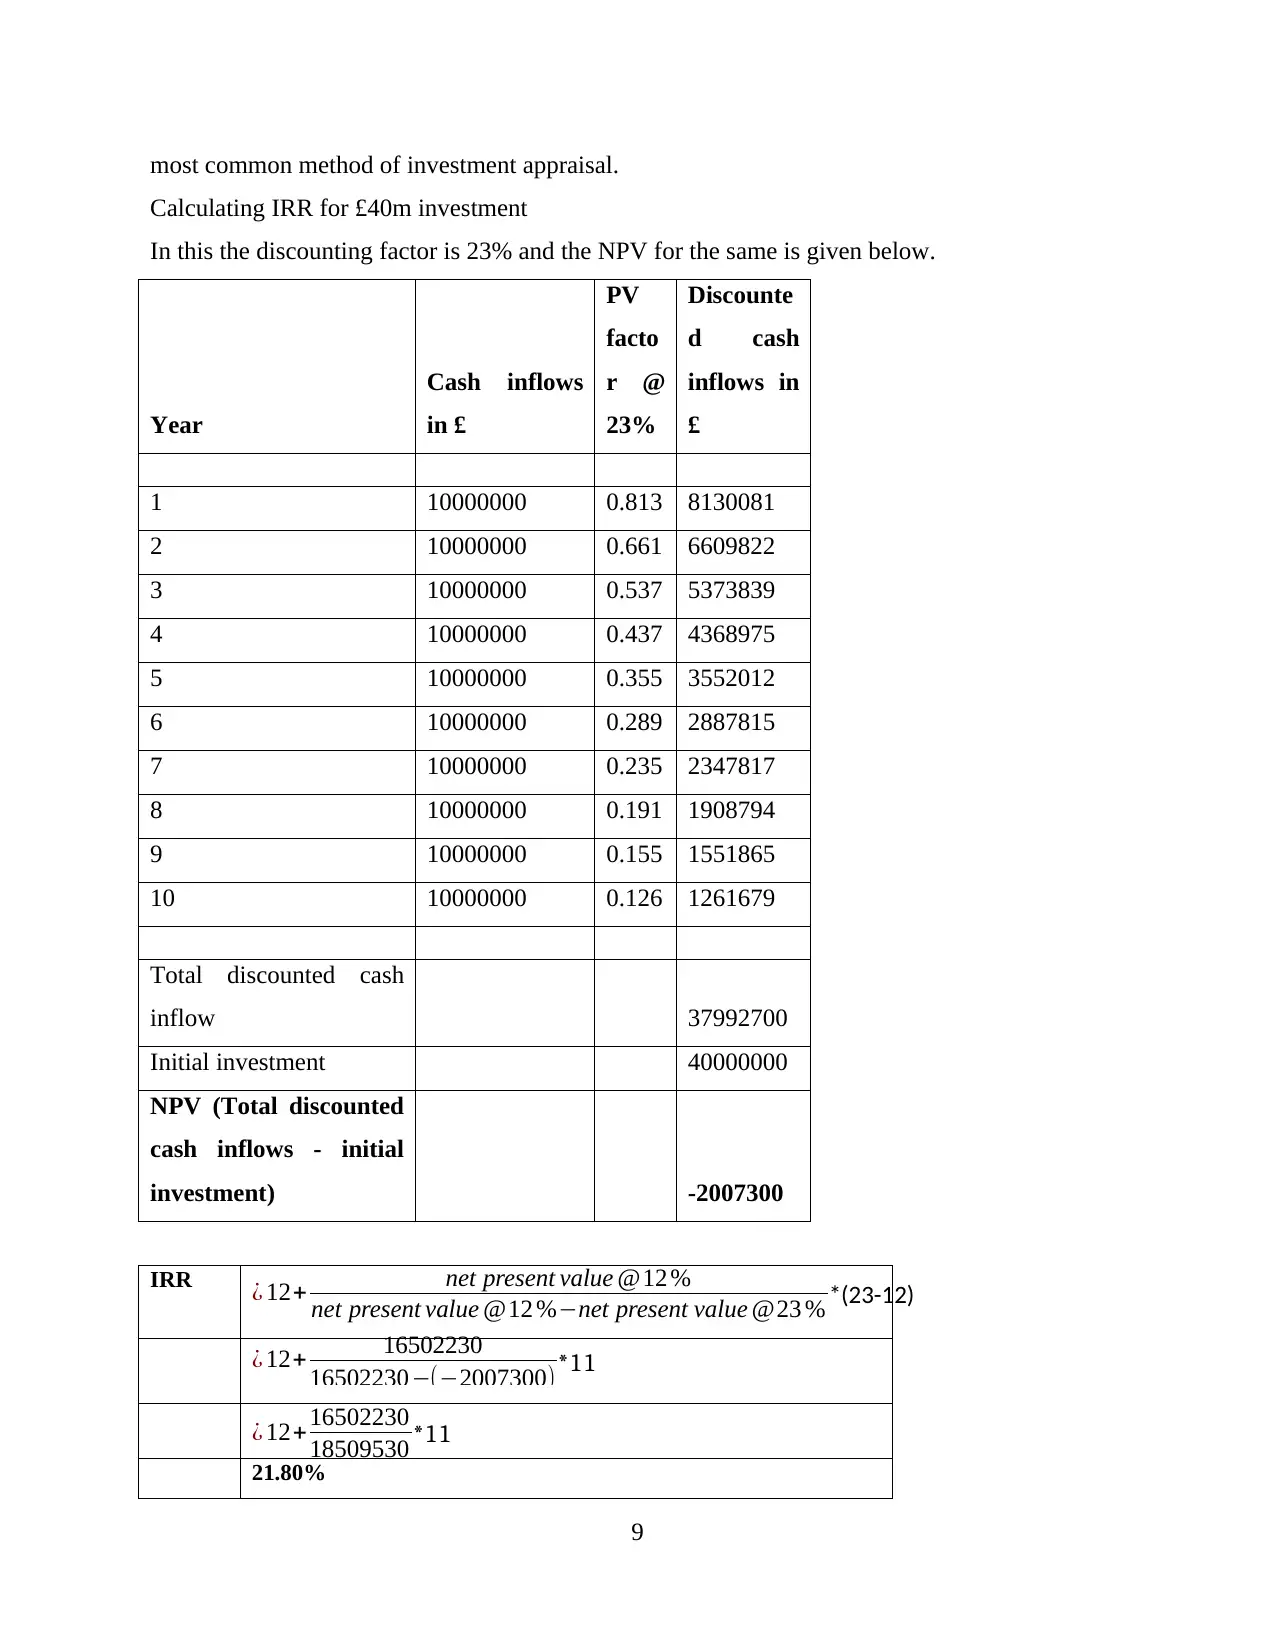
most common method of investment appraisal.
Calculating IRR for £40m investment
In this the discounting factor is 23% and the NPV for the same is given below.
Year
Cash inflows
in £
PV
facto
r @
23%
Discounte
d cash
inflows in
£
1 10000000 0.813 8130081
2 10000000 0.661 6609822
3 10000000 0.537 5373839
4 10000000 0.437 4368975
5 10000000 0.355 3552012
6 10000000 0.289 2887815
7 10000000 0.235 2347817
8 10000000 0.191 1908794
9 10000000 0.155 1551865
10 10000000 0.126 1261679
Total discounted cash
inflow 37992700
Initial investment 40000000
NPV (Total discounted
cash inflows - initial
investment) -2007300
IRR
21.80%
9
¿ 12+ net present value @12 %
net present value @12 %−net present value @23 % *(23-12)
¿ 12+ 16502230
16502230−(−2007300)*11
¿ 12+16502230
18509530 *11
3.4 Potential implication of investment
Based on the above calculations, this investment plan should be accepted as the payback
period is only 4 years with the NPV of £16.5m and IRR of 21.8% approximately after 10 years.
Along with that it will still have this asset after 10 years for the purpose of sale or rental fee,
which due o inflation and it will increase over the long term.
4. Potential acquisition of Leather Goods factory
It has been evaluated from the research that Burberry is thinking of acquiring Coach.
Company has been working with financial advisors for the potential acquisition. The company is
basically an Italian factory who is been involved in selling out the luxurious hand bags. They
have segmented high income based consumers in order to increase the sales and profitability
related to firm (Costa and et.al., 2017). The CEO of the firm is responsible for taking various
financial decisions. This acquisition will help Burberry in making and representing them as a
strong player in market. It will also assist them in gaining large amount of market share which is
necessary for their growth. It has also been analysed that small part of the factory will remain
independent. The factory consists of some 800 employees who are working with them. All of the
workers will be now working for Burberry.
4.1 Rationale for choosing the target company
The Italian leather good factory is going to be acquired by Burberry because the owner of
the firm is been involved in making high quality of leather products and continuously investing
in it. This can act as a potential benefit for Burberry and can also assist firm in growing and
achieving their goals and objectives. It has also been analysed from the research that sales of
factory done by its owner is been done at right price. There will be a friendly acquisition rather
than hostile one. It has also been analysed that the employees working in leather goods factory
are also really skilled, so this will also act as a benefit for Burberry to grow and enhance their
financial position in the market. It has also been analysed that Burberry can also invest in long
term growth strategies. This will assist them in increasing the market share as well as their
profitability aspects. It will also help firm in growing and becoming financially viable.
The reason for selecting leather good factory in Italy can also be fully understand by
making use of the SWOT model. It includes the following:
10
⊘ This is a preview!⊘
Do you want full access?
Subscribe today to unlock all pages.
Trusted by 1+ million students worldwide
1 out of 15
Related Documents


Your All-in-One AI-Powered Toolkit for Academic Success.
+13062052269
info@desklib.com
Available 24*7 on WhatsApp / Email
![[object Object]](/_next/static/media/star-bottom.7253800d.svg)
Unlock your academic potential
Copyright © 2020–2025 A2Z Services. All Rights Reserved. Developed and managed by ZUCOL.