Finance Portfolio Management
VerifiedAdded on 2023/04/04
|15
|2854
|173
AI Summary
This document provides an in-depth analysis of finance portfolio management, including the construction of stable return and high return portfolios. It explores the application of modern portfolio theory and evaluates the performance of portfolios using various performance measures. The document also discusses the limitations of portfolio management and provides expert guidance on constructing portfolios.
Contribute Materials
Your contribution can guide someone’s learning journey. Share your
documents today.

Running Head: Finance Portfolio Management
Finance Portfolio Management
PC-LE0327
Finance Portfolio Management
PC-LE0327
Secure Best Marks with AI Grader
Need help grading? Try our AI Grader for instant feedback on your assignments.

Contents
Introduction...........................................................................................................................................2
1. Portfolio Construction...................................................................................................................2
2. Application of Modern Portfolio Theory in Portfolio Construction...............................................3
Sharpe Ratio......................................................................................................................................8
Treynor Ratio....................................................................................................................................9
Jensen’s Alpha...................................................................................................................................9
3. Performance of Portfolios in January-February 2019..................................................................12
4. Limitation....................................................................................................................................13
5. Conclusion...................................................................................................................................13
References...........................................................................................................................................14
Appendix.............................................................................................................................................15
1

Introduction
At the time of making an investment decision the main motives of the investors are to receive
a higher return on the amount invested and to reduce the risk of loss. Usually, there are
investors who prefer to receive a fixed amount of return on their invested amount which may
include a pensioner, salaried person planning a marriage, education of his son/daughter or
future travel plans (Forbes, 2019). Then, there are people who have the capability of taking
more and more risk to get a good sum of return. Such persons usually have a good amount of
money which usually increases their risk taking capability. The profit or loss on investment
depends highly upon the selection of stocks which ultimately forms a portfolio. There are
certain parameters which are considered at the time of forming a portfolio which includes the
political, economic, environmental etc. factors and the most important parameter which
influences a portfolio is the risk attached with the stock and its sector. The main motive
behind the portfolio construction is nothing but is to diversify this risk at the maximum level.
Apart from this it is always advisable to look both risk return together at the time of
evaluating portfolio.
1. Portfolio Construction
As we know there are two kinds of investors: first those investors who want to get a stable
return from the amount invested and they are usually risk averse and then there are those
investors who love to take risks but expect a higher rate of return from the market.
There are stocks which give a stable return over a period of time and are less volatile. Also,
there are stocks which are highly volatile and give a high return, however the risk in such
stocks are on a higher side. For the investors who believe in taking more risk for a higher rate
of return on their money, they usually opt for such stocks.
At the time of forming stable return portfolio, the betas of individual stocks were considered
and the ones with the lower beta were selected like Admiral Group Plc., Auto Trader Group
Plc. and Pearson Plc. have beta of 0.54, -0.02 and 0.7 respectively. Also, the standard
deviations and returns of the stocks were calculated and the stocks with lowest risk and
lowest returns were chosen for stable return portfolio as shown in Table A.
In case of high return portfolio, the stocks with higher betas were chosen because such
volatile stocks usually give a higher return. The betas for high return portfolio are 1.36, 1.12
2

and 0.66 for Ocado, J Sainsbury plc. and Evraz plc. respectively. Also, the stocks with higher
risk and higher returns were considered and we could find the figures in Table A.
In Table A, we could see that the stocks of stable return portfolio have lower return and lower
risk as compared to the stocks of high return portfolio which are having higher return and
higher risk.
Table A: Mean and Standard Deviation of Stocks of Portfolios
Stable Return
Portfolio Mean Standard
Deviation
High Return
Portfolio Mean Standard
Deviation
Admiral 5.57% 18% Ocado 68.42% 61.00%
Auto Trader 23.48% 28% J Sainsbury Plc. 7.98% 25.00%
Pearson Plc. 18.43% 21% Evraz 31.94% 46.27%
2. Application of Modern Portfolio Theory in Portfolio Construction
The theory of modern portfolio was given by Harry Markowitz which got published in the
year 1952 in Journal of Finance. He was the person who actually quantified the way of
forming portfolio at a given level of risk (U.S.News, 2018). The investors use this theory for
maximising their expected return on the formed portfolio. (Hawley and Lukomnik, 2018).
There are certain assumptions on which this theory works, like no transaction costs are
involved in buying/selling the securities, no tax are paid, risk is only considered at the time of
investing in any security, investors are allowed to take any position irrespective of its size and
type because the market is considered to be infinitely liquid, taxes and dividends are not
considered by the investor at the time of making an investment decision, investors are risk
adverse and rational along with the full knowledge of risk involved in the investment etc.
Three Asset Portfolio Formula
Covariance Formula
3
Secure Best Marks with AI Grader
Need help grading? Try our AI Grader for instant feedback on your assignments.
Variance Formula
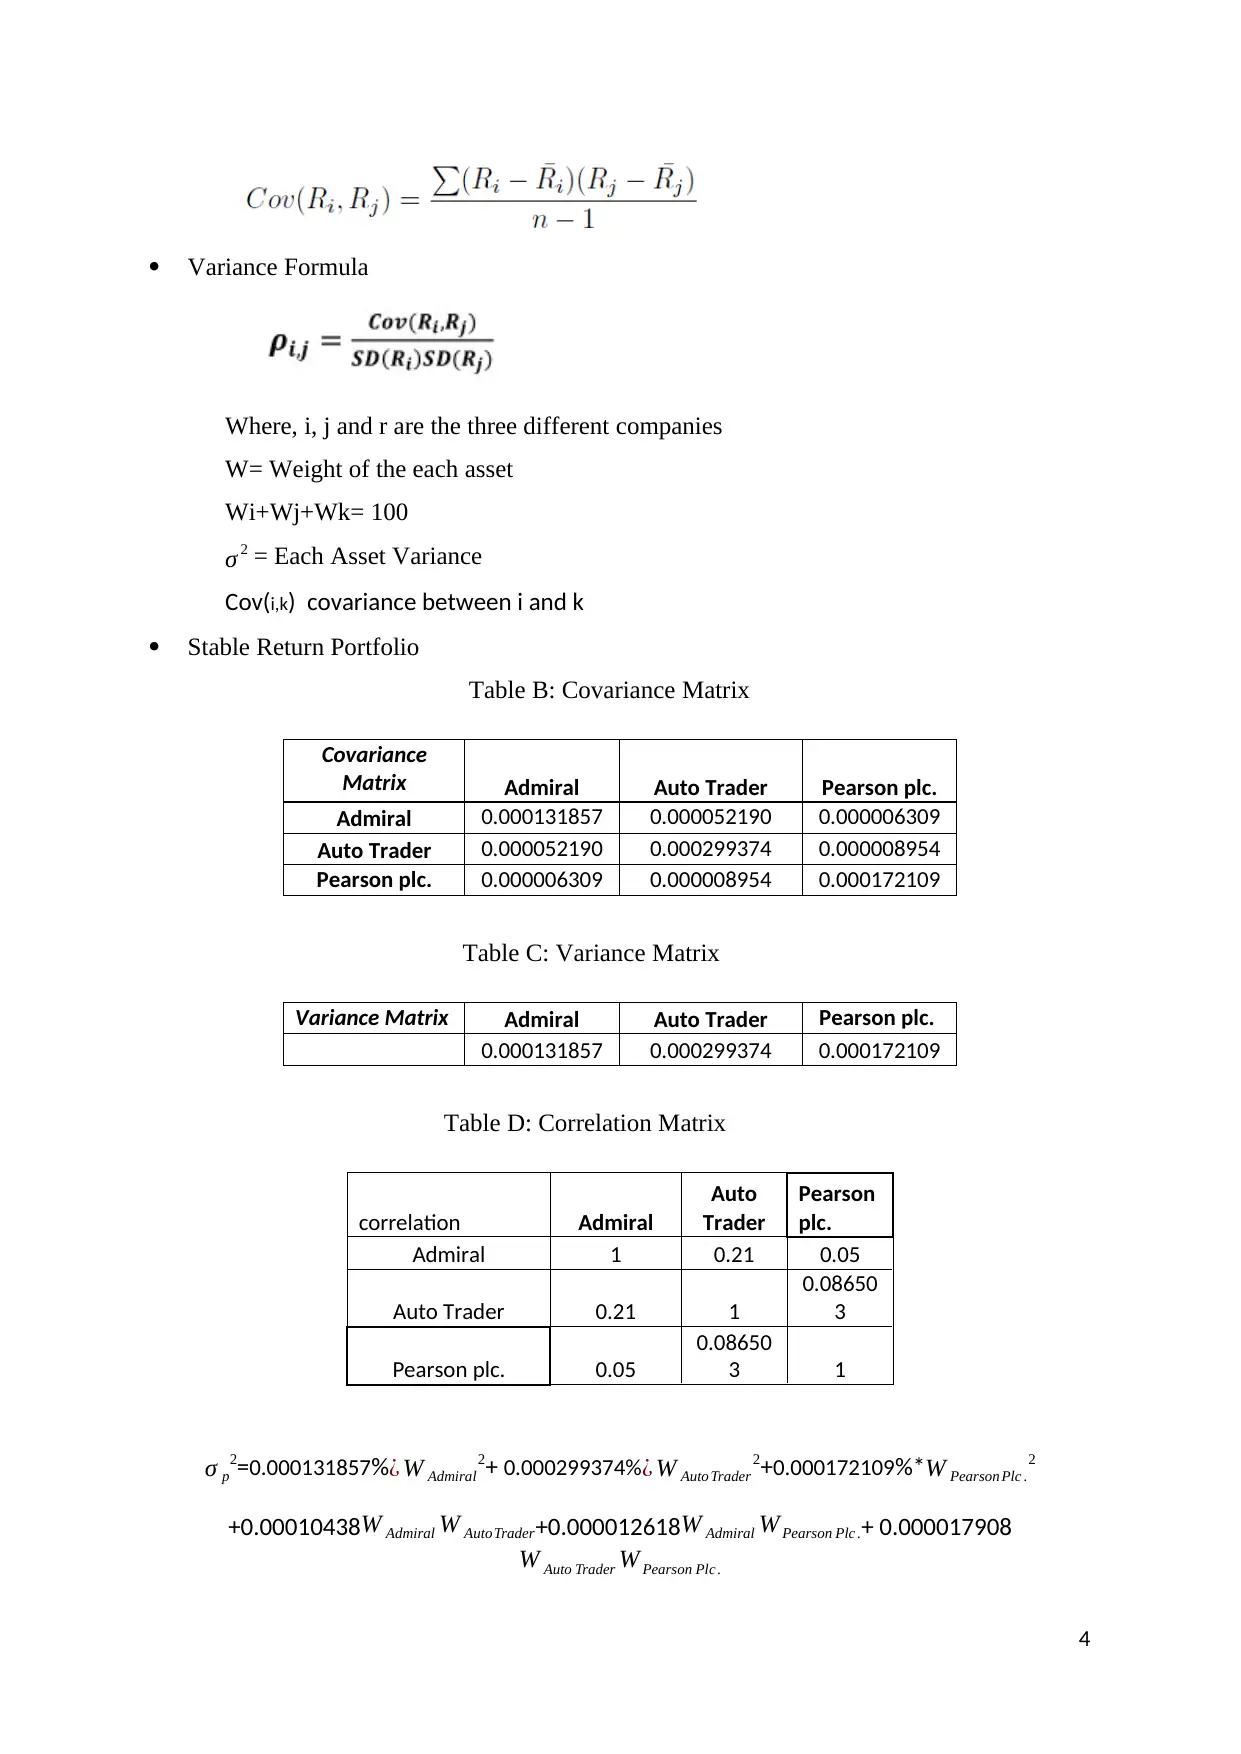
Where, i, j and r are the three different companies
W= Weight of the each asset
Wi+Wj+Wk= 100
σ 2 = Each Asset Variance
Cov(i,k) covariance between i and k
Stable Return Portfolio
Table B: Covariance Matrix
Covariance
Matrix Admiral Auto Trader Pearson plc.
Admiral 0.000131857 0.000052190 0.000006309
Auto Trader 0.000052190 0.000299374 0.000008954
Pearson plc. 0.000006309 0.000008954 0.000172109
Table C: Variance Matrix
Variance Matrix Admiral Auto Trader Pearson plc.
0.000131857 0.000299374 0.000172109
Table D: Correlation Matrix
correlation Admiral
Auto
Trader
Pearson
plc.
Admiral 1 0.21 0.05
Auto Trader 0.21 1
0.08650
3
Pearson plc. 0.05
0.08650
3 1
σ p
2=0.000131857%¿ W Admiral
2+ 0.000299374% ¿ W Auto Trader
2+0.000172109%*W Pearson Plc .
2
+0.00010438 W Admiral W AutoTrader+0.000012618W Admiral W Pearson Plc .+ 0.000017908
W Auto Trader W Pearson Plc .
4

E ( RStable Return Portfolio ) =5.57 %∗W Admiral+23.48 % W AutoTrader+ 18.43% W Pearson Plc
High Return Portfolio
Table E: Covariance Matrix
Ocado J Sainsbury plc. Evraz
Ocado 0.00147327671 0.00001228977 -0.00000534408
J Sainsbury plc. 0.00001228977 0.00024696506 0.00004465741
Evraz -0.00000534408 0.00004465741 0.00084608739
Table F: Variance Matrix
variance Matrix
Ocado J Sainsbury plc. Evraz
0.0014732767
1 0.00024696506
0.0008460873
9
Table G: Correlation Matrix
correlation Ocado
J
Sainsbur
y plc.
Evraz
Ocado 1 0.11 0.13
J Sainsbury plc 0.11 1
0.09769
4
Evraz 0.13 0.097694 1
σ p
20.00147327671 ¿ W Ocado
2+0.00024696506% ¿ W J Sainsbury plc .
2+0.00084608739%*W Evraz
2
+0.00001228977 W Ocado WJ Sainsbury Plc .+ (-0.00001068816) WOcado W Evraz+ 0.00008931482
W J Sainsbury plc . W Evraz
E ( RHighRetu rn Portfolio ) =68.42%∗W Ocado+7.98 % W J Sainsbury plc .+31.94 % W Evraz
5

Analysis of weight
Here, the weights of the stable return portfolio and high return portfolio are optimised to
maximise the sharp ratio and both of these optimal portfolios are identified through the
efficient frontiers given under Graph A.
Figure A: Efficient Frontiers
0.005000 0.010000 0.015000 0.020000 0.025000 0.030000 0.035000
-0.15%
-0.10%
-0.05%
0.00%
0.05%
0.10%
0.15%
Efficient frontier for High Return Portfolio
Efficient frontier
Standard Deviation
Returns
0.006000 0.008000 0.010000 0.012000 0.014000 0.016000
-0.15%
-0.10%
-0.05%
0.00%
0.05%
0.10%
Efficient Frontier for Stable Return Portfolio
Efficient Frontier
Standard Deviation
Returns
6
Paraphrase This Document
Need a fresh take? Get an instant paraphrase of this document with our AI Paraphraser

These portfolios are constructed using Markowitz Portfolio Theory. Efficient Frontiers are
constructed to find the combination which maximises the sharp ratio from the number of
weight combinations available for any portfolio. Efficient frontier is created to identify the set
of optimal portfolios that gives the maximum expected return for the given level of risk or the
minimum risk for the defined level of expected return. Now, in Table “H” one can find the
portfolios constructed for the above mentioned types of investors; first for the ones who want
a stable return on their investment and the others who want a higher return on their
investment.
Table H: Stable Returns Portfolio and High Returns Portfolio
Stable Return
Portfolio Sector Weight
s
High Return
Portfolio Sector Weight
s
Admiral Group plc. Financials 6.36 Ocado Group plc. Consumer
Discretionary 50.41%
Auto Trader Group plc. Communication Services 39.26 J Sainsbury plc. Consumer Staples 15.36%
Pearson plc. Communication Services 54.38 Evraz plc. Materials 34.23%
Comparison of Performance of Stable return Portfolio and High return Portfolio
Portfolios performance evaluation is usually conducted to know whether an investment
portfolio had underperformed or outperformed or had performed at par with a considered
benchmark which could be an index. There are various reasons for which performance of the
investment portfolio is evaluated. First, the investors are always keen to know the
performance of the portfolio in which they had invested their funds and accordingly they
manage or revise their portfolio. Second, with the help of the portfolio performance measures
the performance of the portfolio manager is evaluated.
There are usually three ratios which are computed in order to evaluate the performance of
portfolios. These are Sharpe ratios, Treynor ratio and Jensen’s alpha.
Now, let us evaluate the performance of the two portfolios formed for the investors looking
for stable return and for those looking for high return.
Sharpe Ratio
Sharpe ratio computes the excess return earned on per unit of total risk of the investment
portfolio (Morningstar, 2012). Sharpe ratio is calculated with the help of the following
7

formula:
where,
Rp= Portfolio return
Rf=Risk Free rate of return
σp= Portfolio standard deviation
S= Sharpe Ratio
Treynor Ratio
Treynor ratio computes the excess return earned on per unit of systematic risk. Excess return
is also known as risk premium (Benhamou and Guez, 2018). In case of Sharpe ratio, the
standard deviation of portfolio is used as risk parameter and here in case of Treynor ratio the
systematic risk is considered (cleartax, 2018). Systematic risk refers to those risks which
could never be removed or eliminated through diversification. Treynor ratio is calculated
with the help of the following formula:
where,
Rp= Portfolio return
Rf=Risk Free rate of return
ßp = Portfolio beta
T= Treynor Ratio
8
S= Rp-Rf/ σp
T= Rp-Rf/ ßp
where,
Rp= Portfolio return
Rf=Risk Free rate of return
σp= Portfolio standard deviation
S= Sharpe Ratio
Treynor Ratio
Treynor ratio computes the excess return earned on per unit of systematic risk. Excess return
is also known as risk premium (Benhamou and Guez, 2018). In case of Sharpe ratio, the
standard deviation of portfolio is used as risk parameter and here in case of Treynor ratio the
systematic risk is considered (cleartax, 2018). Systematic risk refers to those risks which
could never be removed or eliminated through diversification. Treynor ratio is calculated
with the help of the following formula:
where,
Rp= Portfolio return
Rf=Risk Free rate of return
ßp = Portfolio beta
T= Treynor Ratio
8
S= Rp-Rf/ σp
T= Rp-Rf/ ßp

Jensen’s Alpha
Jensen’s alpha is calculated on the basis of Capital Asset Pricing Model (CAPM). The figure
of alpha denotes by how much amount the average return of portfolio deviates from the
expected return calculated by applying the capital asset pricing model (CAPM) (Dr. Wu,
2007). The expected return calculated through CAPM actually considers risk free rate of
return, systematic risk and market risk premium.
Jensen’s alpha is calculated with the help of the following formula:
where,
Rp= Portfolio return
CAPM= Rf- ßp * (Market return -Rf)
α=Jensen’s Alpha
Performance Measure of Stable Return Portfolio
In Table I, the ratios are computed for evaluating the performance of stable return portfolio
during the time period of January- December 2018. Now, the first thing we could observe
from the figures of these ratios is that all these are positive in number. This shows that the
portfolio is giving an adequate amount of return and has performed really well. Individually,
the positive figure of Sharpe ratio and Treynor ratio of the stable return portfolio shows that
the investor has received some amount of return for the risk taken but it is not considered
good because the return received from the portfolio is below the risk free rate which stands at
0.72%. Lastly, the computed alpha of stable return portfolio has shown that the portfolio had
outperformed the market. Higher alphas are always considered to be good and acceptable.
9
α = Rp- CAPM
Secure Best Marks with AI Grader
Need help grading? Try our AI Grader for instant feedback on your assignments.

Table I: Performance measure of Stable Return Portfolio
Performance Measures of Stable Return
Portfolio
Sharpe Ratio 0.15
Treynor Ratio 0.18
Jensen's Ratio 0.25
Performance Measure of High Return Portfolio
In Table J, the ratios are computed for evaluating the performance of high return portfolio.
Now if we look at the performance of high return portfolio then all the three ratios are
positive. Individually, as per Sharpe ratio which considers only the systematic risk, the
portfolio had given the return as expected because the return received is much higher than the
return given by the risk free securities (0.72%). However, as per Treynor ratio, which
considers both systematic risk and unsystematic risk, is not so impressive. Jensen’s alpha of
the company is positive from where we may interpret that this portfolio had performed well.
Considering, Jenson’s alpha and Sharpe ratio of High return portfolio we could see the
potential of the investment portfolio to outperform the market.
Table J: Performance measure of High Return Portfolio
Performance Measures of High Return Portfolio
Sharpe Ratio 1.84
Treynor Ratio 0.42
Jensen's Ratio 0.61
Portfolio Comparison on the basis of Performance Measures
On comparing the two portfolios, we could see from Table K that high return portfolio had
performed much better than the stable return portfolio. Individually, the Sharpe ratio of high
return portfolio is 1.84 where the same ratio of stable return portfolio is only 0.15 which is
very minimal. This means that the systematic risk or market risk is more in high return
portfolio than stable return portfolio as a result of which the investors of high return stock can
10

expect a bigger sum of return. Now, Treynor ratio of high return portfolio is 0.42 and stable
return portfolio is just 0.18. This shows that the investors of high return portfolio can expect a
bigger compensation amount for the taking the risk over those who had invested in stable
return portfolio. Lastly, the Jensen’s alpha of high return portfolio is 100% higher than the
stable return portfolio which shows the potential of high return investment portfolio to
outperform the market.
3. Performance of Portfolios in January-February 2019
We could notice in Table K, that the expected return of high return portfolio is higher than
that of stable return portfolio. As per the portfolio theory, an investor of high return portfolio
always expects a higher return as a reward for taking more risk.
We know, that the portfolio formed for the purpose of getting a stable return possess a lower
risk than the portfolio formed for the getting a higher return. Here too we could see the risk
on higher return portfolio is 2% whereas the risk on stable return portfolio is only 1%.
Table K: Expected return and risk of portfolios
Jan- Feb 2019 Stable Return Portfolio
High Return
Portfolio
Expected return -0.03% 0.29%
Standard Deviation of
portfolio 1% 2%
4. Limitation of the Study
There are 100 companies listed on Financial Times Stock Exchange 100 Index, the reason for
which it was not possible to calculate the return for each of the stock to select high return and
stable return portfolio. Therefore, we calculated the returns of only few stocks to select the
stock for stable return and high return portfolio construction. Here the stocks are not selected
from the different sectors to form the portfolios because the requirement was to form the
portfolios using risk and return concept. Generally, if there is a high correlation between two
or three sectors, then the risk of loss is on a higher side. Say for example, if one sector got
adversely affected by any systematic risk and the companies operating in that sector had to
face a heavy drop in their share prices. In such cases, the other sectors having a positive
correlation with the systematic risk affected sector will also notice a drop in the share prices
11

because of the same systematic risk. So, at the time of forming portfolio it is always advisable
to include the stocks from different sectors with no correlation between them.
5. Conclusion
So before taking an investment decision each of the stocks, their sectors, risk, return etc. are
properly evaluated in order to avoid the risk of loss. The investors try to diversify their risk
with the help of forming a good portfolio and this concept of forming a portfolio for risk
diversification was given by Harry Markowitz. The investors with a low risk appetite prefer
to invest in a stable risk portfolio and the investors with a high risk appetite go for high risk
portfolio. We chose two separate portfolios for both types of investors wherein we found that
the performance of the portfolio do not solely depends upon the return but it also relies on the
risk. The performance of the portfolios is also measured by the investors with the help of the
tools like Sharpe ratios, Treynor ratio and Jensen’s alpha. These ratios are even used by the
management of the company to access the ability of the portfolio manager. The performance
of the portfolio also depends upon the market condition as a result of which both the
portfolios gave a desirable performance in the year 2018 however the same portfolio
responded in a negative manner in the year 2019. Therefore, portfolio helps in diversifying
the risk however there are certain factors which could never be controlled and thereby risk
cannot be eliminated completely.
12
Paraphrase This Document
Need a fresh take? Get an instant paraphrase of this document with our AI Paraphraser

References
Benhamou, E., And Guez, B. (2018).Incremental Sharpe and other performance ratios. [Online].
Available 27 May, 2019 https://arxiv.org/pdf/1807.09864.pdf.
Cleartax.(2018). Treynor Ratio: Meaning, calculation, how to use it and more. [Online]. Available 27
May, 2019 https://cleartax.in/s/treynor-ratio.
forbes.com.(2019).8 Strategies That Offer High Return With Low Risk. [Online]. Available 27 May,
2019 https://www.forbes.com/sites/jrose/2016/06/23/8-strategies-that-offer-high-return-with-low-
risk/.
Hawley, J., And Lukomnik, J. (2018).The third, systems stage of corporate governance: Why
institutional investors need to move beyond modern portfolio theory. [Online]. Available 27 May,
2019
https://www.researchgate.net/profile/James_Hawley2/publication/323323162_The_third_systems_
stage_of_corporate_governance_Why_institutional_investors_need_to_move_beyond_modern_po
rtfolio_theory/links/5a8e058daca272c56bc408c8/The-third-systems-stage-of-corporate-
governance-Why-institutional-investors-need-to-move-beyond-modern-portfolio-theory.pdf.
Morningstar.(2012).Are Your Fund’s Returns Worth the Risk?. [Online]. Available 27 May, 2019
https://www.morningstar.in/posts/9320/are-your-funds-returns-worth-the-risk.aspx.
U.S.News.(2018).What is modern portfolio theory?. [Online]. Available 27 May, 2019
https://money.usnews.com/investing/buy-and-hold-strategy/articles/2018-01-12/what-is-modern-
portfolio-theory.
Wu, Y. (2007 Performance Measurement. [Online]. Available 27 May, 2019
https://homepage.univie.ac.at/youchang.wu/5.pdf.
13

Appendix
14
14
1 out of 15
Related Documents


Your All-in-One AI-Powered Toolkit for Academic Success.
+13062052269
info@desklib.com
Available 24*7 on WhatsApp / Email
![[object Object]](/_next/static/media/star-bottom.7253800d.svg)
Unlock your academic potential
© 2024 | Zucol Services PVT LTD | All rights reserved.